A Soft Computing Technique for Characterization
of Power Quality Events
P.Murugesan1, Dr.C.Sharmeela2, Dr.S.Deepa3 1, 2, 3
Dept of EEE, SCSVMV University, College of Engineering, Kingston Engineering College
Abstract: The Power quality disturbances in the signal are unpredictable interruptions of pure sine wave. The magnitude of voltage and frequency deviates from normal value leading to economic loss. To make protection against the equipments on consumer side as well as generation, transmission and distribution side a fast, accurate detection and classification are required. In this paper, a digital signal processing technique is used to Hybrid Hilbert Transform and Discrete Wavelet Transform (HT-DWT) for tracking the signal disturbance and characterization of Instantaneous voltage variations are presented. The Hilbert Transform estimates the magnitude of the voltage signal as envelope and discrete wavelet transform detects the time duration of disturbance in the signal. A fuzzy logic controller recognize the type of voltage variation, a rule-based method for the final identification and decision making according to IEEE Std 1159-2009. The techniques presented in the literature for tracking voltage variations such as Fourier transform, Fast Fourier transform and short time Fourier transform and neural network techniques increase the computational burden and time of tracking. The new methodology does not require training stage. Therefore, its development is easier and its efficiency does not depend on a data training set. The Performance of the methodology is validated and tested using synthetic signals.
Keywords: Fuzzy logic controller (FLC), Hilbert transform (HT), Discrete Wavelet transform (DWT), Power Quality (PQ).
I. INTRODUCTION
With the increasing usage of electronic gadgets, solid state devices lead to nonlinear loads. Such electrical equipments are susceptible to the variation in power supply lines and hence Power quality (PQ) assessments have become a very important task and interesting topic for many researchers globally [1]–[4]. Among the different disturbances that harmfully affect the PQ are Short duration variations (voltage sags, voltage swells and interruptions), usually associated with removal/inclusion of load, motor initiation, energisation of transformer, and network failures are the most important variations in voltage supply [5]–[8].
For the past two decades, researchers have developed some techniques, Algorithm and methodologies to monitor the magnitude of voltage variations [9]-[11]. To perform control tasks and to activate protection in time, it is necessary to quantify the severity of voltage variation. An effective and accurate measurement of such voltage variations is mandatory. According to IEEE Std 1159-2009 [12], the detection and classification of voltage variations using Root Mean Square (RMS) is the emblematic frame based method. Hence, the predicted RMS value is calculated on a time-window basis, which partially compromises the time resolution with a delay of one cycle [13].
The organization of this paper is as follows. In Section II, a brief theoretical background is introduced. The description of the methodology is presented in Section III. Section IV shows the case study which is used to evaluate the performance of the proposal. Finally, the conclusions are presented in Section V.
II. THEORETICAL BACKGROUND
This section introduces a brief theoretical background on the topics addressed in this paper: the description of voltage variations according to IEEE standard 1159, HT, DWT and the FLC techniques are used for the automatic tracking of voltage variations.
A. Ieee Standard 1159-2009
This standard presents a recommended practice for monitoring the PQ of single-phase and multiphase AC power systems. With regard to voltage variations, it provides the nominal conditions of power supply as well as the deviations from those nominal conditions: typical duration and typical voltage magnitude for each category are implemented [12].The PQ synthetic signals are modelled using Table1 [28].
Class PQ disturbance Equation of Modelling Value of Parameters
C1 Sinusoidal wave x(t ) = A sin(ωt ) A=1.0 ; f=50Hz ; ω=2πf
C2 Voltage Sag
x(t ) = A(1 −α (u(t − t1 ) − u(t − t2 ))) sin(ωt );
t1 < t2 , u(t ) = 1, t ≥ 0
0.1 ≤α≤ 0.9 , T ≤ t2 − t1 ≤ 8T
C3 Voltage Swell
x(t ) = A(1 + α (u(t − t1 ) − u(t − t2 ))) sin(ωt );
t1 < t2 , u(t ) = 1, t ≥ 0
0.1 ≤α≤ 0.8 , T ≤ t2 − t1 ≤ 8T
C4 Momentary Interruption
x(t ) = A(1 + α (u(t − t1 ) − u(t − t2 ))) sin(ωt );
t1 < t2 , u(t ) = 1, t ≥ 0
0 ≤α≤ 0.09 , T ≤ t2 − t1 ≤ 8T
TABLE1: MODELING OF POWER QUALITY DISTURBANCE
B. Hilbert transform
The HT of a signal x (t) is defined as the convolution of the signal with the function 1/t as follows
(1) The analytic signal xa(t) is obtained from coupling x(t) and its HT as a complex signal as follows:
xa(t) = x(t) + j y(t) = A(t)e j ϕ (t) (2)
A(t) = [x2(t) + y2(t)]1/2 (3)
ϕ(t) = tan−1(y(t)/x(t)) (4)
Where A (t) is the instantaneous amplitude and ϕ(t) is the instantaneous phase of the complex analytic signal, A(t) is also known as
the envelop of x(t), which can be used for tracking the magnitude of voltage variations .
C. Discrete wavelet transform
The DWT consists of a set of functions namely scaling and wavelet function associated with filter banks. The continuous Wavelet
Transform of a continuous time signal x(t) is defined as
, a,b∈R , a ≠ 0 (5)
Where ψ*a,b(t) = (6)
ψ(t) is the mother wavelet where ‘a’ and ‘b’ are scaling and translating parameters respectively. The DWT is obtained from continuous Wavelet Transform by replacing x(t) by x(k) where x(k) is the sampled signal. The Discrete Wavelet Transform of a time signal x(k) is defined as
Where = (8)
Where m and n are the translation and scaling parameters of discrete wavelet transform, ao and bo are integers. The Multi Resolution Analysis (MRA) consists of filter banks of low pass and high pass filters. The high pass filter gives a fine detailed version of the signal ‘d1’ and low pass filter gives the coarse approximate version of the signal ‘a1’ at the first resolution level of decomposition, whose frequency band is divided into two equal half fs/2. During second resolution level the signal ‘a1’ is further decomposed into ‘d2’ and ‘a2’ whose frequency band is fs/4 . For third resolution level the frequency band is fs/8 which produces the signal ‘d3’ and ‘a3’ and the process is again repeated for different resolution levels and frequency bands.
Fig.1 shows the MRA decomposition of a signal with four levels, sampled at a frequency of 15.8 kHz into four bands of frequency. ‘a4’ is the level of approximation with the lowest frequency band of low pass filter and ‘d1’,’d2’,’d3’ and’d4’ are respective details or the high frequency(scale) band of high pass filter.
Fig.1 MRA Decomposition
D. Fuzzy logic system
FL systems represent a group of rules for reasoning under uncertainty or in an imprecise manner. They are commonly used when a physical process has to be represented by means of a mathematical model. But the model does not exist or is very complex to be implemented or evaluated in real time applications [16]. The FL system consists of four stages viz. fuzzification, inference mechanism, rule-based mechanism and defuzzification. The fuzzification stage receives information from the inputs that the inference mechanism can recognize. An inference mechanism is used to understand and perform the decision making process. The rule-based mechanism is used to achieve the goal by means of a set of if–then rules. The defuzzification stage is used to convert the output of the inference mechanism into meaningful information for the end user [20-23].
III. METHODOLOGY
The Hybrid signal processing technique for automatic detection and classification of instantaneous tracking and characterization of voltage variations is shown in Fig. 2. It consists of three stages: an initial stage for tracking the magnitude of the voltage; an identification stage, and a final classification stage. For implementing the overall methodology, the MATLAB software is used.
A. Voltage Magnitude tracking
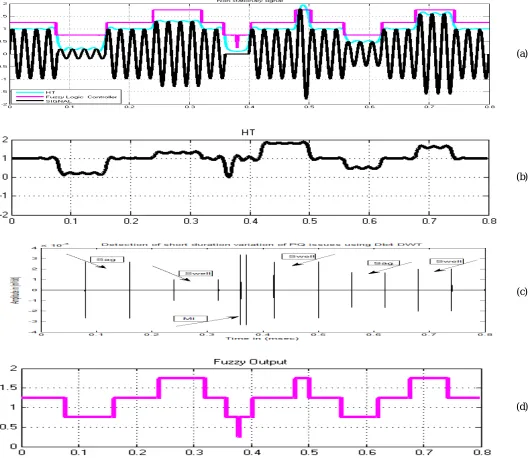
The synthetic PQ signals are modeled using Table I with a sampling frequency of (Fs) 15.8 KHz. Fig. 3(a) shows a short duration variation of synthetic continuous signal with random sags, swells, and interruptions. When the signal is employed to signal processing technique, simultaneous detection of time duration and tracking of magnitude are obtained. The HT provides the
information of magnitude variation of the voltage as envelope asshown in Fig. 3(b). The DWT Daubechies’fourth order is applied
to the signal in order to detect the start and end point of the voltage variation of the signal. The detail1 (Db4) output is shown in Fig. 3(c) and the fuzzy logic output is shown in Fig. 3(d).
(a)
(b)
(c)
[image:5.612.45.576.183.641.2](d)
Fig. 3. Detection of voltage variation. (a) Signal with random sags, swells, and interruption. (b) Time duration output of DWT. (c) Envelope output of HT. (d) Fuzzy output.
B. Voltage variation tracking
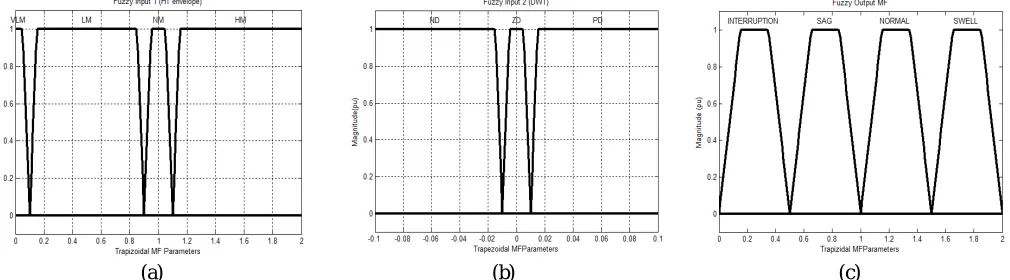
while the output is an instantaneous voltage variation. For fuzzification, the voltage magnitude input is partitioned into four trapezoidal membership functions, as shown in Fig. 4(a), which are labeled as follows: very low magnitude (VLM), low magnitude (LM), normal magnitude (NM), and high magnitude (HM). The second input is partitioned into three trapezoidal inputs, as shown in Fig. 4(b), which are labeled as follows: negative DWT (ND), zero DWT (normal ZD), and positive DWT (PD), while the output is divided into four trapezoidal membership functions, labeled as interruption, sag, normal, and swell as shown in Fig. 4(c). The FL system performs least amount composition for quantifying the output of the rules. The parameter of membership function lies between 0.5 and 4.5, with the knowledge of authors [23]. In this view, the fuzzy inference mechanism has the following rules [26].
1) If (HT envelope is VLM) and (DWT is negative), then (output is interruption).
2) If (HT envelope is VLM) and (DWT is normal), then (output is interruption).
3) If (HT envelope is VLM) and (DWT is positive), then (output is sag)
4) If (HT envelope is LM) and (DWT is negative), then (output is sag).
5) If (HT envelope is LM) and (DWT is normal), then (output is sag).
6) If (HT envelope is LM) and (DWT is positive), then (output is normal).
7) If (HT envelope is NM) and (DWT is negative), then (output is normal).
8) If (HT envelope is NM) and (DWT is normal), then (output is normal).
9) If (HT envelope is NM) and (DWT is positive), then (output is normal).
10) If (HT envelope is HM) and (DWT is negative), then (output is normal).
11) If (HT envelope is HM) and (DWT is normal), then (output is swell).\
12) If (HT envelope is HM) and (DWT is positive), then (output is swell).
C. Classification stage
Fig. 3(a) shows the synthetic signal with occurrence of multiple PQ issues in a continuous signal at different period of time. Fig. 3(b) shows the output of HT which tracks the magnitude of envelope at appropriate time. Fig. 3(c) shows the output of DWT which detects the duration of time accurately. The FL outputs for the signal in Fig. 3(d) tracks and classifies the voltage variation which the observer can monitor over a time (sample to sample). It is an advantage since it does not require a batch of data to give a result as the case of other classifiers such as neural networks. Even though the magnitude (scales) of DWT output is very low in magnitude, it acts as an input to the FL system, to detect the starting and ending time of the voltage variations of the overall methodology. The recognition of the voltage variation is carried out using an expert fuzzy based system which is simple, more effective and efficient method to categorize the hypothetical conditions.
(a) (b) (c)
Fig. 4. Membership functions (a) (envelope) HT Fuzzy input 1, (b) DWT Fuzzy input 2, and (c) Fuzzy output.
IV. CASE STUDY
[image:6.612.52.557.462.602.2]Efficiency = (9)
Fig.5.a shows the voltage swell of 90% with the time t1=0.03sec and t2=0.08sec, and the comparison of HT and Fuzzy output are depicted, in which DWT was not included; the reason is that the output of DWT is very low magnitude (scales) which was depicted separately in Fig.5.b.The HT output shown Fig.5.c.tracks the magnitude envelope in the upward direction (above the magnitude of p.u value) for voltage swell. The output of DWT, HT and Fuzzy tracks the magnitude of voltage variation and duration of starting and ending time absolutely.
Fig.6.a. shows the voltage sag of 60% with the time t1=0.03sec and t2=0.08sec, with the comparison of HT and Fuzzy output. The outputs of DWT, HT and Fuzzy are depicted in Fig.6. [b-d]. The HT output shown in Fig.6.c. tracks the magnitude envelope in the downward direction (below the magnitude of p.u value) for voltage sag. The output of Fuzzy tracks the magnitude of voltage variation and duration of starting and ending time precisely.
(a) (a) (a)
(b) (b) (b)
(d) (d) (d)
Fig. 5. Fig. 6. Fig. 7.
Fig.[ 5-7]. Detection of voltage variation (a) Signal with swell, sag, interruption (b) Time duration output of DWT. (c) Envelope output of HT. (d).Fuzzy output
Fig.7.a. shows the voltage Interruption of 100% with the time t1=0.03sec and t2=0.08sec, with the comparison of HT and Fuzzy output. The outputs of DWT, HT and Fuzzy are depicted in Fig.7. [b-d]. The HT output shown in Fig.7.c. tracks the magnitude envelope at zero level for 100% loss of power for more than two cycles. When it is less than a cycle, a spike at t=0.37 sec are depicted (below the magnitude of p.u value) in Fig.3.c and d.
PQ Class C1 C2 C3 C4
C1 1 - - -
C2 - 99 - 1
C3 - - 100 -
C4 - - - 100
Classification efficiency
in %
100 99 100 100
Classification
error in % 0 <1 0 0
Overall
[image:8.612.62.553.75.212.2]Efficiency 99.66%
TABLE 2: Results of Classification
V. CONCLUSION
This paper documents a new methodology for automatic detection and characterization of voltage variations such as sag, swell and interruption in instantaneous time, i.e., sample to sample. The Hybrid HT and wavelet detect the magnitude of voltage variation and time duration of event occurrence simultaneously with the induction of FL system which classifies the PQ events accurately. Unlike the other neural networks that require features extraction process, training the data set which increases the complexity and computational burden. The hybrid method reduces the computation, increases the accuracy, detects and classifies the PQ issues automatically. The signals are generated using MATLAB code, and analyzed for stored data (offline processing). The same technique can be investigated with other PQ issues and explored with FPGA implementation for online and real-time monitoring of voltage variations.
REFERENCES
[1] M. H. J. Bollen, “What is power quality?” Electr. Power Syst. Res.,vol. 66, no. 1, pp. 5–14, Jul. 2003
[2] D. Granados-Lieberman, R. J. Romero-Troncoso, R. A. Osornio-Rios,A. Garcia-Perez, and E. Cabal-Yepez, “Techniques and methodologies for power quality analysis and disturbances classification in power systems: A review,” IET Generat. Transmiss. Distrib., vol. 5, no. 4, pp. 519529, Apr. 2011.
[3] Z. Liu and Q. Zhang, “An approach to recognize the transient disturbances with spectral kurtosis,” IEEE Trans. Instrum. Meas., vol. 63, no. 1, pp. 46–55, Jan. 2014.
[image:8.612.199.415.315.479.2]2132–2138, Oct. 2008.
[6] C.-I. Chen and G. W. Chang, “An efficient Prony-based solution procedure for tracking of power system voltage variations,” IEEE Trans. Ind. Electron., vol. 60, no. 7, pp. 2681–2688, Jul. 2013.
[7] R. Naidoo and P. Pillay, “A new method of voltage sag and swell detection,” IEEE Trans. Power Del., vol. 22, no. 2, pp. 1056–1063,Apr. 2007.
[8] C. I. Chen and Y. C. Chen, “Intelligent identification of voltage variation events based on IEEE Std 1159-2009 for SCADA of distributed energy system,” IEEE Trans. Ind. Electron., vol. 62, no. 4, pp. 2604–2611, Apr. 2015, doi: 10.1109/TIE.2014.2348948.
[9] D.-J. Won, S.-J. Ahn, and S.-I. Moon, “A modified sag characterization using voltage tolerance curve for power quality diagnosis,” IEEE Trans. Power Del., vol. 20, no. 4, pp. 2638–2643, Oct. 2005.
[10] J. D. Barros and J. F. Silva, “Multilevel optimal predictive dynamic voltage restorer,” IEEE Trans. Ind. Electron., vol. 57, no. 8, pp. 2747–2760, Aug. 2010. [11] R. H. G. Tan and V. K. Ramachandaramurthy, “Voltage sag acceptability assessment using multiple magnitude-duration function,” IEEE Trans. Power Del.,
vol. 27, no. 4, pp. 1984–1990, Oct. 2012.
[12] A. Moschitta, P. Carbone, and C. Muscas, “Performance comparison of advanced techniques for voltage dip detection,” IEEE Trans. Instrum. Meas., vol. 61, no. 5, pp. 1494–1502, May 2012.
[13] IEEE Recommended Practice for Monitoring Electric Power Quality, IEEE Standard 1159-2009, Jun. 2009.
[14] M. Valtierra-Rodriguez, R. A. Osornio-Rios, A. Garcia-Perez, and R. de Jesus Romero-Troncoso, “FPGA-based neural network harmonic estimation for continuous monitoring of the power line in industrial applications,” Electr. Power Syst. Res., vol. 98, no. 1, pp. 51–57,May 2013.
[15] C. I. Chen, “Virtual multifunction power quality analyzer based on adaptive linear neural network,” IEEE Trans. Ind. Electron., vol. 59,no. 8, pp. 3321–3329, Aug. 2012.
[16] A. A. Abdelsalam, A. A. Eldesouky, and A. A. Sallam, “Characterization of power quality disturbances using hybrid technique of linear Kalman filter and fuzzy-expert system,” Electr. Power Syst. Res., vol. 83, no. 1, pp. 41–50, Feb. 2012.
[17] C.-I. Chen and G. W. Chang, “Virtual instrumentation and educational platform for time-varying harmonics and interharmonics detection,” IEEE Trans. Ind. Electron., vol. 57, no. 10, pp. 3334–3342, Oct. 2010.
[18] G. Betta, L. Ferrigno, and M. Laracca, “Cost-effective FPGA instrument for harmonic and interharmonic monitoring,” IEEE Trans. Instrum. Meas., vol. 62, no. 8, pp. 2161–2170, Aug. 2013.
[19] B. Biswal, M. Biswal, S. Mishra, and R. Jalaja, “Automatic classification of power quality events using balanced neural tree,” IEEE Trans. Ind. Electron., vol. 61, no. 1, pp. 521–530, Jan. 2014.
[20] K. M. Passino and S. Yurkovich, Fuzzy Control. Reading, MA, USA: Addison-Wesley, 1998.
[21] M. H. J. Bollen and I. Y. Gu, Signal Processing of Power Quality Disturbances, 1st ed. Piscataway, NJ, USA: IEEE Press, 2006.
[22] Electromagnetic Compatibility (EMC) Part 4: Testing and Measurement Techniques–Power Quality Measurement Methods, IEC Standard 61000-4-30, Geneva, Switzerland, 2008.
[23] M. Valtierra-Rodriguez, D. Granados-Lieberman, Jose E. Torres-Fernandez, Juan R. Rodríguez-Rodríguez, José Francisco Gómez-Aguilar, “A New Methodology for Tracking and Instantaneous Characterization of Voltage Variations”, IEEE Trans. on Instrumentation and Measurement , 2016.
[24] Shyh-Jier Huang, Tsai-Ming Yang and Jiann-Tseng Huang, “FPGA realization of wavelet transform for detection of electric power system disturbances”, IEEE Trans. on Power Delivery, vol.17, no.2, pp. 388-394, April 2002.
[25] Emmanouil styvaktakis, Math H.J Bollen, Irene Y. H. Gu, “Expert system for classification and analysis of power system events”, IEEE Trans. on Power Delivery, vol.17, no.2, pp.423-428, April 2002.
[26] Jiansheng Huang, Michael Negnevitsky, D. Thong Nguyen, “A neuralfuzzy classifier for recognition of power quality disturbances”, IEEE Trans. on power quality, vol.17, no.2, pp.609-616, April 2002.
![Fig.[ 5-7]. Detection of voltage variation (a) Signal with swell, sag, interruption (b) Time duration output of DWT](https://thumb-us.123doks.com/thumbv2/123dok_us/8300422.854233/8.612.199.415.315.479/detection-voltage-variation-signal-swell-interruption-duration-output.webp)
