algorithms
Minji Kim
1, Meizhen Zheng
1, Simon Zhongyuan Tian
1, Byoungkoo Lee
1, Jeffrey H. Chuang
1and Yijun Ruan
1,2*Abstract
The single-molecule multiplex chromatin interaction data are generated by emerging 3D genome mapping technologies such as GAM, SPRITE, and ChIA-Drop. These datasets provide insights into high-dimensional chromatin organization, yet introduce new computational challenges. Thus, we developed MIA-Sig, an algorithmic solution based on signal processing and information theory. We demonstrate its ability to de-noise the multiplex data, assess the statistical significance of chromatin complexes, and identify topological domains and frequent inter-domain contacts. On chromatin immunoprecipitation (ChIP)-enriched data, MIA-Sig can clearly distinguish the protein-associated interactions from the non-specific topological domains. Together, MIA-Sig represents a novel algorithmic framework for multiplex chromatin interaction analysis.
Keywords:3D genomics, Multiplex chromatin interactions, ChIA-Drop, Signal processing, Algorithms
Background
Traditional 3D genome mapping efforts have suggested complex chromosomal folding structures. In particular, methods based on high-throughput sequencing capture bulk chromatin contacts (Hi-C; Lieberman-Aiden et al. [18]) or enrich for chromatin contacts involving a spe-cific protein (ChIA-PET; Fullwood et al. [9]). Both of these methods rely on proximity ligation and therefore can only reveal population averages of pairwise contacts. Thus, they lacked the ability to simultaneously capture multiple loci involved in a chromatin complex in an in-dividual cell.
To overcome these drawbacks, novel experimental methods have recently been developed to capture multi-plex chromatin contacts with single-molecule resolution. For instance, GAM (Beagrie et al. [2]) identifies multi-way interactions by capturing multiple DNA elements co-existing in a given nuclear slice, SPRITE (Quinodoz et al. [25]) barcodes individual chromatin complexes via a split-pool strategy, and ChIA-Drop (Zheng et al. [31]) partitions each complex into a microfluidic droplet for
barcoding and amplification. Collectively, these emer-ging 3D genome mapping technologies are advancing the frontier of the nuclear architecture field. However, as with other genomic approaches prone to the background noise, the noisy and high-dimensional nature of the multiplex data poses unique computational challenges that cannot be readily addressed with existing tools that are tailored for pairwise interactions data.
Numerous software tools are available for analyzing data generated by genome-wide 3D architecture assays such as 3C, 4C, 5C, and the most common assay Hi-C. For example, HiCNorm (Hu et al. [10]) and Hi-Corrector (Li et al. [17]) explicitly or implicitly correct the bias observed in Hi-C data. Fit-Hi-C (Ay et al. [1]) and GOTHiC (Mifsud et al. [20]) aim to assess the stat-istical significance of intra-chromosomal contacts by in-corporating bias in the background null model. The authors of Fit-Hi-C emphasized the importance of ac-curately modeling the inverse relationship between gen-omic distance and contact probability. Similarly, multiplex data also depend on the distance, but cur-rently available tools cannot be naively applied since (1) genomic distance is now multi-dimensional instead of 1D, i.e., a complex withn-way contacts yieldn−1 neigh-boring distances and ðn2Þ ¼nðn−21Þ pairwise distances, and
© The Author(s). 2019Open AccessThis article is distributed under the terms of the Creative Commons Attribution 4.0 International License (http://creativecommons.org/licenses/by/4.0/), which permits unrestricted use, distribution, and reproduction in any medium, provided you give appropriate credit to the original author(s) and the source, provide a link to the Creative Commons license, and indicate if changes were made. The Creative Commons Public Domain Dedication waiver (http://creativecommons.org/publicdomain/zero/1.0/) applies to the data made available in this article, unless otherwise stated. * Correspondence:[email protected]
1The Jackson Laboratory for Genomic Medicine, Farmington, CT, USA 2Department of Genetics and Genome Sciences, University of Connecticut
(2) contact probability must be defined for all n-way contacts, yet it is unclear if ten-way contact is as likely as two-way contact.
Another crucial component in Hi-C data analysis is to call topologically associating domains (TADs), loosely defined as regions with more contacts inside than out-side. In general, TADs appear as squares along the diag-onal in the contact map, and the goal is to identify and segment the genome. There are more than 20 TAD call-ing algorithms (Zufferey et al. [32]), some of which con-vert the contact map into a 1D signal along the diagonal for subsequent segmentation or into a graph and apply community detection algorithms. To run the existing tools, multiplex data must first be converted into a con-tact map. However, enumerating over all possible pairs in a complex is computationally expensive and may introduce additional bias since the number of pairwise interactions increases quadratic in n. In other words, a complex with 5 fragments yields 28 pairs instead of 1 pair for a complex with 2 fragments. This approach would also lose valuable multiplexity information.
Conventional studies focused on interactions within these TADs identified computationally. However, a recent Hi-C study has suggested that multiple TADs can interact with each other to accommodate molecular functions dur-ing the development (Paulsen et al. [22]). The authors in-ferred confident domain-wise interactions by finding cliques in a graph, where nodes represent TADs and edges are contact frequency between TADs. Unlike Hi-C data-sets, the multiplex data naturally provide interactions among any number of TADs. Thus, it is desirable to ex-ploit this information and assess the statistical significance of these observed inter-TAD interactions.
In parallel, algorithms have been developed to analyze protein-enriched 3D architecture data from assays such as ChIA-PET. Similar to Hi-C, ChIA-PET data are also prone to bias and noise, which are computationally fil-tered out by statistical algorithms such as ChIA-PET tool (Li et al. [16]) and chiasig (Paulsen et al. [23]). The main idea is to model interaction frequency between two loci as hypergeometric distribution or the non-central hypergeometric distribution. To accommodate recently developed variants HiChIP (Mumbach et al. [21]) and PLAC-seq (Fang et al. [8]), researchers devel-oped hichipper (Lareau and Aryee [15]), fithichip (Bhat-tacharyya et al. [4]), and MAPS (Juric et al. [11]) to remove systematic biases and identify significant loops. In ChIA-PIPE (Capurso et al. [5]), the de-noising is done by filtering out loops without peak supports in the an-chors. Unfortunately, these tools are specifically designed to model interactions between two loci and would not readily generalize to those involving more than two loci.
Thus, to fill in the gap in novel software for analyzing multiplex data, we developed MIA-Sig (Multiplex
Interactions Analysis by Signal processing algorithms) with a set of Python modules tailored for ChIA-Drop and related data types. MIA-Sig has the following com-ponents: (1) calling statistically significant complexes and removing experimental noise, (2) calling TADs on multiplex data, and (3) identifying meaningful multi-way inter-TAD contacts.
Results
Distance test resolves multiplets and removes experimental noise
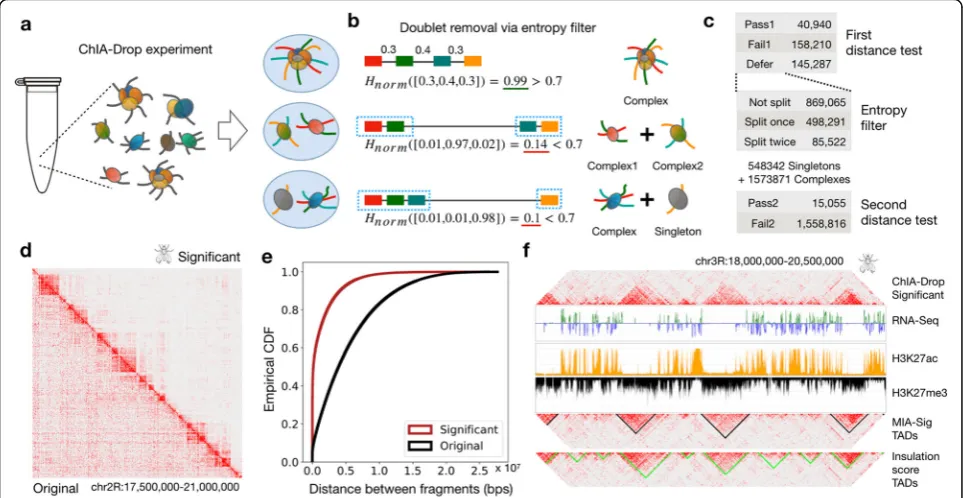
A central challenge in ChIA-Drop data analysis is to dis-tinguish the true biological chromatin complexes from the experimental noise. One possible source of noise is an event that two or more chromatin complexes are po-tentially encapsulated in the same microfluidic droplet and then are assigned the same barcode, yielding a multiplet (Fig. 1a). The problem also prevails in microfluidic-based single-cell RNA-seq data, which is then resolved computationally via dimensionality reduc-tion and clustering (Wolock et al. [30]). However, methods developed for single-cell transcriptomics data are not apt for multiplex chromatin interactions data since (1) the signal for chromatin interactions is point data (fragment is captured or not captured) rather than continuously valued data (gene expression level), and (2) multiplex chromatin interaction data are inherently more sparse than the single-cell transcriptomics data, due to the lack of cell barcodes.
Therefore, we devised a distance test with an entropy filter based on the biological knowledge that most mean-ingful chromatin interactions occur in a certain distance range, while those outside the range are likely noise (Lajoie et al. [14]). By converting the distances between fragments into a probability vector, we compute the nor-malized Shannon entropy (Shannon [27]), ranging from 0 to 1. If a droplet contains a single complex, the frag-ments are presumably close and equally spaced, resulting in high entropy close to 1. In the case of a doublet, two independent complexes would be separated by a single large distance, resulting in low entropy close to 0, which can then be separated into two singlets (Fig. 1b). The cutoff threshold is determined by the average normalized Shannon entropy of the expected null distribution as described below.
To identify significant chromatin complexes, a resampling-based distance test is applied before and after the entropy filter (Fig.1c; Additional file1: Figure S1a; the
“Methods”section). We verify that the distance distribu-tion of expected complexes from resampling
(computa-tional null) and that of pure DNA complexes
in theDrosophilaS2 ChIA-Drop data out of 3,075,926 pu-tative complexes (Additional file 1: Figure S1c). Filtering to retain significant complexes preserves the TADs along the diagonal of the 2D heat maps, while reducing the off-diagonal noise (Fig. 1d; visualization through Juicebox (Durand et al. [7])). A shift in distance distributions from large (original) to small (significant) supports that mean-ingful interactions are captured within 10 kb and 1 Mb, mostly from complexes with 5 or more fragments (Fig.1e; Additional file1: Figure S2).
Of the significant chromatin complexes, 15,055 (27%) were from the entropy filtering step that resolved dou-blets and triplets (Additional file1: Figure S3a,b). For ex-ample, of complexes with 3 fragments (in F3), 499,613
are identified as“singlets”due to high entropy, and 284, 540 are considered to be“doublets” due to low entropy. A general trend is that entropy is highest for those with-out any splits, lowest for a doublet with a singleton, and increases as the size of sub-complexes balance to be roughly equal.
Several parameters are fixed or to be chosen in the distance test. As mentioned earlier, the cutoff threshold
[image:3.595.57.539.89.338.2]of “real complexes” will be desirable in the future as more multiplex datasets become available.
Wavelet-based segmentation method identifies TADs overlapping inactive regions
From the significant complexes, it is desirable to automat-ically call TADs for downstream analyses. Many TAD calling algorithms exist for Hi-C data (Zufferey et al. [32]), yet all are based on pairwise contacts. To retain multiplex-ity information, we developed an algorithm to call TADs directly from the ChIA-Drop data (the “Methods” sec-tion). The idea is to convert complexes into 1D signal track then apply wavelet transformation (Mallat [19]) to smooth the signal while retaining clear change points (Additional file 1: Figure S4a). This approach allows us to identify clear gaps between TADs, rather than segmenting the genome into consecutive TAD regions (Additional file1: Figure S4b). MIA-Sig called 335 TADs with a wider range of sizes than 513 TADs called by pairwise“insulation score” (InS) approach; similarly, the gap sizes spanned a wider range for MIA-Sig TADs than for InS TADs (Additional file 1: Figure S5). Compared to InS TADs, the MIA-Sig TADs are less likely to overlap active regions characterized by high H3K27ac and low H3K27me3 (Fig. 1f), which are known to be the gaps between TADs in Drosophila (Rowley et al. [26]). This pattern is observed genome-wide: MIA-Sig TADs have a higher inactive mark (H3K27me3) than InS TADs, and MIA-Sig gaps have a higher ac-tive mark (H3K27ac) than InS gaps (Additional file 1: Figure S6).
Binomial test detects frequent interactions among two or more TADs
Most interactions occur within a single TAD, but 23% of significant complexes also cross two or more TADs (Additional file 1: Figure S7a), consistent with previous findings (Paulsen et al. [22]). Thus, we identified fre-quent interactions involving multiple TADs by counting the occurrences and performing a binomial test (Add-itional file 1: Figure S7b; the “Methods” section). A set of TADs with frequent contacts are ultimately assigned low p values (Additional file 1: Figure S7), which can guide the researchers to perform validation experiments.
Enrichment test retains strong interactions involving promoters
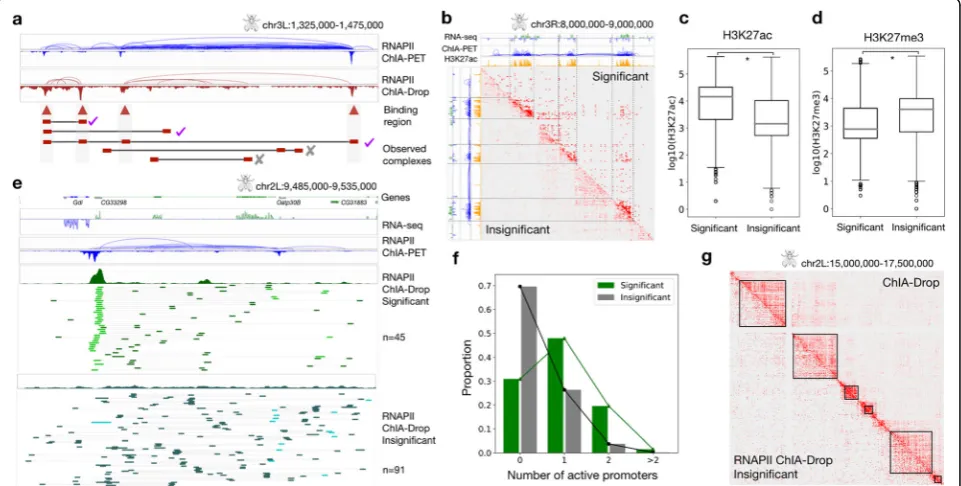
Similar to ChIA-PET, ChIA-Drop can also enrich chro-matin complexes involving a specific protein, such as RNAPII or CTCF. We implemented an enrichment test to estimate the significance of binding intensity of ob-served chromatin complexes and retain those with high binding intensity (Fig. 2a; the “Methods” section). An empirical null distribution is generated by placing the
observed complex on a random location in the chromo-some and recording the binding intensity. We verified that the empirical null and observed distributions differ significantly, with observed shifted to the right of the null (Additional file 1: Figure S8c,d). After the enrich-ment test, we retain 190,226 significant complexes out of 769,803 complexes (Additional file1: Figure S8).
These significant complexes have their fragments in highly enriched domains characterized by high RNA-seq expression and H3K27ac signal with abundant RNAPII ChIA-PET loops (Fig. 2b). Genome-wide patterns confirm that significant complexes are biased towards active regions, whereas insignificant complexes are not (Additional file 1: Figure S9). Moreover, significant complexes have higher median H3K27ac signals and lower median H3K27me3 sig-nals than insignificant complexes (Fig. 2c, d). A detailed view around a few genes shows that significant complexes are more likely to retain promoter-centric interactions than insignificant complexes (Fig. 2d; visualization through ChIA-View (Tian et al. [29])). This pattern is prevalent genome-wide, with 69% of significant complexes containing at least one promoter compared to only 30% of insignificant complexes (Fig.2f). Notably, significant complexes are most likely to capture one active promoter and one or more non-promoters—possibly enhancers—while insignificant complexes are prone to detect interactions among non-promoters (Additional file 1: Figure S10). Among the promoter-involving fragments, those in significant com-plexes have higher median gene expression than those in insignificant ones.
Insignificant RNAPII ChIA-Drop complexes emulate non-enriched ChIA-Drop data
As with many experimental protocols, the chromatin im-munoprecipitation step is not 100% efficient and typically yields a 20–40% efficiency rate (Tang et al. [28]). Thus, we take advantage of the fact that enriched ChIA-Drop data-sets also contain some background signal for chromatin complexes that did not specifically involve the protein of interest, similar to non-enriched ChIA-Drop data. Through the MIA-Sig enrichment test on RNAPII ChIA-Drop data, we can extract the non-enriched complexes from the insig-nificant complexes, which approximately emulate the ChIA-Drop data (Fig.2g).
Distance test can be applied to SPRITE data
We have developed MIA-Sig on ChIA-Drop and RNA-PII ChIA-Drop data, but it could also be applied for de-noising multiplex chromatin interactions from other methods, such as SPRITE and GAM.
barcode combination per chromatin complex. However, in practice, the split-and-pool process is limited to four to five rounds with a limited set of distinct barcodes, and in each round, potentially hundreds of thousands of chromatin complexes are assigned the same DNA oligo barcode. As a result, there is a certain non-zero probability of multiple complexes receiving an identical barcode combination. These unrelated complexes would be considered technical noise of SPRITE technique, which is somewhat similar to that of ChIA-Drop of unrelated complexes partitioned in the same microfluidic droplet.
As a proof-of-concept, we demonstrate the utility of MIA-Sig by performing the distance test on SPRITE data (Quinodoz et al. [25]) generated from F121 mouse em-bryonic stem cells (GSE114242). The data are pre-processed to convert reads into fragments of certain sizes and distances, and we selected intra-chromosomal complexes in chr18 (the “Methods” section). From the original 487,679 complexes, 11,984 complexes are identi-fied as significant by the 2 distance tests preceding and following the entropy filter (Fig. 3a). The 2D contact maps of original complexes exhibit off-diagonal noise,
whereas that of the significant complexes have the ma-jority of the signal along the diagonal (Fig. 3b). We plot the empirical cumulative distribution of the fragment-to-fragment distances of original and significant com-plexes and observe that significant comcom-plexes have shorter distances than original complexes (Fig. 3c; two-sided Kolmogorov-Smirnov test statistic = 0.18,pvalue < 2.2 × 10⁻¹⁶). These results indicate that MIA-Sig can in-deed assess the statistical significance of complexes cap-tured by SPRITE.
Discussion
Many tools exist for analyzing traditional proximity ligation-based chromatin interaction data, such as Hi-C and ChIA-PET. By contrast, there is a lack of tools to comprehend the data generated by the recently developed multiplex interaction mapping techniques. To fill in this gap, we have developed MIA-Sig that is specifically de-signed to analyze multiplex chromatin interaction data.
[image:5.595.58.539.90.333.2]enriched data. We applied an entropy concept from infor-mation theory to identify multiplets in ChIA-Drop and SPRITE data and implemented a simple yet relatively effi-cient method to evaluate the enrichment score of each complex in RNAPII ChIA-Drop data. In addition, we pro-posed a wavelet-based algorithm to call TADs on multi-plex data. A unique feature of this approach is the ability to clearly distinguish TADs from gaps, which is of bio-logical relevance inDrosophilasamples. In particular, it is shown that TADs and gaps interleave in Drosophila, un-like in human or mouse where gaps are not as critical as they are in Drosophila(Rowley et al. [26]). These TADs merely serve as a unit in the downstream analysis, where we investigate the occurrence of simultaneous interactions among two or more TADs through the binomial test. A recent study support that these occurrences are important during development (Paulsen et al. [22]). New algorithmic ideas in this work are implemented in a publicly available package, along with scripts to generate data QC plots. Hence, MIA-Sig serves as a comprehensive pipeline in-cluding both data quality control and data analysis.
Although potentially a useful package, MIA-Sig none-theless has its own drawbacks. One key assumption in the distance test is that a fragment far from the other fragments is likely a droplet contamination resulting in a doublet, a behavior yet to be confirmed experimentally and statistically. As with other TAD calling algorithms for Hi-C data, MIA-Sig’s TAD caller requires a set of pa-rameters such as wavelet level and window size. We pro-vide recommended parameters (Lajoie et al. [14]) for each representative model organism, but have not thor-oughly tested due to lack of datasets. A critical pitfall in the inter-TAD binomial test is that we do not normalize the TAD interaction frequency by distance and size. In other words, we expect the closer and larger TADs to interact more frequently than others. Finally, in perform-ing the enrichment test for RNAPII ChIA-Drop data, we
do not use a background distribution model and instead draw an empirical null distribution via random sampling. A disadvantage of this approach is the computational cost, which can be demanding for large human datasets.
In sum, all multiplex chromatin interaction data could have a significant level of noise, and the principle nature of the noises is conceptually similar. The algorithm used in MIA-Sig considers general issues that should be ap-plicable to all multiplex data. Although the current ver-sion of MIA-Sig is specifically developed based on the ChIA-Drop data, we demonstrated its capability to assess the significance of multiplex chromatin complexes in SPRITE data. With further modification and improvement, MIA-Sig should be directly applicable to any multiplex chromatin interaction data and also allow us to fully characterize similarity and differences between experimen-tal protocols.
Conclusions
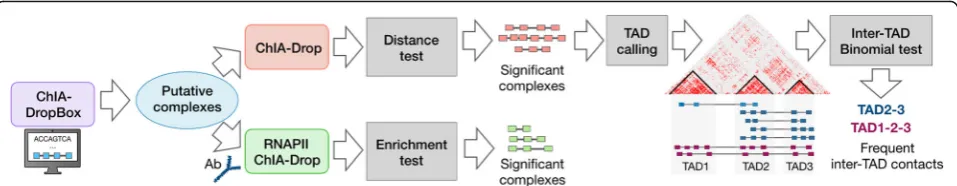
As we enter the era of single-cell and single-molecule 3D genome mapping, it will be imperative to develop al-gorithms to analyze data from these novel experimental protocols. We have presented an approach to solve the imminent problem of extracting statistically significant complexes from noisy signals, calling TADs, and identi-fying frequent inter-TAD contacts (Fig. 4). In addition, we offer a practical strategy to extract non-enriched ChIA-Drop from RNAPII ChIA-Drop.
[image:6.595.59.539.88.216.2]publicly available software package, MIA-Sig provides a valuable algorithmic framework for multiplex chromatin interaction data to be utilized by the broader scientific community.
Methods
Notation
An input dataset contains a set of chromatin complexes, each with two or more fragments. LetOCmbe the set of
fragments contained in the mth “observed complex” (OC), for m∈{1, 2,…,M}, and n= |OCm| is the size of
the set denoting the number of fragments in a complex. Each fragment u is subscripted by the complex index and superscripted by the fragment index and encodes the genomic location of its origin expressed as a triplet of chromosome, start and end positions. The distance d between fragments ua
m and ubm is start(ubm)−end(uam),
and neighboring (fragment-to-fragment; F2F) distances are encoded in a vector
xF2 FðOCmÞ ¼ d u1m;u2m
;d u 2m;u3m;…;d u nm−1;unm
;
and the total distance is dtot(OCm) = ∑xF2F(OCm); the
probability vector pF2 FðOCmÞ ¼xF2 F
ðOCmÞ
dtotðOCmÞ. For example,
if an eighth complex OC8¼ fu18;u28;u38g contains three
fragments (chr2L, 100, 500), (chr2L, 1000, 1500), and
(chr2L, 6000, 6500), then xF2F(OC8) = [500, 4500],
dtot(OC8) = 5000, and pF2 FðOCmÞ ¼ ½101;109. Finally,
we can partition M complexes OC1, OC2, …, OCM
intoFj, wherejis the number of fragments in a complex
(OC8belongs toF3since it has three fragments).
Distance test for non-enriched multiplex chromatin interactions data
Empirical null distribution and first distance test
Assuming that complexes are independent of chromo-some, we perform the distance test separately for each chromosome. Motivated by the fact that each fragment class Fj has distinct distributions in F2F
dis-tances, we construct the expected null background
distribution by randomly rewiring fragments. Specific-ally, all neighboring distances xF2F(OCm) for m∈{1, 2,
…,M} are placed in a bucket B. For each observed Fj,
we randomly draw j−1 elements (with replacement) from B to create 100,000 “expected complexes” (EC) ECkj for k∈{1, 2,…, 100,000} and store them in Fj′.
Note that since we only care about the distance be-tween fragments, we can assume that every fragment starts at (chr, 1, 500) and each fragment is of equal length. In practice, we store minimum information to save compute memory (implementation details below). For each OCm in Fj, we compare its total F2F
dis-tance to total F2F disdis-tance in F0j and record the pro-portion of expected complexes that have shorter distances than the observed complexes as the esti-mated “raw p value.” Formally, for a OCm∈Fj,
pvalrawðOCmÞ ¼
X100;000
k¼1 1fdtotðOCmÞ>dtotð ÞECkj g;
where 1{∗}is an indicator function. Assuming that
com-plexes in each fragment class are independent, we
subse-quently separate the raw pvalues byFjand adjust them
for multiple hypothesis testing using
Benjamini-Hochberg method (Benjamini and Benjamini-Hochberg [3]) with
false discovery rate (FDR) of 0.1. The complexes with
adjusted p value ≤0.1 are considered to be statistically
significant and are classified as “pass1” (Fj, pass1). Of
those insignificant complexes with adjusted p value >
0.1, we“fail1”(Fj, fail1) those with two fragments (OCm∈
F2with adjustedpvalue > 0.1) and treat others in a
sep-arate category called “defer” (Fj, def). These “deferred”
complexes are passed onto the entropy filter to correct for droplet contamination.
Entropy filter
[image:7.595.59.538.88.181.2]containing more than one chromatin complex (referred to as “doublet” for two, “triplet” for three, and “ multi-plet” for two or more). In single-cell RNA-seq (scRNA-seq; single-cell transcriptome) experiments, the outcome of a doublet would be a vector of real numbers indicat-ing average expression of the two cells. By contrast, ChIA-Drop data only provide binary values indicating if a fragment was captured or not, with a variable number of fragments. Therefore, the effect of two complexes ac-cidentally being encapsulated in a single droplet would be a large distance in the data. This assumption is based on the observation from Hi-C and ChIA-PET data ana-lysis that true interactions occur within certain range of genomic span. Our goal is to identify complexes with one dominating distance between fragments. Using the probability vector of the neighboring distance, we quan-tify the likelihood of a dominating event. Formally, for an observed complex OCm with n fragments and
pF2F(OCm) = [p1,p2,…,pn−1], we compute the
normal-ized Shannon entropy (Shannon [27])
HnormðpF2 FðOCmÞÞ ¼
Pn−1
i¼1pi log2
1
pi
log2ðn−1Þ :
The normalization factor log2(n−1) ensures that
Hnorm(x)∈[0, 1] for any probability vector x. Generally,
Hnorm is small when only one or two ofpi of are large,
in which case we presume that a complex is a multiplet and need to separate into singlets. For each observed complexes in the “deferred” category, we compare its normalized Shannon entropy to the average normalized Shannon entropy of the expected complexes in the cor-responding class; if the former is smaller, then we separ-ate the observed complex at the longest distance interaction. In other words, for OCm∈Fj, def, if
HnormðpF2 FðOCmÞÞ<
1 100;000
X100;000
k¼1 Hnorm pF2 F EC j k
;
then OCmis separated into
OCm, 1=fu1m;um;2 …;uSmgand OCm, 2=fuSmþ1;umSþ2;…;unmg, where dðuSm;umSþ1Þ ¼ maxxF2 FðOCmÞ. Furthermore, if the second largest distance is at least1
τof the largest
dis-tance, we also separate at the second longest distance.τ is a variable parameter and we set it to 2 in our analyses; the larger the τ, the more likelihood of a “second cut” (implying a triplet). The resulting sub-complexes are placed in Fj, def, filt and are now subject to the second
distance test. Note that we did not perform any statis-tical test in this step, only performed filtering. Also, the Shannon entropy merely serves as a quantification meas-ure for a single complex and should not be confused with the heterogeneity of all complexes in the ChIA-Drop data.
Second distance test
We repeat the distance test after correcting for possible doublets and triplets. For a OCm,∗∈Fj, def, filt
pvalraw OCm;
¼X100k¼1;0001d
totðOCm;Þ>dtotð ÞECkj :
We adjust raw p values using Benjamini-Hochberg method with false discovery rate (FDR) of 0.1. The com-plexes with adjustedpvalue≤0.1 are classified as“pass2” (Fj, pass2) and others are“fail2”(Fj, fail2). A diagram of the
distance test is illustrated in Additional file1: Figure S1a.
Implementation, results, and analysis
MIA-Sig takes putative chromatin complexes as the in-put, which are results of the ChIA-DropBox (Tian et al. [29]) data processing and visualization pipeline. The
“distance test”python (v3.6) script encompasses all parts using the following packages: numpy, random, statsmo-dels, itertools, os, and sys. We used the parameters --gen dm3 --fdr 0.1 --cef 2 --sz 100,000 to run the script on GSM3347523 dataset, which used 1.8 GB of memory and 13 min of CPU time. To save memory, we store minimal information for the null, total distance for ex-pected complexes, and their mean entropy for each frag-ment class. Two runs with the same parameters should yield identical results because we set seeds in the con-struction step for the expected complexes. By saving the first 1000 expected complexes for each class in a chromosome, we can compare our expected null model to the biological null model, which is the “pure DNA” described in (Zheng et al. [31]). Plotting the neighboring distances, we observed that both the computational null and pure DNA are unimodal with peaks between 1 and 10 Mbps for all classes (Additional file 1: Figure S1b). After confirming that our expected complexes do emu-late long-range noise, we obtained detailed statistics of each step resulting in 55,995 significant complexes (Additional file1: Figure S1c). Complexes in each of the
remove doublets and triplets. Of the 1,452,878 com-plexes in the deferred category ranging from n= 3 to n= 8, MIA-Sig identified 60% (869,065) to be singlets, 34% (498,291) to be doublets, and 6% (85,522) to be triplets, yielding 548,342 singletons (F1) and 1,573,871
complexes (F≥2) (Additional file 1: Figure S3). For
each class, singletons had the highest normalized Shannon entropy, followed by doublets and triplets. The entropy filter step allowed MIA-Sig to identify additional 15,055 complexes as significant, which amounts to 27% of the total significant complexes.
TAD calling for non-enriched multiplex chromatin interactions data
Generating 1D signal track
Existing TAD calling algorithms for pairwise Hi-C data generally fall into two categories: (1) signal segmentation after conversion from 2D contact maps into 1D tracks measuring interaction intensities along the genome and (2) community detection directly on the 2D heatmap by treating each bin as a node on an undirected graph. We take the first approach and convert our complexes into 1D signal track. A conventional pairwise approach would enumerate over all pairs of fragments in a complex and record their spans. However, multi-fragment complexes may over-contribute since the number of pairs grows qua-dratically:ðn
2Þ ¼
nðn−1Þ
2 , wherenis the number of fragments in a complex. Instead, we allow each complex to only con-tribute linearly inn by recording its span weighted byn. More precisely, coordinates are (chrom(u1
mÞ, start(u1m),
end(unm),n) for an OCmwithnfragments. We finally
ob-tain a“weighted complex span coverage”by accumulating the coordinates over all given complexes.
Smoothing and segmentation
Our next task is to segment the 1D track into regions with a high signal and annotate them as TADs. In an ideal case, we can achieve this goal by computing the slope of the signal s and by recording critical points where the slope is 0. However, our signal has a basepair resolution and thus is not smooth, resulting in too many false critical points. A common way to smooth the signal is by a moving average window, but using a large win-dow size would lose the resolution and yield TADs with fuzzy boundaries. Moreover, due to the inherent nature of TAD sizes, a window size parameter optimal in one
TAD boundaries (Additional file1: Figure S4). Using this
“smoothed” signal, we compute the slope and fine-tune TAD coordinates.
Implementation, results, and analysis
The “tad calling” python (v3.6) script encompasses all parts using the following packages: numpy, os, scipy, pywt, itertools, and sys. We used the parameters --cat PASS --bs 1000–sp drosophila --r dm3 to run the script on significant complexes from the distance test of GSM3347523 dataset, which used 84 MB of memory and 1 min of CPU time. Before generating the 1D signal track, we separate 2 fragments if they are more than 100 Kb apart, based on the upper range of general TAD sizes by organisms (Dekker and Heard [6]). Coverage was generated by BEDtools (Quinlan and Hall [24]) using“genomecov”function, and the coverage is binned into 1-Kb windows via“makewindows” and“map” com-mands. Signal smoothing was done by pywt package using the parameters “bior1.1” for wavelet function and
“3” for the level. MIA-Sig called 335 TADs over the 6
chromosomes, with a median size of 200 Kb
feature. Histone marks provide biological evidence that MIA-Sig TADs are inactive and gaps are active, but ChIA-Drop fragment counts provide a direct measure of TAD and gap intensities. Using the BEDtools command“ inter-sect -c,”we count the number of fragments in each region. MIA-Sig generally captured more fragments in TADs than InS did (Additional file1: Figure S6c) and less fragments in gaps than InS (Additional file1: Figure S6d). Finally, we annotate each fragment in significant and insignificant complexes as “TAD” or “gap” as called by MIA-Sig. For each complex, we count the number of TADs with at least 2 fragments within each TAD. Only 5% of the insignificant complexes had fragments in 1 or 2 TADs, and the rest were not contributing to the TAD structure (Add-itional file1: Figure S7a), validating the observation from 2D heatmaps. By contrast, only 26% of the significant complexes were not in TADs, a majority (51.3%) in intra-TAD interactions, and many (23%) connected 2 or more TADs. By observing that 12,884 complexes involve 2 to 21 TADs, we next sought to characterize if multiple com-plexes connect the same set of TADs.
Inter-TAD binomial test for non-enriched multiplex chromatin interaction data
Motivation and intuition
Our goal is to evaluate the statistical significance of these TAD combinations based on the frequency of oc-currence measured by the number of complexes therein. The problem is simple for a pair of TADs: we may treat a TAD as a ChIA-PET loop anchor and apply tools based on the hypergeometric test. However, our data are now multi-dimensional. For instance, suppose that there are five TADs and five combinations “A-C,” “B-C,” “ B-C-D,” “A-B-E,” and “A-D-E” (Additional file 1: Figure S7b). The pair“B-C”appears four times on its own, but also appears three times as a part of the triple “B-C-D.” Moreover, some parts of a combination may appear else-where with the same number of TADs: given “B-C-D” and “A-C-D,” “C-D” appears twice. Therefore, we propose a counting scheme based on the occurrence of
“expanded pairs.”
Methods
The notations used defined in this section are independ-ent from those in other sections. We let the ith combination be TCi¼ fT1i;Ti2;…;TNi g, where each
Tni∈fTAD1;TAD2;…;TADMg , N= ∣TCi∣ is the
number of TADs involved, and we partition each TCi
into the same class Gj if |TCi| =j. All pairs of TADs
in TCi are in Pa(TCi) = {{r,s} :r≠s, for r,s∈TCi} and
jPaðTCiÞj ¼nðn−21Þ. For each TCi, we record the number of
pairs in the same class as
aðTCiÞ ¼
X
y∈GN X
w∈Pað Þy
1w¼Pa TCð iÞ
and the number of exact appearance in higher class as
bðTCiÞ ¼X
w∉GN1TCi⊂w:
Using these two numbers, we compute the appearance of“pairs”in the same class and higher class
xðTCiÞ ¼aðTCiÞ þbðTCiÞ∙n n−1
2
:
Finally, we perform the binomial test with x(TCi) as
the number of success,kðTCiÞ ¼X
z∈Gj
xðzÞas the number
of trials, the probability of success hypothesized as p¼ 1
jGjj ; the alternative hypothesis is that the observed probability is greater than the expected probability p. A detailed example is provided using the same notations (Additional file 1: Figure S7b).
Implementation, results, and analysis
A python script “inter-TAD binomial test” implements the method using packages numpy, itertools, scipy, stats-models, os, and sys. Of 6861 unique combinations in-volving 2 to 21 TADs, 915 (13%) were identified as statistically significant. An example illustrates that a pair of TADs with a strong signal in the heatmap and many complexes in the linear view has lowerpvalue than that with a weak signal (Additional file 1: Figure S7c). Here, we assumed that the frequency of interactions between TADs is independent of their distance and sizes, and we also did not distinguish contacts with 2 fragments from those with 10 fragments. These parameters may be in-corporated in the future version.
Enrichment test for RNAPII-enriched multiplex chromatin interaction data
Motivation
The above sections are designed to analyze non-specific multiplex interaction data analogous to the Hi-C data. With an additional step of chromatin immunoprecipita-tion, enriched multiplex data reveal protein-specific interactions similar to the population average ChIA-PET loops. In a typical ChIA-PET analysis, loops anchored in strong binding peaks are considered to be more reliable than those with weak or no peaks. Extend-ing this notion to the multiplex data, we developed an enrichment test for RNAPII ChIA-Drop data. Our end goal is to retain complexes with fragments in strong binding peaks. One approach is to call peaks and only keep complexes that overlap the peak regions. However,
Statistical test
The idea is to take the observed complex and place it on a random location of the same chromosome and compare the mean coverage between the observed and the ex-pected. Through many rounds of re-sampling, we obtain the p value by counting the number of occurrences in which the expected coverage exceeds the observed cover-age (Additional file1: Figure S8a). More precisely, for an observed complex OCm¼ fu1m;um2;…;unmg, we randomly
draw an integer i∈f1;…;lengthðchromÞ−startðu1
mÞg and
the shiftδ¼startðu1
mÞ−i. The first expected complex is then
ECm1 ¼ fv1m;v2m;…;vmng, where startðvlmÞ ¼startðulmÞ−δ, and endðvl
mÞ ¼endðulmÞ−δfor alll∈{1,…,n}. Repeating this
process 10,000 times, we obtain ECm
k fork∈{1,…, 10,000}.
We can then compute the rawpvalue of themth observed complex as:
pvalrawðOCmÞ ¼
X10;000
k¼1 1covg OCð mÞ<covg ECð mkÞ;
where covgðOCmÞ ¼1nPnl¼1
fcsðstartðul
mÞ;endðulmÞÞ
endðul
mÞ−startðulmÞ andfcs(x,y)
is the mean“fragment coverage signal” between
coordi-nates x and y. Raw p values are separated by
chromo-somes and are adjusted via the Benjamini-Hochberg method with a false discovery rate (FDR) of 0.1. The
complexes with adjusted p value≤0.1 are considered to
be statistically significant and are classified as “pass”;
others are considered insignificant or“fail.”
Implementation, results, and analysis
A python script “enrichment test” utilizes the packages numpy, random, statsmodels, os, and sys. GSM3347525 RNAPII ChIA-Drop data are pre-processed to exclude fragments mapped to the repetitive regions in the gen-ome (dm3.rmsk.bed), and 769,803 complexes remain as
“GSM3347525NR.” The most time-consuming part of the algorithm is to obtain the fragment coverage at a given location, since we need to search for a start and end indexes in a bedgraph or a bigwig file. With at least 769,803 × 2 × 10,000 = 1.54 × 10¹⁰operations, we realized that python implementations of exact search would be intractable. As means to reduce the runtime, we store the bedgraph file into bins of size 10 bp and store only the fourth column“value.”The solution then turns into a simple lookup operation, yielding an approximation that is close to the exact solution. Our code is
generated for each observed complex (Additional file 1: Figure S8c). Zooming in further, we note that the gram of the observed is shifted to the right of the histo-gram of the expected null (Additional file1: Figure S8d). Using the active and inactive regions defined in (Zheng et al. [31]), we count the number of fragments therein for significant and insignificant complexes (Additional file1: Figure S9a). For each active and inactive region, we com-pute the number of significant complex fragments and their log10 values are plotted (Additional file 1: Figure S9b); K-S test supports that significant complexes are in-deed more likely to be in active regions than in inactive re-gions. By contrast, insignificant complexes have no bias towards or against active regions (Additional file1: Figure S9c). We define a gene promoter as ± 1 KB from the tran-scriptional start site (TSS) annotated by UCSC genome browser. Note that typically ± 250 bp is used for Drosoph-ila, but we extend it to accommodate ChIA-Drop protocol-specific features. A gene is active (6466 genes) if the total RNA-seq level is greater than 5 and inactive (8874 genes) otherwise. A fragment is“active promoter”if it overlaps the promoter of an active gene. In general, sig-nificant complexes have higher proportion of promoter fragments than insignificant complexes (Additional file1: Figure S9d), and the skew is more pronounced for active promoters (Additional file 1: Figure S9e). Inactive pro-moters serve as a control, in which both significant and in-significant complexes display similar patterns in the number of inactive promoter fragments (Additional file1: Figure S9f,g).
Distance test on mouse F121 SPRITE data
the parameters --gen mm9 --fdr 0.1 --cef 2 --sz 10,000. One modification is that during the first distance test, we “fail” the complexes with more than 100 fragments. The resulting master file is used for generating the 2D contact maps for ALL and PASS categories by enumer-ating all pairs of fragments in a complex (Fig.3b). Like-wise, the empirical cumulative distribution function is plotted for ALL and PASS categories (Fig.3c).
Supplementary information
Supplementary informationaccompanies this paper athttps://doi.org/10. 1186/s13059-019-1868-z.
[image:12.595.302.538.154.738.2]Additional file 1: Figure S1.Overview of distance test, comparison of computational and experimental null distribution, and summary statistics. Figure S2.Characteristics of original, significant, and insignificant complexes.Figure S3.Effects of the entropy filter.Figure S4.Ideas behind the MIA-Sig TAD calling algorithm.Figure S5.Statistics of TAD and gap sizes called by MIA-Sig and Insulation Score.Figure S6. Com-parison of TADs and gaps by MIA-Sig and Insulation Score.Figure S7. Inter-TAD binomial test.Figure S8.Overview of enrichment test for RNA-PII ChIA-Drop data.Figure S9.Comparison of significant and insignificant RNAPII complexes.Figure S10.Annotation of fragment as an active pro-moter, inactive propro-moter, or non-promoter.
Additional file 2.Review history.
Acknowledgements
The authors thank all members of the Ruan and Chuang Lab for helpful discussions.
Review history
The review history is available as Additional file2.
Peer review information
Barbara Cheifet was the primary editor of this article and managed its editorial process and peer review in collaboration with the rest of the editorial team.
Authors’contributions
MK, MZ, and YR conceived the study. MK devised the algorithms and wrote the MIA-Sig Python software with input from all authors. MZ developed and per-formed the Drop experiments. SZT developed and provided the ChIA-View software. SZT and BL contributed parts of the analyses. MK, JHC, and YR wrote the manuscript. All authors read and approved the final manuscript.
Funding
This study is supported by a Jackson Laboratory Director’s Innovation Fund (DIF19000-18-02). YR is funded by 4DN (U54 DK107967) and ENCODE (UM1 HG009409) consortia. YR is also funded by Human Frontier Science Program (RGP0039/2017) and supported by Florine Roux Endowment.
Availability of data and materials
The MIA-Sig software is available under the MIT License at GitHub [12]. A ver-sion of the source code used in this manuscript is deposited on Zenodo [13]. ChIA-Drop (GSM6647523) and RNAPII ChIA-Drop (GSM3347525) data were downloaded from the Gene Expression Omnibus (GEO) under Super-Series accession number GSE109355 [31]. SPRITE“mouse_combined_clusters” data were downloaded from the GEO under SuperSeries accession number GSE114242 [25]. A link to the pure DNA ChIA-Drop data and processed files of relevant data is also available through the MIA-Sig GitHub page [12].
Ethics approval and consent to participate Not applicable.
Consent for publication Not applicable.
Competing interests
The authors declare that they have no competing interests.
Received: 3 August 2019 Accepted: 28 October 2019
References
1. Ay F, Bailey TL, Noble WS. Statistical confidence estimation for Hi-C data reveals regulatory chromatin contacts. Genome Res. 2014;24(6):999–1011. 2. Beagrie RA, Scialdone A, Schueler M, Kraemer DC, Chotalia M, Xie SQ,
Barbieri M, de Santiago I, Lavitas LM, Branco MR, Fraser J. Complex multi-enhancer contacts captured by genome architecture mapping. Nature. 2017;543(7646):519.
3. Benjamini Y, Hochberg Y. Controlling the false discovery rate: a practical and powerful approach to multiple testing. J R Stat Soc Ser B Methodol. 1995;57(1):289–300.
4. Bhattacharyya S, Chandra V, Vijayanand P, Ay F. FitHiChIP: identification of significant chromatin contacts from HiChIP data. bioRxiv. 2018;1:412833. 5. Capurso D, Wang J, Tian SZ, Cai L, Namburi S, Lee B, Tjong H, Tang Z, Wang
P, Wei CL, Ruan Y. ChIA-PIPE: a fully automated pipeline for ChIA-PET data analysis and visualization. bioRxiv. 2018;1:506683.
6. Dekker J, Heard E. Structural and functional diversity of topologically associating domains. FEBS Lett. 2015;589(20PartA):2877–84. 7. Durand NC, Robinson JT, Shamim MS, Machol I, Mesirov JP, Lander ES,
Aiden EL. Juicebox provides a visualization system for Hi-C contact maps with unlimited zoom. Cell systems. 2016;3(1):99–101.
8. Fang R, Yu M, Li G, Chee S, Liu T, Schmitt AD, Ren B. Mapping of long-range chromatin interactions by proximity ligation-assisted ChIP-seq. Cell Res. 2016;26(12):1345.
9. Fullwood MJ, Liu MH, Pan YF, Liu J, Xu H, Mohamed YB, Orlov YL, Velkov S, Ho A, Mei PH, Chew EG. An oestrogen-receptor-α-bound human chromatin interactome. Nature. 2009;462(7269):58.
10. Hu M, Deng K, Selvaraj S, Qin Z, Ren B, Liu JS. HiCNorm: removing biases in Hi-C data via Poisson regression. Bioinformatics. 2012;28(23):3131–3. 11. Juric I, Yu M, Abnousi A, Raviram R, Fang R, Zhao Y, Zhang Y, Qiu Y, Yang Y,
Li Y, Ren B. MAPS: model-based analysis of long-range chromatin interactions from PLAC-seq and HiChIP experiments. PLoS Comput Biol. 2019;15(4):e1006982.
12. Kim M, Zheng M, Tian SZ, Lee B, Chuang JH, Ruan Y. MIA-Sig: multiplex chromatin interaction analysis by signal processing and statistical algorithms. GitHub. 2019;https://github.com/TheJacksonLaboratory/mia-sig. 13. Kim M, Zheng M, Tian SZ, Lee B, Chuang JH, Ruan Y. MIA-Sig: multiplex
chromatin interaction analysis by signal processing and statistical algorithms (version 0.1). Zenodo. 2019.https://doi.org/10.5281/zenodo.3496949. 14. Lajoie BR, Dekker J, Kaplan N. The Hitchhiker’s guide to Hi-C analysis:
practical guidelines. Methods. 2015;72:65–75.
15. Lareau CA, Aryee MJ. hichipper: a preprocessing pipeline for calling DNA loops from HiChIP data. Nat Methods. 2018;15(3):155.
16. Li G, Fullwood MJ, Xu H, Mulawadi FH, Velkov S, Vega V, Ariyaratne PN, Mohamed YB, Ooi HS, Tennakoon C, Wei CL. ChIA-PET tool for comprehensive chromatin interaction analysis with paired-end tag sequencing. Genome Biol. 2010;11(2):R22.
17. Li W, Gong K, Li Q, Alber F, Zhou XJ. Hi-Corrector: a fast, scalable and memory-efficient package for normalizing large-scale Hi-C data. Bioinformatics. 2014;31(6):960–2.
18. Lieberman-Aiden E, Van Berkum NL, Williams L, Imakaev M, Ragoczy T, Telling A, Amit I, Lajoie BR, Sabo PJ, Dorschner MO, Sandstrom R. Comprehensive mapping of long-range interactions reveals folding principles of the human genome. Science. 2009;326(5950):289–93. 19. Mallat SG. A theory for multiresolution signal decomposition: the wavelet
representation. IEEE Trans Pattern Anal Mach Intell. 1989;1(7):674–93. 20. Mifsud B, Martincorena I, Darbo E, Sugar R, Schoenfelder S, Fraser P,
Luscombe NM. GOTHiC, a probabilistic model to resolve complex biases and to identify real interactions in Hi-C data. PLoS One. 2017;12(4):e0174744. 21. Mumbach MR, Rubin AJ, Flynn RA, Dai C, Khavari PA, Greenleaf WJ, Chang
HY. HiChIP: efficient and sensitive analysis of protein-directed genome architecture. Nat Methods. 2016;13(11):919.
organization. Mol Cell. 2017;67(5):837–52.
27. Shannon CE. A mathematical theory of communication. Bell Syst Tech J. 1948;27(3):379–423.
28. Tang Z, Luo OJ, Li X, Zheng M, Zhu JJ, Szalaj P, Trzaskoma P, Magalska A, Wlodarczyk J, Ruszczycki B, Michalski P. CTCF-mediated human 3D genome architecture reveals chromatin topology for transcription. Cell. 2015;163(7): 1611–27.
29. Tian SZ, Capurso D, Kim M, Lee B, Zheng M, Ruan Y. ChIA-DropBox: a novel analysis and visualization pipeline for multiplex chromatin interactions. bioRxiv. 2019;1:613034.
30. Wolock SL, Lopez R, Klein AM. Scrublet: computational identification of cell doublets in single-cell transcriptomic data. Cell Syst. 2019;8(4):281–91. 31. Zheng M, Tian SZ, Capurso D, Kim M, Maurya R, Lee B, Piecuch E, Gong L,
Zhu JJ, Li Z, Wong CH. Multiplex chromatin interactions with single-molecule precision. Nature. 2019;566(7745):558.
32. Zufferey M, Tavernari D, Oricchio E, Ciriello G. Comparison of computational methods for the identification of topologically associating domains. Genome Biol. 2018;19(1):217.
Publisher’s Note