R E S E A R C H
Open Access
Transcriptome-wide RNA processing
kinetics revealed using extremely short 4tU
labeling
J. David Barrass
1†, Jane E. A. Reid
1†, Yuanhua Huang
2†, Ralph D. Hector
3,4, Guido Sanguinetti
2,3,
Jean D. Beggs
1*and Sander Granneman
3*Abstract
Background:RNA levels detected at steady state are the consequence of multiple dynamic processes within the cell. In addition to synthesis and decay, transcripts undergo processing. Metabolic tagging with a nucleotide analog is one way of determining the relative contributions of synthesis, decay and conversion processes globally.
Results:By improving 4-thiouracil labeling of RNA inSaccharomyces cerevisiaewe were able to isolate RNA produced during as little as 1 minute, allowing the detection of nascent pervasive transcription. Nascent RNA labeled for 1.5, 2.5 or 5 minutes was isolated and analyzed by reverse transcriptase-quantitative polymerase chain reaction and RNA sequencing. High kinetic resolution enabled detection and analysis of short-lived non-coding RNAs as well as intron-containing pre-mRNAs in wild-type yeast. From these data we measured the relative stability of pre-mRNA species with different high turnover rates and investigated potential correlations with sequence features.
Conclusions:Our analysis of non-coding RNAs reveals a highly significant association between non-coding RNA stability, transcript length and predicted secondary structure. Our quantitative analysis of the kinetics of pre-mRNA splicing in yeast reveals that ribosomal protein transcripts are more efficiently spliced if they contain intron secondary structures that are predicted to be less stable. These data, in combination with previous results, indicate that there is an optimal range of stability of intron secondary structures that allows for rapid splicing.
Keywords:Cryptic transcripts, Metabolic labeling, RNA sequencing, Splicing, Yeast
Background
The RNA levels detected in cells at steady state are the consequence of multiple dynamic processes within the cell. Eukaryotic genomes are pervasively transcribed, but the accumulation of many transcripts is limited by pro-cesses that regulate their synthesis and decay [1]. In addition, most primary transcripts undergo processing events. For example, small nuclear RNAs (snRNAs),
small nucleolar RNAs (snoRNAs), transfer RNAs
(tRNAs), microRNAs (miRNAs), small interfering RNAs
(siRNAs) and some long non-coding RNAs (lncRNAs) are often produced by the post-transcriptional process-ing of short-lived longer transcripts that are more readily detected in the absence of degradation or processing fac-tors [2]. A number of different classes of lncRNAs have been described in eukaryotes [3, 4]. The best character-ized examples in yeast are the stable unannotated tran-scripts (SUTs), cryptic unstable trantran-scripts (CUTs) and Xrn1-sensitive unstable transcripts (XUTs), three types of lncRNAs thought to have different stabilities [4]. SUTs are readily detectable in wild-type cells and share many similarities with messenger RNAs (mRNAs), whereas CUTs are generally more unstable and fre-quently only detectable in cells lacking the nuclear exo-some components. XUTs are likely (primarily) degraded * Correspondence:[email protected];[email protected]
†Equal contributors 1
Wellcome Trust Centre for Cell Biology, University of Edinburgh, Edinburgh EH9 3BF, UK
3Centre for Synthetic and Systems Biology (SynthSys), University of Edinburgh, Edinburgh EH9 3BF, UK
Full list of author information is available at the end of the article
in the cytoplasm because they accumulate in the absence of the cytoplasmic exoribonuclease Xrn1 [5].
In the case of intron-containing genes, the level of ma-ture transcripts is influenced by splicing, as well as by synthesis and decay. Splicing of pre-mRNAs (precursors of messenger RNAs) [6] occurs in the nucleus, often co-transcriptionally [7]. The spliced mRNA is exported to the cytoplasm where it can be translated, whereas the excised intron, which has a branched, lariat structure, is rapidly debranched and degraded. Measurements of in vivo RNA processing rates and efficiencies depend on the ability to estimate the levels of the unprocessed pre-cursors and processing intermediates in cell extracts; however, this is challenging because they are highly tran-sient and present in low abundance in wild-type cells at steady state.
A diverse range of methods has been used to measure the kinetics of RNA processing. One approach involves inhibiting RNA polymerase II (Pol II) activity with a transcription inhibitor such as 5,6-dichloro-1-β -D-ribo-benzimidazole, then removing this inhibition to promote synchronized transcription. For example, measuring the delay after Pol II reaches the 3′ ends of introns before the spliced flanking exons can be detected provides an estimate of the time for splicing [8]. Splicing kinetics have also been estimated in human cells using fluores-cence recovery after photobleaching and live cell im-aging, by measuring either the amount of time that fluorescently tagged spliceosomal small nuclear ribonu-cleoproteins associate with transcripts, or the time taken for an intron-tethered green fluorescent protein-fusion protein to be removed by splicing [9]. By these diverse approaches, estimates of the time taken to splice introns in human cells have varied between 30 s and 5–10 min. For budding yeast, Alexander et al. [10] used an indu-cible reporter gene and high resolution kinetic analysis of RNA by quantitative reverse transcription polymerase chain reaction (RT-qPCR), estimating that splicing oc-curred within 30s of the production of the pre-mRNA. There are also computational approaches for predicting the speed of RNA processing events [11].
Metabolic labeling is a way of proportionally enriching classes of RNA that are difficult to detect in wild-type cells at steady state. For example, 4-thiouridine (4sU) has been used to label newly synthesized transcripts in human cells [12] and budding yeast cells [13] followed by biotinylation of the thiolated RNA to allow its selective recovery for microarray analysis. Neymotin et al. [14] used 4-thiouracil (4tU) labeling of RNA in budding yeast followed by RNA sequencing o determine RNA degradation rates, from which synthesis rates were derived.
Labeling with 4sU has been used to measure RNA synthesis, decay and splicing rates in human and yeast;
however, the shortest labeling time was 3 min, by which time a substantial fraction of the newly transcribed RNA was already spliced or degraded [13, 15]. Therefore, to be able to measure RNA processing rates with higher ac-curacy and resolution transcriptome-wide, we have de-veloped an extremely short (as little as 60 s) 4tU RNA labeling protocol and combined it with high-throughput RNA sequencing (RNA-seq). We demonstrate that our method (4tU-seq) readily detects low abundance and labile transcripts in wild-type cells that are normally de-tected only in cells that are defective in RNA degrad-ation. Our data show that at such short times, lncRNA degradation kinetics depart significantly from first-order, and quantitatively associate lncRNA turnover with struc-tural features of the transcripts. Also, using 4tU-seq we could, for the first time, measure relative pre-mRNA splicing kinetics transcriptome-wide in budding yeast. Unexpectedly, our results show that fast splicing of intron-containing ribosomal protein mRNAs largely depends on the degree of secondary structure between the 5′splice site (5′ss) and branch point (BP) sequence and indicate that there is an optimal range of stability of intron secondary structures and base composition that allows for rapid splicing.
Results and discussion
Thiolated RNA can be efficiently recovered after very brief 4tU labeling
To isolate short-lived RNA species from the yeast Saccharomyces cerevisiae, we incubated cells with 4tU for very short periods, extracted the RNA, and treated it with a thio-reactive reagent to biotinylate the newly syn-thesized transcripts that contain thiol moieties [12, 16]. The biotinylated RNA was then affinity-purified with streptavidin. To improve 4tU incorporation during very short periods, the uptake of 4tU by yeast cells was en-hanced by overexpressing theFUI1 permease gene from a plasmid [17, 18]. Cell metabolism was rapidly halted by snap-freezing the labeled cells directly in very cold methanol, which is crucial for the recovery of short-lived RNAs [10]. Furthermore, each stage of the RNA isola-tion was carefully optimized to reduce background and maximize yield, in particular by using a modified binding and wash buffer (detailed in “Methods”). We used 4tU rather than 4sU for our studies because 4tU is much less expensive and gives very comparable incorporation rates (data not shown).
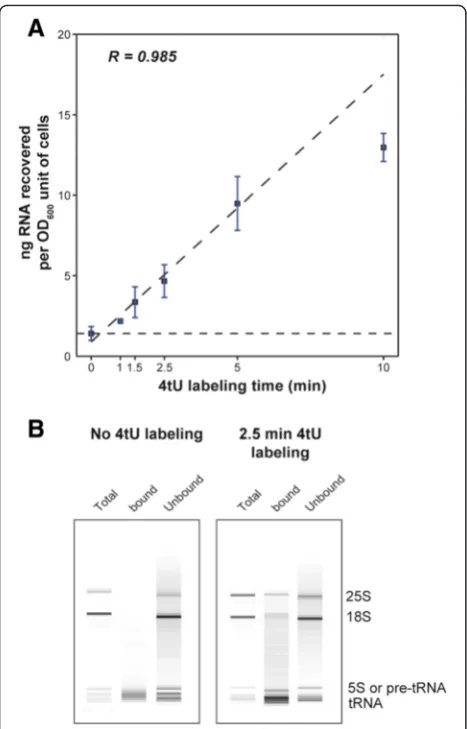
There was a linear increase in the yield of thiolated RNA over short labeling times up to 5 min, after which a component of the system became limiting (Fig. 1a; R2 = 0.99). Moreover, labeling for only 1.5 min was suffi-cient to achieve at least 2-fold enrichment over the back-ground (yield from an unlabeled sample). By fitting a line to the data to indicate background levels, we
deduced that the estimated time required before any 4tU was incorporated was about 30 s (Fig. 1a). Bioanalyzer analysis of mock samples indicated that most of the background consisted of short RNA species (Fig. 1b), which were mostly highly abundant tRNAs (Additional file 1: Figure S1).
4tU-seq proportionally enriches low stability species of RNA
We next performed RNA-seq on thiolated RNA (4tU-seq) isolated after 1.5, 2.5 and 5 min of 4tU labeling, on unlabeled control samples (i.e., “background”) and on rRNA-depleted total RNA, with all experiments per-formed at least twice. Additional file 1: Tables S1 to S14 provide all the results of our 4tU-seq data bioinformatics analyses. Additional file 1: Table S1 lists the total num-ber of uniquely mapped reads for each sample. Notably, for the majority of RNA species we did not observe a significant correlation between the fraction of uridines in the transcript and the read coverage or RNA half-life (Additional file 1: Table S2 and Figure S2). However, this was not the case for snRNAs, which had a small sample size (only six) and are renowned for being U-rich (Additional file 1: Table S2).
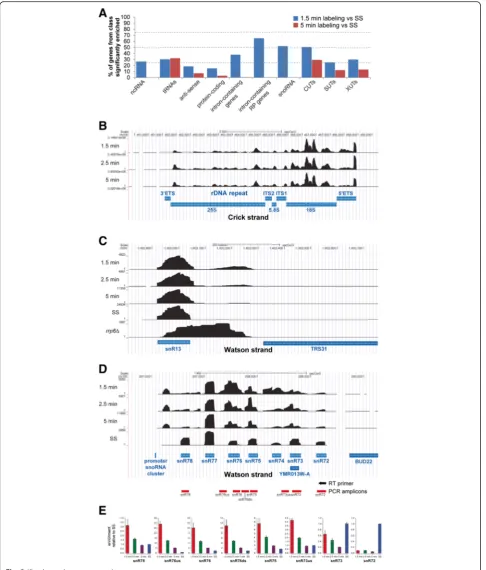
We then used DESeq2 [19] to calculate the enrich-ment of different classes of RNA in the 4tU-labeled sam-ples relative to the total RNA samsam-ples (see “Methods” for more details on the differential analyses of transcript abundance). In the 1.5-min 4tU-seq samples, a high pro-portion (37 %) of intron-containing transcripts were sig-nificantly enriched (adjusted p< 0.05; Fig. 2a), with substantially less enrichment seen in the 5-min samples. This is not surprising given that longer labeling times approach the steady state situation, where more of the labeled transcripts are spliced, such that the proportion of intron-containing transcripts is reduced. This illus-trates the benefit of labeling for extremely short times. To our knowledge, 90 s is the shortest labeling period after which RNA-seq has been performed [14, 20].
Notably, many CUTs, SUTs and XUTs were signifi-cantly enriched in the 4tU samples relative to total RNA, with the degradation of these species appearing relatively slow compared to pre-mRNA splicing (discussed below). Many non-coding RNAs (ncRNAs) are matured by cleavage and/or trimming of precursors at the 5′and/or 3′ends and the precursors were very well represented in our 4tU-seq data. Pre-ribosomal RNAs (pre-rRNAs) were readily detectable after 1.5 min of labeling, as judged by the accumulation of reads mapping to the external-transcribed and internal-external-transcribed spacer of the rDNA unit (Fig. 2b). The processing of these spacer regions seems to be slow given that they were still abundantly de-tectable after 5 min of labeling. It has been reported that incubation of human cells with concentrations of 4sU
≥50μM over long periods of time (>1 h) causes a nucle-olar stress response and inhibition of the production and processing of rRNA [21]. It is not known whether 4tU in-cubation for the very short times used here affects rRNA processing and, because rRNA was depleted from our total RNA samples before sequencing, we did not calcu-late relative pre-rRNA processing speeds.
Fig. 1RNA yield increases with labeling time.aPlot of total yield of RNA recovered in nanograms per OD600unit of cells against labeling time in minutes. During the first five minutes of labeling, yield increases linearly with labeling time (R2= 0.985). Some RNA is recovered when 4-thiouracil (4tU) is not added to the culture (0 min). This is essentially background RNA that non-specifically bound to the magnetic beads during the isolation procedure. The horizontal dashed lineindicates the level of background for this experiment. The actual amounts of RNA recovered from 600 ml culture (average of two experiments; R2= 0.960) were: 0.50
μg (0 min), 0.77μg (1 min), 1.16μg (1.5 min), 3.30μg (5 min) and 4.52μg (10 min).
[image:3.595.57.291.86.451.2]Fig. 2(See legend on next page.)
[image:4.595.57.544.87.658.2]The snR13 snoRNA is processed from a 3′ extended precursor [22] that accumulates in nuclear RNA surveil-lance mutants [23, 24]. Our 4tU-seq data suggest that most 3′extended snR13 species are processed within 5 min of 4tU labeling. Another striking example from our 4tU-seq data was the rapid processing of snoRNAs from the snR72-snR78 polycistronic transcript [25] (Fig. 2d), which we confirmed by reverse transcriptase quantitative PCR (RT-qPCR; Fig. 2e). These results clearly demonstrate the potential of very short 4tU-labeling experiments for meas-uring the processing kinetics of short-lived RNA species.
Degradation rates of cryptic transcripts correlates with transcript length and secondary structure
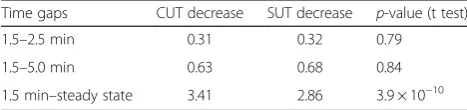
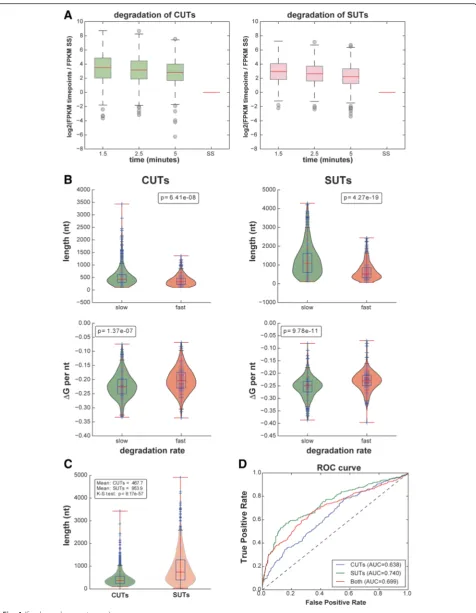
A comparison of the enrichment of the different classes of cryptic transcripts for the 1.5 and 5 min labeling times relative to the total RNA samples indicated that CUTs, SUTs and XUTs were all readily detected and decayed more slowly than intron-containing transcripts and snoRNAs (Fig. 2a, Table 1, Additional file 1: Figure S1). The heat maps in Fig. 3a, b show hierarchically clustered normalized read data for 887 CUTs and for 823 SUTs [26] at 1.5 min, 2.5 min, 5.0 min and steady state. They clearly show the slow decay of both types of transcripts. The ex-pression levels of CUTs and SUTs were generally similar at early labeling times but significantly different at steady states (p< 0.05; Fig. 3c). Interestingly, the levels of both CUTs and SUTs rose rapidly and remained approximately
constant for the first 5 min at a level that was considerably higher than the steady state (Figs 2a and 3c, Additional file 1: Figure S1). This seems incompatible with the widely adopted first order kinetic assumption [27] and suggests that processing of these RNA species involves multiple steps, inducing delays that are comparable with the sampling times used in this study.
The 4tU-seq data for three example CUTs (Fig. 3d) were compared with RT-qPCR analysis of the same three 4tU-labeled CUTs (Fig. 3e), and showed good agreement between the two methods. Thus, despite the fact that these RNA species are labeled as “unstable,” processing of many CUTs appears to be relatively slow.
We then sought to quantitatively explain the observed processing kinetics of CUTs and SUTs from sequence and structural features. As a measure of decay rate for each transcript, we considered the log ratio of the aver-age expression level at the early times (1.5, 2.5 and 5 min) over the steady state expression level (Fig. 4a). The rationale behind this choice was the following: given the strong deviation from first order kinetics at early times, we assumed that early measurements were effect-ively proportional to RNA production rate, whereas the steady state expression levels were approximately equal to the ratio of production rate to decay rate (assuming that the initial deviation from first order kinetics be-comes unimportant over long times). We observed that this decay rate was significantly negatively associated with transcript length and predicted secondary structure (Fig. 4b); in other words, long and/or highly structured transcripts were more stable. This is consistent with the model that many ncRNAs are subject to early termin-ation by the Nrd1-dependent pathway and rapid degrad-ation by the nuclear exosome [1–3, 4, 28] and/or are degraded in the cytoplasm (e.g., by Xrn1 [5]). Because SUTs are significantly longer than CUTs (Fig. 4c), our data provide a possible explanation for why SUTs are generally more stable than CUTs. We note that, in a re-gime where transcription is sporadic, transcript length could be expected to be positively associated with
(See figure on previous page.)
[image:5.595.56.290.634.689.2]Fig. 2Short labeling times proportionally enrich unstable transcripts.aDESeq2 [19] was used to identify features significantly enriched in 4tU-seq data from short labeling times (1.5 min and 5 min) compared to total RNA. The figure displays the percentage of transcripts in each category that was found to be significantly enriched (DESeq2 adjustedp< 0.05). For the DESeq analyses, all reads were considered. Thus for the intron-containing mRNAs we used reads that mapped to both introns and exons.b-dUCSC genome browser screen shots showing the change in distribution of reads at different labeling times (Y-axis), with annotation below inblue. SSindicates steady-state levels, generated by sequencing total RNA.b4tU detects pre-rRNA precursors. Note that the total RNA sample is not shown because it was rRNA depleted.c4tU-seq detects 3′extended snR13 species. Data from an rrp6Δstrain are displayed for qualitative comparison.dPolycistronic precursor from which multiple snoRNAs are processed. Blue boxes represent the annotated mature snoRNAs.eReal time (RT) quantitative polymerase chain reaction (PCR) validation of the 4tU-seq results shown in (d). For the RT reaction, a reverse transcriptase primer was used that was complementary to the 3′end of the snR72 snoRNA. This cDNA was then used to amplify the different amplicons shown below each bar plot (see the illustration in (d) for what each amplicon represents). The data were then normalized to the results obtained with rRNA-depleted total RNA (SS).5'ETS 5' external transcribed spacer, 3' ETS 3' external transcribed spacer,4tU4-thiouracil, CUTscryptic unstable transcripts,ITS internal transcribed spacer,ncRNAnon-coding RNA,RPribosomal protein,snRNAsmall nuclear RNA,snoRNA small nucleolar RNA,SUTsstable unannotated transcripts,tRNAtransfer RNA
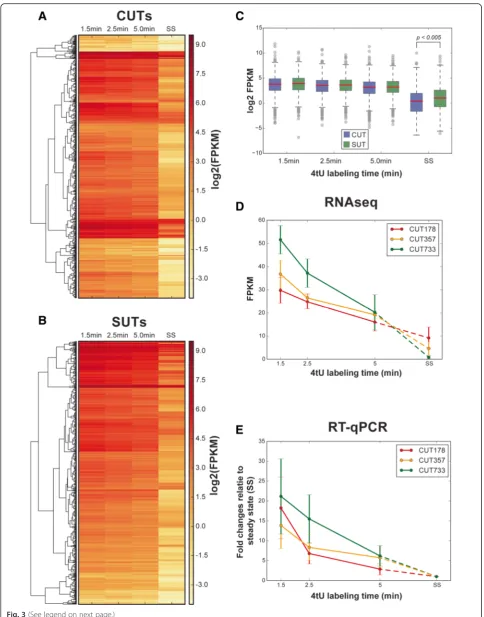
Table 1Comparison of degradation dynamics between 925 cryptic unstable transcripts (CUTs) and 847 stable unannotated transcripts (SUTs)
Time gaps CUT decrease SUT decrease p-value (t test)
1.5–2.5 min 0.31 0.32 0.79
1.5–5.0 min 0.63 0.68 0.84
1.5 min–steady state 3.41 2.86 3.9 × 10⁻¹⁰
Fig. 3(See legend on next page.)
[image:6.595.56.541.85.703.2]recovery at early time points, because longer transcrip-tion times would increase the probability of a transcript being labeled. Our analyses failed to reveal a significant effect of transcript length on the recovery of relatively short transcripts such as CUTs and SUTs at all time points (Additional file 1: Figure S3). Indeed, a bias to-ward longer transcripts at earlier labeling times would lead to a negative association of length with stability (longer transcripts would appear to have higher early ex-pression and hence higher decay rate), which is the op-posite of what we observed.
When attempting to fit a first order kinetic model to the data, the resulting degradation rates were uncorre-lated to transcript length or structural features (data not shown), further underlying the inappropriateness of the first order assumption at these extremely short labeling times. Furthermore, using predicted secondary structure and transcript length alone, we were able to train a ma-chine learning classifier to classify CUTs and SUTs with reasonable accuracy (Fig. 4d; area under receiver operat-ing characteristic curve was 0.68 for CUTs and 0.73 for SUTs, random baseline 0.5).
Very short 4tU labeling enables accurate measurements of splicing kinetics
In the case of intron-containing transcripts, the extent of RNA splicing can be determined by several alternative approaches [7], for example, from sequence reads that span intron–exon boundaries (splice sites) relative to reads that cross splice exon junctions [29], or from the number of intron reads relative to total gene reads [20]. Importantly, the transcription rate for any given gene should be constant during short periods of growth at steady state and will affect intron and exon production similarly, allowing relative splicing speeds to be deter-mined by comparing pre-mRNA and exon levels at differ-ent labeling times without the influence of transcription rate. In vivo, spliceosome assembly occurs largely co-transcriptionally [7] and, theoretically, splicing catalysis could occur on a nascent transcript as soon as the 3′ss exits the polymerase. Additionally, because the 4tU-label can be incorporated at any position in the transcript at the time when the label is added, spliced mRNAs can be la-beled even at the earliest time point. This could explain the very rapid splicing of some transcripts. Splicing also occurs in competition with pre-mRNA degradation [30,
31]; however, because degradation removes both the in-tron and the exon, this would not affect our estimates of splicing ratios.
In this work, we used a probabilistic model to estimate splicing ratios, that is, the proportion of spliced mRNA out of the total RNA for each transcript. This method was a modification of the MISO model [32] for quantification of splicing isoforms. Briefly, the method used information from all mapped reads by introducing a latent categorical variable for each read: the identity (i.e., whether it came from mature or precursor mRNA). The method then used computational statistical tools to compute a posterior probability of the identity of each read, therefore providing a quantification of mature and precursor mRNA. It is im-portant to observe that in some cases (e.g., boundary or junction reads) the identity of a read is unambiguous, and indeed many direct methods only use unambiguously assigned reads; however, it was convincingly shown [32] that using information from all reads leads to more accur-ate estimations of isoform abundance. For more details, and for a comparison of different estimation methods, see Additional file 1: Data and Methods.
A major benefit of using a probabilistic model for esti-mating the abundance of precursor and mature mRNA lies in the possibility of obtaining posterior confidence intervals (CI) on the splicing ratios, which can then be used to filter noise in a principled way. In the analysis, we only retained genes with 95 % CI < 0.3, filtering out genes for which reliable estimation was not possible (pri-marily due to low sequence coverage). This filtering im-proved the correlation between replicates from 0.757 to 0.864 (see Additional file 1: Tables S3, S4 and S7). We also used a simulation to compare quantitatively the per-formance of the probabilistic model against the two dir-ect methods that use the splice junction and intron boundary reads only, or intron reads and exon reads. The simulation showed that the probabilistic model yielded considerably lower variance results than the dir-ect methods (Additional file 1: Figure S4), and therefore likely generated better results, especially when analyzing genes with low read coverage.
In this 4tU-seq analysis, 187 intron-containing tran-scripts were selected that had a fragments per kilobase per million reads score (FPKM) of >10, that did not en-code snoRNAs in the introns, and that only contained a single intron (to simplify the data analyses). Following
(See figure on previous page.)
Fig. 4(See legend on next page.)
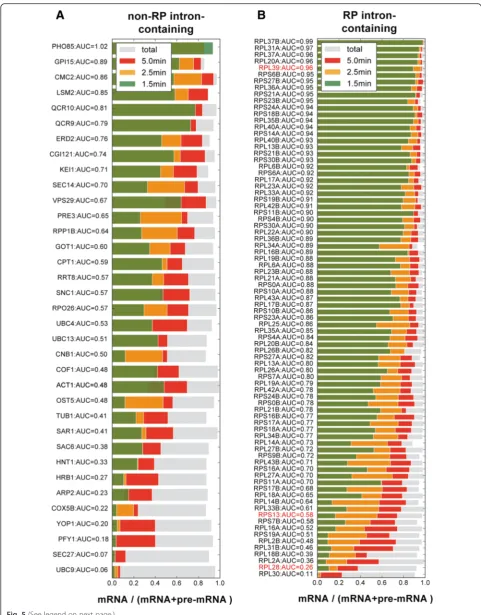
[image:8.595.60.537.85.699.2]posterior CI filtering, data for 82 ribosomal protein (RP) and 35 non-RP intron-containing genes were retained for the splicing ratio analysis (Additional file 1: Table S7). Figure 5 shows the mean splicing ratio of the three replicates at different time points for the 35 non-RP and 82 RP intron-containing genes, in which transcripts are ranked by speed of splicing from fastest (top) to slowest (bottom).
We also estimated the amount of background un-labeled (pre-)mRNA in our samples to determine to what extent this could influence our estimated splicing speeds. For these calculations we used RNA sequencing data generated from “background” or “0” samples (0 time point in Fig. 1a), which were derived from RNA that non-specifically bound to the magnetic beads dur-ing the isolation procedure (see “Methods” for details). We considered the intronic and exonic FPKM of the 250 intron-containing protein-coding genes in the back-ground and 1.5-min samples. The middle column in Additional file 1: Figure S1 shows that the intronic FPKM percentages were 7.5 % and 46.1 % in the back-ground and 1.5-min samples, respectively. Intuitively, the presence of background RNA will tilt this balance towards spliced mRNA, because unlabeled RNA is overwhelmingly exonic in the background samples (Additional file 1: Figure S1). Using these data, we estimated the back-ground proportion using the difference between the 4tU-labeled intronic RNA fraction and the actually measured fraction. Theoretically, the intronic FPKM percentage in the signal should be lower than 50 %, with this bound being attained if spliced intronic RNA decayed at the same rate as mature mRNA (clearly a worst case scenario). Using this theoretical assumption, we esti-mated the upper bound on the background mRNA levels in the 1.5-min samples to be <9.1 % (see details in
“Methods”). We conclude that this low level of mRNA background may have very slightly affected our kinetic es-timates of splicing speeds but will not have affected the rankings (Fig. 5).
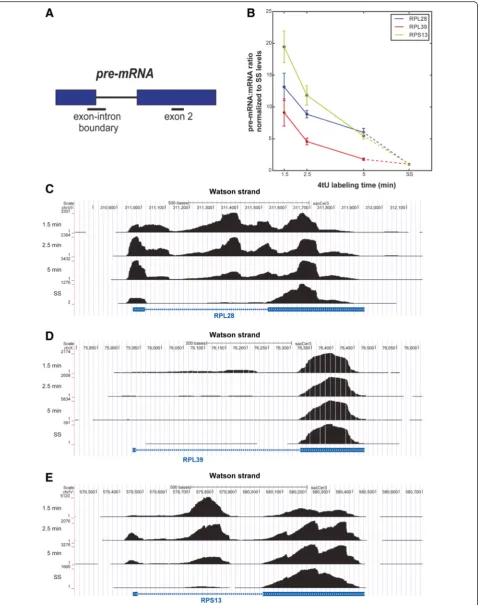
To validate some of our 4tU data, 4tU-RT-qPCR was performed on transcripts of three well-expressed riboso-mal protein genes,RPS13,RPL28andRPL39(Fig. 6a, b). The levels of the 5′ss boundary amplicons (correspond-ing to unspliced pre-mRNAs) were normalized to the
values for the corresponding exon 2 amplicon (Fig. 6a). The resulting values provided a measure of the propor-tion that corresponded to pre-mRNA. As the labeling time increases, the amount of exon 2 should remain more or less constant but the proportion of precursor should change. After 1.5 min of 4tU labeling, the pro-portion of pre-mRNA was high and decreased with la-beling time, gradually approaching the level at steady state. The time required to reach steady state was tran-script dependent, being approximately 5 min for RPL39, which was spliced relatively quickly, and longer for the others, in agreement with the rank order in Fig. 5b.
These results confirm the enhanced recovery of
unspliced pre-mRNAs by the 4tU-seq approach and its ability to detect different rates of pre-mRNA splicing for different transcripts. The results also validate the prob-abilistic model used.
One drawback of using intron read counts to measure splicing rates is that it is not always possible to distin-guish between reads originating from pre-mRNA introns or intron lariats. This could potentially lead to an under-estimation of splicing rates for some mRNA transcripts. However, based on the following results, we do not think that lariat reads significantly contributed to the splicing speeds reported here: several attempts were made to identify lariats in the 4tU-seq data using existing strat-egies [33] but only a handful of lariats could be detected. This is not surprising, because sequencing lariats tends to require use ofdbr1mutants that lack lariat debranch-ing activity and dedicated library preparation [33, 34]. Furthermore, we found a very high correlation between intronic read counts and counts for reads that overlap 5′ ss–intron boundaries (Additional file 1: Figure S5). There-fore, we conclude that our use of intron versus exon reads accurately measures splicing rates.
A/U richness and secondary structure of the intron affects ribosomal protein splicing kinetics
Our results show that different introns were spliced at different rates based on area under the curve (AUC) cal-culations (see “Methods,” and scores in Fig. 5). Various features of introns could impact their speed of splicing. These include how close to consensus are the 5′ss, 3′ss and BP sequences as well as the strength of the
(See figure on previous page.)
Fig. 5(See legend on next page.)
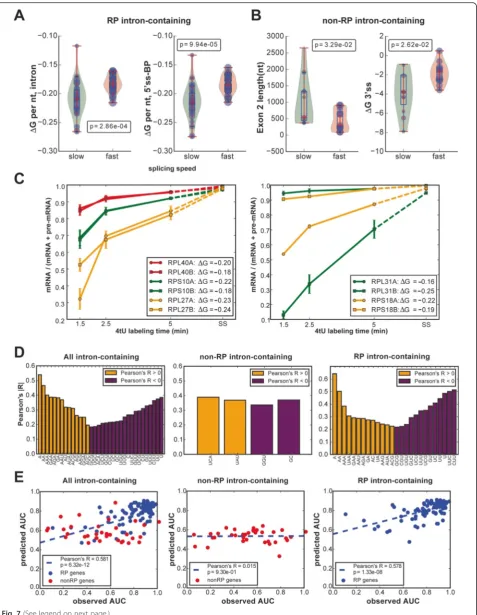
[image:10.595.56.538.85.701.2]secondary structure of the intron. We looked for corre-lations between different transcript features and the rela-tive speed of splicing. Analyzing the fastest-splicing and slowest-splicing thirds of transcripts, we noticed there was a marked difference in the behavior of intronic RP transcripts compared to that of non-RP intronic genes: for the intronic RP transcripts, a highly significant differ-ence (Wilcoxon's test p< 0.0003) was found only with regard to the normalized secondary structure scores of RP introns, with the major contribution coming from the 5′ss to BP region ( <1e04; see Fig. 7a). In the case of the non-RP transcripts, those that were spliced faster generally had less secondary structure at the 3′ss and a shorter exon 2 (Fig. 7b). All the feature comparisons are shown in Additional file 1: Figure S6 (non-RP tran-scripts) and Figure S7 (RP trantran-scripts). The failure to see a significant effect of 5′ss, 3′ss and BP sequences in RP transcripts was likely due to the high similarity of these features.
The effect of intron secondary structure should be evi-dent for paralogous RP genes that share highly related or identical exon sequences but have different intron se-quences. Indeed, we found that some paralogs, such as RPL27A/B, RPS10A/B and RPL40A/B, that have introns with similar predicted secondary structure stabilities (ΔG values), had similar splicing speeds (Fig. 7c, left panel), whereas paralogs with introns that have different predicted ΔG values, such as RPL31A/B and RPS18A/B, had different splicing speeds (Fig. 7c, right panel).
Because the predicted secondary structure within RP introns was significantly correlated with the splicing speed, we further explored the intron sequences and found that several short base combinations were signifi-cantly correlated with splicing speed (Fig. 7d). Generally, fast splicing introns were enriched for adenosines, while slower splicing introns had a higher density of uridines. Surprisingly, the proportion of “A” and “U” in the in-trons was highly negatively correlated (Pearson’s correl-ation coefficient <−0.75). Furthermore, we used the above features (all listed in Additional file 1: Tables S8 and S9) to predict the splicing speed by a random forest regression model. Figure 7e shows that the splicing speeds for RP pre-mRNAs could be well predicted by these features (Pearson’s R = 0.578 between observed and predicted splicing speed).
Overall, the most significant features we have been able to identify that distinguish intron splicing rates for
RP pre-mRNAs in budding yeast are the predicted sec-ondary structure in the region between the 5′ss and the BP, and A or U density. In our data, slower splicing was associated with greater predicted secondary structure stability and U-richness in the intron. The effect of sec-ondary structure was observed to be strongest for the set of highly expressed RP transcripts whose introns were mostly longer than average in budding yeast. The idea that secondary structure may have a role in splicing is not new [34–37], but previous work has mostly sug-gested that secondary structure in long introns in fact fa-vors efficient splicing. Structure between the 5′ss and the BP has been proposed to be necessary for efficient splicing when this distance is greater than 200 nucleo-tides [37]. Work done on RPS17B by the Rosbash la-boratory experimentally identified two complementary regions between the 5′ss and the BP that base paired to form a stem loop, thereby reducing the effective distance [38]. Mutations that disrupted this stem loop reduced the efficiency of splicing; compensatory mutations that restored the loop restored splicing efficiency. Further work by Rogic et al. [37] suggested that a specific struc-tural arrangement was not required but that a very thermodynamically stable structure could slow splicing, possibly by masking splicing signals. Taken together with the results of Rogic et al. [37], our work indicates that efficient splicing of RP pre-mRNA transcripts requires an optimal amount of secondary structure between the 5′ss and the BP, with either too much or too little being detrimental. Furthermore, our results suggest that in the endogenous context, RP transcripts that splice slower are more often victims of too much structure rather than too little. A recent paper showed that fast splicing of reporter constructs correlated with low secondary structure around the splice sites [39]. For the RP genes we did not find a significant correlation between splicing speed and folding energies of splice sites (Additional file 1: Figure S7); However, this is presumably because the splice signals for these RP genes are very similar to the consen-sus sequences. We did, however, find a correlation be-tween weak folding of the 3′ss sequence and efficient splicing for the non-RP genes analyzed here (Additional file 1: Figure S6), consistent with previous work [39].
Conclusions
4tU-seq is a powerful way of examining RNA processing kinetics and has many other potential applications. Our
(See figure on previous page.)
Fig. 6(See legend on next page.)
[image:12.595.60.539.87.693.2]analysis at very short labeling times reveals unexpected complexity in RNA processing for several different fam-ilies of RNAs. For lncRNAs, such as CUTs and SUTs, our data show that early abundances cannot be ex-plained by simple first order kinetics, and quantitatively relates degradation of CUTs and SUTs to transcript length and predicted secondary structure.
Our analysis shows that to measure splicing kinetics in S. cerevisiae it is essential to recover the RNA after ex-tremely short 4tU labeling times; many transcripts ap-proach steady state by about 2.5 min. By measuring the speed of splicing of many different newly synthesized pre-mRNAs we were able to search for factors that could explain why some splice faster than others in vivo. For the 35 non-RP intronic genes for which we had ad-equate sequence coverage, we found a significant correl-ation between the secondary structure around the 3′ss and exon 2 length. This suggests that for these tran-scripts, selection of the 3′ss might be the rate-limiting step because it requires unwinding of RNA secondary structures. Differences were found even between in-tronic RP transcripts that have similar expression levels, the same gene annotation (Gene Ontology term), and similar lengths and strength of splice sites. Moreover, transcripts of certain highly related paralogous genes displayed differences in splicing speeds. Our results sug-gest that this difference in splicing kinetics is in part due to the secondary structure of the introns as well as the nucleotide composition. Within the RP gene subgroup, introns with a less favorable predicted secondary struc-ture (less negative ΔG) spliced faster than those with more structure. One simple explanation for the observed trends is that it is more difficult for spliceosomes to as-semble on introns with a stronger secondary structure and so more time is required to overcome this impediment. Another possibility is that structural arrangements re-quired within the spliceosome to allow catalysis are costlier when there is more structure to contend with. Whether a transcript splices quickly or slowly carries over into its mRNA level at steady state, and it seems probable that regulating the secondary structure of the intron will in effect regulate the expression of the gene. Furthermore, in organisms with multi-intron genes and alternative splicing, an optimal degree of secondary structure could contribute
to determining which introns get spliced in kinetic competition. It will be interesting to use 4tU-seq to study the kinetics of splicing under different metabolic and environmental conditions and to test the effects of differ-ent splicing factors on the speed of splicing.
Methods
Yeast strains and plasmids
Theura3point mutation in W303 (MATa, ade2-1, ura3-1, his3-11, 15 trp 1-1, leu2-3, 112 can1-100) was corrected to create W303U. W303U was transformed with plasmid pAT1 (FUI1on the plasmid pRS425).
4tU-seq
Cultures were grown in Synthetic Defined –Ura –Leu medium to OD600= 0.8, at which point 4tU was added to a final concentration of 500μM. Cultures were main-tained at 30 °C and were shaken throughout the experi-ment. Large (600 ml) cultures were used for 4tU-seq experiments. After the desired labeling time the cells were snap frozen by dropping the culture into a half vol-ume of methanol in a large beaker sitting in dry ice to rapidly halt metabolism [10]. While the methanol slurry was still liquid, the frozen cells were pelleted by centrifu-gation at 3000 g for 3 min at 4 °C. RNA was isolated using a standard hot-phenol extraction. Biotinylation was performed on 2 mg of RNA as previously described [20], but only incubated for 15 min at 65 °C to reduce RNA degradation. The RNA was purified using 2 ml Zeba columns (ThermoFisher Scientific, Perth, UK), as per manufacturer's instructions, and ethanol precipi-tated. Biotinylated RNA was extracted using streptavidin C1 Dynabeads (ThermoFisher Scientific). We equili-brated 50 μl of beads in Na3PO4TMgCl2 (0.2 M NaCl,
0.1 M sodium phosphate pH 6.8, 25 mM MgCl2 and
0.4 % Tween) then blocked in Na3PO4TMgCl2and 1μg/
μl glycogen for 20 min. The biotinylated RNA was puri-fied for 30 min with the Dynabeads at 4 °C in Na3PO4TMgCl2. The beads were washed three times in Na3PO4TMgCl2and twice with TEN1000 (10 mM Tris-HCl pH 7.5, 1 mM EDTA pH8 and 1 M NaCl). All bead block, incubation and wash volumes were 400 μl. The
RNA was eluted twice with 50 μl of 0.7 M
beta-mercaptoethanol for 5 min at room temperature before
(See figure on previous page.)
Fig. 6Reverse transcription quantitative polymerase chain reaction (RT-qPCR) analysis of splicing status shows differences between transcripts.a
Diagram showing the location of diagnostic amplicons. Exons are denoted byblue boxes and the intron is represented by ablack line. Amplicons are indicated by lines below. Pre-mRNAs were detected using oligonucleotides that amplify the exon–intron boundary at the 5′splice site.b
Relative pre-mRNA levels of three transcripts,RPL28, RPL39andRPS13, analyzed by RT-qPCR, normalized relative to steady state (SS) levels. Data show how the level of each amplicon approaches the level detected at steady state as labeling time increases. Data were normalized to the levels of exon 2 and steady state to account for different RNA yields obtained at each labeling time. Different transcripts show different rates of splicing.
Fig. 7(See legend on next page.)
[image:14.595.61.539.86.702.2]being ethanol precipitated with 20μg glycogen at−20 °C for at least 2 h and re-suspended in 10μl DEPC-treated H2O. To generate the 0 min or background RNA sam-ples, we applied this protocol to cultures to which no 4tU had been added, which essentially provided an over-view of RNAs that non-specifically bound to the strepta-vidin magnetic beads during the isolation procedure.
RNA-seq libraries were produced essentially as de-scribed previously [40]. Briefly, between 100 and 250 ng of (thiolated) RNA was fragmented in SuperScript Re-verse Transcriptase buffer (ThermoFisher Scientific) for 5 min at 95 °C. Fragmented RNA was subsequently ran-domly primed as described [40]. Edinburgh Genomics (Edinburgh, UK) performed the 100-base pair
paired-end sequencing using the Illumina HiSeq 2500
platform.
Differential analysis of transcript abundance
To determine what classes of transcripts were signifi-cantly enriched between two time points (1.5 and 5 min) and in the total RNA (Fig. 2a), we used DESeq2 [19]. Three biological replicates of each time point were used for these analyses. For each comparison, DESeq2 gener-ated a list of transcript names (such as CUTs, SUTs and protein-coding genes) that were significantly over-represented in each time point. We used a p-value of 0.05 as threshold. We then counted the total number of transcripts from each class over-represented at each time point and divided that number by the total number of transcripts in each class. This showed us what fraction of each class was significantly enriched in the thiolated RNA.
Estimation of mRNA background levels in 4tU-seq data
To estimate the mRNA background levels in 4tU-seq data, we let the measured intronic FPKM percentage be
α0and α1at 0 (“background”) and 1.5 min, respectively. We let the intronic FPKM percentage be β for signal; this value was unknown but we know from theoretical
considerations that β≤0.5. We denoted the background and the signal fractions of RNA mapped to intron-containing genes at 1.5 min as m and n respectively. This gave usα0×m+β×n)/(m+n) =α1, so:
m=n¼ðβ−α1Þ=ðα1−α0Þ≤ð0:5−α1Þ=ðα1−α0Þ
Therefore, the proportion of background reads over the total was bounded by [(m/n)/(1 +m/n)]. Substituting the observed values forα0andα1, we obtained the 9.1 % upper bound as reported in the main text.
RT-qPCR
RT-qPCR was carried out as described previously [10] using oligonucleotides listed in Additional file 1: Table S5.
Processing of raw sequencing data
Sequencing was performed on a HiSeq 2500 by Edinburgh Genomics. Raw fastq files were demultiplexed using pyBarcodeFilter version 2.3.3 from the pyCRAC tool suite, version 1.2.2.4 [41]. Quality trimming and removal of 3′
adapter sequences (5′- AGATCGGAAGAGCACACG-3′)
was performed using Flexbar, version 2.4 [42]. RNA-seq reads were aligned to the yeast genome by STAR [43]. Counts for annotated genomic features were generated using pyCRAC [41], in-house python scripts and genomic feature files (GTF) from ENSEMBL, version R64-1-1.75. Coordinates for CUTs and SUTs were obtained from Xu et al. [26]. The python scripts used for this study are available upon request.
Quantification of splicing ratio and splicing speed
The splicing ratio, that is, the mRNA proportion, was then calculated from the aligned reads either by direct methods or using a probabilistic method (see Additional file 1: Data and Methods); the code for the probabilistic method is available at https://github.com/huangyh09/ diceseq. To combine the measurements of pre-mRNA and mRNA abundance at 1.5, 2.5 and 5 min into a single
(See figure on previous page.)
[image:15.595.61.541.87.102.2]measure of splicing speed, we considered the AUC as follows:
AUC¼ðR2:5þR1:5Þ=2þ2:5ðR5:0þR2:5Þ=2
3:5RSS ð
1Þ
where Ri is the splicing ratio, that is, mRNA/(mRNA +
pre-mRNA), at time point i (in minutes), estimated as the average of the posterior mean for the three repli-cates. RSS represents the merged splicing ratio at the
steady state. Therefore, the larger the AUC, the more efficient the splicing process.
Intron-containing RP gene annotation and features
The lengths and sequences of various features were obtained from SGD (http://www.yeastgenome.org/). BP locations were obtained from the Yeast Intron Database [44]. The scores assigned to the 5′ss, 3′ss and BS were obtained using the method described by Crooks et al. [45]. The free-energy of the predicted secondary struc-ture was calculated using quickfold (http://mfold.rna. albany.edu/?q=DINAMelt/Quickfold). This value was then divided by the number of bases in the intron (or part of the intron) to give the secondary structure per base (a ΔG value and therefore negative). The more negative the ΔG value, the more structured the intron is predicted to be.
Data access
Raw (fastq) and processed sequencing data can be down-loaded from the NCBI Gene Expression Omnibus repository [GEO: GSE70378]. All raw read count and feature data can be found in Additional file 1: Tables S6 to S14.
Ethical approval
No ethical approval was required for this study.
Additional file
Additional file 1:Tables S1–S14; figures S1–S7; and Supplementary Methods and References.(ZIP 6028 kb)
Abbreviations
3′ss: three prime splice site in intron; 4tU-seq: 4-thiouracil labeling and sequencing; 5′ss: five prime splice site in intron; BP: branch point sequence; CI: confidence interval; CUT: cryptic unstable transcript; ETS: external transcribed spacer ; FPKM: fragments per kilobase per million reads ; ITS: internal transcribed spacer ; lncRNA: long non-coding RNA; mRNA: messenger RNA; miRNA: microRNA; ncRNA: coding RNA; non-RP: non-ribosomal protein; RNA-seq: RNA sequencing; non-RP: ribosomal protein; siRNA: small interfering RNA; snRNA: small nuclear RNA; snoRNA: small nucelolar RNA; SS: steady state; SUT: stable unannotated transcripts; tRNA: transfer RNA; XUT: Xrn1-dependent unstable transcript.
Competing interests
The authors declare that they have no competing interests.
Authors’contributions
All authors contributed to planning the experiments and computational procedures. JR, DB, RH and SG carried out the experiments. YH, GS and SG performed the bioinformatics and computational analyses of the sequencing data. All authors contributed to writing the manuscript and approved the final manuscript.
Acknowledgements
This work was supported by grants from the Wellcome Trust to JR (093853), JB (087551), and SG (091549), and the Wellcome Trust Centre for Cell Biology core grant (092076). GS acknowledges support from the European Research Council under grant MLCS306999. YH is supported by the University of Edinburgh Principal Career Development scholarship. JB is the Royal Society Darwin Trust Research Professor. Next-generation sequencing was carried out by Edinburgh Genomics, The University of Edinburgh, Edinburgh, UK. Edinburgh Genomics is partly supported through core grants from NERC (R8/H10/56), MRC (MR/K001744/1) and BBSRC (BB/J004243/1).
Author details 1
Wellcome Trust Centre for Cell Biology, University of Edinburgh, Edinburgh EH9 3BF, UK.2School of Informatics, University of Edinburgh, Edinburgh EH8 9AB, UK.3Centre for Synthetic and Systems Biology (SynthSys), University of Edinburgh, Edinburgh EH9 3BF, UK.4Present Address: Institute of
Neuroscience and Psychology, University of Glasgow, Glasgow G12 8QB, UK.
Received: 4 October 2015 Accepted: 30 November 2015
References
1. Jensen TH, Jacquier A, Libri D. Dealing with pervasive transcription. Mol Cell. 2013;52:473–84.
2. Tuck AC, Tollervey D. RNA in pieces. Trends Genet. 2011;27:422–32. 3. Yamashita A, Shichino Y, Yamamoto M. The long non-coding RNA world in
yeasts. Biochim Biophys Acta. 2015. doi:10.1016/j.bbagrm.2015.08.003. 4. Tudek A, Candelli T, Libri D. Non-coding transcription by RNA polymerase II
in yeast: Hasard or nécessité? Biochimie. 2015;117:28–36.
5. van Dijk EL, Chen CL, d'Aubenton-Carafa Y, Gourvennec S, Kwapisz M, Roche V, et al. XUTs are a class of Xrn1-sensitive antisense regulatory non-coding RNA in yeast. Nature. 2011;475:114–7.
6. Will CL, Lührmann R. Spliceosome structure and function. Cold Spring Harb Perspect Biol. 2011;3. doi:10.1101/cshperspect.a003707.
7. Herzel L, Neugebauer KM. Quantification of co-transcriptional splicing from RNA-seq data. Methods. 2015;85:36–43.
8. Singh J, Padgett RA. Rates of in situ transcription and splicing in large human genes. Nat Struct Mol Biol. 2009;16:1128–33.
9. Huranová M, Ivani I, Benda A, Poser I, Brody Y, Hof M, et al. The differential interaction of snRNPs with pre-mRNA reveals splicing kinetics in living cells. J Cell Biol. 2010;191:75–86.
10. Alexander RD, Barrass D, Dichtl B, Kos M, Obtulowicz T, Robert M-C, et al. RiboSys, a high-resolution, quantitative approach to measure the in vivo kinetics of pre-mRNA splicing and 3'-end processing inSaccharomyces cerevisiae. RNA. 2010;16:2570–80.
11. Gray JM, Harmin DA, Boswell SA, Cloonan N, Mullen TE, Ling JJ, et al. SnapShot-Seq: a method for extracting genome-wide, in vivo mRNA dynamics from a single total RNA sample. PLoS One. 2014;9:e89673. 12. Dölken L, Ruzsics Z, Rädle B, Friedel CC, Zimmer R, Mages J, et al.
High-resolution gene expression profiling for simultaneous kinetic parameter analysis of RNA synthesis and decay. RNA. 2008;14:1959–72. 13. Miller C, Schwalb B, Maier K, Schulz D, Dümcke S, Zacher B, et al. Dynamic
transcriptome analysis measures rates of mRNA synthesis and decay in yeast. Mol Syst Biol. 2011;7:458.
14. Neymotin B, Athanasiadou R, Gresham D. Determination of in vivo RNA kinetics using RATE-seq. RNA. 2014;20:1645–52.
15. Schulz D, Schwalb B, Kiesel A, Baejen C, Torkler P, Gagneur J, et al. Transcriptome surveillance by selective termination of noncoding RNA synthesis. Cell. 2013;155:1075–87.
16. Cleary MD, Meiering CD, Jan E, Guymon R, Boothroyd JC. Biosynthetic labeling of RNA with uracil phosphoribosyltransferase allows cell-specific microarray analysis of mRNA synthesis and decay. Nat Biotechnol. 2005;23:232–7.
YBL042 ofSaccharomyces cerevisiaeencodes a uridine permease. FEMS Microbiol Lett. 1998;159:69–75.
18. Blondel M-O, Blondel MO, Morvan J, Dupré S, Urban-Grimal D, Haguenauer-Tsapis R, et al. Direct sorting of the yeast uracil permease to the endosomal system is controlled by uracil binding and Rsp5p-dependent ubiquitylation. Mol Biol Cell. 2003;15:883–95.
19. Love MI, Huber W, Anders S. Moderated estimation of fold change and dispersion for RNA-seq data with DESeq2. Genome Biol. 2014;15:550. 20. Windhager L, Bonfert T, Burger K, Ruzsics Z, Krebs S, Kaufmann S, et al.
Ultrashort and progressive 4sU-tagging reveals key characteristics of RNA processing at nucleotide resolution. Genome Res. 2012;22:2031–42. 21. Burger K, Mühl B, Kellner M, Rohrmoser M, Gruber-Eber A, Windhager L, et al.
4-thiouridine inhibits rRNA synthesis and causes a nucleolar stress response. RNA Biol. 2013;10:1623–30.
22. Rasmussen TP, Culbertson MR. The putative nucleic acid helicase Sen1p is required for formation and stability of termini and for maximal rates of synthesis and levels of accumulation of small nucleolar RNAs in Saccharomyces cerevisiae. Mol Cell Biol. 1998;18:6885–96.
23. Steinmetz EJ, Conrad NK, Brow DA, Corden JL. RNA-binding protein Nrd1 directs poly(A)-independent 3'-end formation of RNA polymerase II transcripts. Nature. 2001;413:327–31.
24. Kim M, Vasiljeva L, Rando OJ, Zhelkovsky A, Moore C, Buratowski S. Distinct pathways for snoRNA and mRNA termination. Mol Cell. 2006;24:723–34. 25. Qu LH, Henras A, Lu YJ, Zhou H, Zhou WX, Zhu YQ, et al. Seven novel
methylation guide small nucleolar RNAs are processed from a common polycistronic transcript by Rat1p and RNase III in yeast. Mol Cell Biol. 1999;19:1144–58.
26. Xu Z, Wei W, Gagneur J, Perocchi F, Clauder-Münster S, Camblong J, et al. Bidirectional promoters generate pervasive transcription in yeast. Nature. 2009;457:1033–7.
27. Eser P, Wachutka L, Maier KC, Demel C, Boroni M, Iyer S, et al. Determinants of RNA metabolism in the Schizosaccharomyces pombe genome. bioRxiv. 2015; 025585. http://biorxiv.org/content/biorxiv/early/2015/08/26/025585.full.pdf. 28. Colin J, Libri D, Porrua O. Cryptic transcription and early termination in the
control of gene expression. Genet Res Int. 2011;2011:653494.
29. Tilgner H, Knowles DG, Johnson R, Davis CA, Chakrabortty S, Djebali S, et al. Deep sequencing of subcellular RNA fractions shows splicing to be predominantly co-transcriptional in the human genome but inefficient for lncRNAs. Genome Res. 2012;22:1616–25.
30. Gudipati RK, Xu Z, Lebreton A, Séraphin B, Steinmetz LM, Jacquier A, et al. Extensive degradation of RNA precursors by the exosome in wild-type cells. Mol Cell. 2012;48:409–21.
31. Bousquet-Antonelli C, Presutti C, Tollervey D. Identification of a regulated pathway for nuclear pre-mRNA turnover. Cell. 2000;102:765–75. 32. Katz Y, Wang ET, Airoldi EM, Burge CB. Analysis and design of RNA
sequencing experiments for identifying isoform regulation. Nat Methods. 2010;7:1009–15.
33. Bitton DA, Rallis C, Jeffares DC, Smith GC, Chen YYC, Codlin S, et al. LaSSO, a strategy for genome-wide mapping of intronic lariats and branch points using RNA-seq. Genome Res. 2014;24:1169–79.
34. Awan AR, Manfredo A, Pleiss JA. Lariat sequencing in a unicellular yeast identifies regulated alternative splicing of exons that are evolutionarily conserved with humans. Proc Natl Acad Sci U S A. 2013;110:12762–7. 35. Meyer M, Plass M, Pérez-Valle J, Eyras E, Vilardell J. Deciphering 3'ss selection
in the yeast genome reveals an RNA thermosensor that mediates alternative splicing. Mol Cell. 2011;43:1033–9.
36. Parker R, Patterson B. 9 - Architecture of fungal introns: implications for spliceosome assembly. In: Dudock MIS, editor. Molecular biology of RNA. San Diego, CA: Academic Press, Inc.; 1987. p. 133–149. [Molecular Biology of RNA]. 37. Rogic S, Montpetit B, Hoos HH, Mackworth AK, Ouellette BF, Hieter P.
Correlation between the secondary structure of pre-mRNA introns and the efficiency of splicing inSaccharomyces cerevisiae. BMC Genomics. 2008;9:355.
38. Goguel V, Rosbash M. Splice site choice and splicing efficiency are positively influenced by pre-mRNA intramolecular base pairing in yeast. Cell. 1993;72:893–901.
39. Zafrir Z, Tuller T. Nucleotide sequence composition adjacent to intronic splice sites improves splicing efficiency via its effect on pre-mRNA local folding in fungi. RNA. 2015;21:1704–18.
Snapshots of pre-rRNA structural flexibility reveal eukaryotic 40S assembly dynamics at nucleotide resolution. Nucleic Acids Res. 2014;42:12138–54. 41. Webb S, Hector RD, Kudla G, Granneman S. PAR-CLIP data indicate that Nrd1-Nab3-dependent transcription termination regulates expression of hundreds of protein coding genes in yeast. Genome Biol. 2014;15:R8. 42. Dodt M, Roehr JT, Ahmed R, Dieterich C. FLEXBAR-flexible barcode and
adapter processing for next-generation sequencing platforms. Biology (Basel). 2012;1:895–905.
43. Dobin A, Davis CA, Schlesinger F, Drenkow J, Zaleski C, Jha S, et al. STAR: ultrafast universal RNA-seq aligner. Bioinformatics. 2013;29(1):15–21. 44. Spingola M, Grate L, Haussler D, Ares M. Genome-wide bioinformatic
and molecular analysis of introns inSaccharomyces cerevisiae. RNA. 1999;5:221–34.
45. Crooks GE, Hon G, Chandonia J-M, Brenner SE. WebLogo: a sequence logo generator. Genome Res. 2004;14:1188–90.
• We accept pre-submission inquiries
• Our selector tool helps you to find the most relevant journal
• We provide round the clock customer support
• Convenient online submission
• Thorough peer review
• Inclusion in PubMed and all major indexing services
• Maximum visibility for your research
Submit your manuscript at www.biomedcentral.com/submit