5
IX
September 2017
Detection and Classification of Bone Fractures
Using GLCM Features
A.V. Manjari1, G.S.N.S. Ajay Kamal2, U.N. Subhadra Devi3, Dr. M. Satyanarayana4
1,2
Student,3Assistant Professor,4Associate Professor, Department of Electronics and Communication Engineering, MVGR College of Engineering, Vizianagaram-535002
Abstract: Bone fracture is one of the major problem for human beings that occurs due to accidents or by stress. This effects Disability-Adjusted Life Year (DALY) which effects the reduction in man power. The diagnosis of bone fracture is crucial in medical filed. The bone fractures images are obtained from X-ray/CT scan. Images of bone fractures are obtained from hospital and these images are processed in the areas noise removal, segmentation, edge detection and feature extraction. The images are then classified as Fractured bone or nonfractured bone by using Region of Interest (ROI) classification.
Keywords: Bone Fractures, Noise removal, Segmentation, Feature extraction, Classification.
I. INTRODUCTION
Fracture is a discontinuity in the bony matrix, which may be due to any external force on the bone or due to stress. The external force must be stronger than the tensile strength of the bone. Fractures commonly happen because of road accidents, sports injuries. Fractures may be open or closed and stress fracture. Open fractures include break through skin and soft tissues also, which is very severe and increases chances of infection. Stress fractures are caused by application of abnormal stress on a normal bone. Depending on the patterns there may be linear, transverse, oblique, spiral, impacted, avulsion fractures. Fractures can be diagnosed by imaging techniques like X-ray, CT scan and the treatment includes closed manipulation or open manipulation and internal fixation with wires, screws.
II. RELATEDWORK
SP. Chokkalingam and K. Komathy [1] implemented a method to detect rheumatoid arthritis by image processing techniques. The system can be improved by advanced edge detection technique and better segmentation technique. The Gray Level Co-Occurrence Matrix (GLCM) features are Mean, Median, Energy, Correlation, Bone Mineral Density (BMD) etc. Neural network classifier is used to classify the images. Edward V, Cephas Paul. at al. [2] introduced automated techniques to detect the fractures in bones. To improve the quality of the images pre-processing techniques are applied to remove the noise and used better segmentation and edge detection algorithm for improving efficiency. Snehal Deshmukh at al. [3] conclude that Canny Edge detection can be used in detecting fractured bones. As per the result it was concluded that the accuracy in detection depends on quality of the image. R. Aishwarya et al. [4] proposed a method to detect the edges of disfigured images. The technique for edge detection locates the edges and detects the fractures. Methods such as Active contour model, Geodesic Active contour model is also analyzed in this paper. In this project, classification of X-ray images is done with good accuracy without concentrating on the type of fracture.
III.PROPOSEDMETHOD
The X-ray images that are acquired consists of both fractured and nonfractured images. On these images, first pre-processing techniques such as enhancing the images using filtering techniques such as Lucy Richardson filter, blind deconvolution filter and median filter to remove gaussian noise and salt and pepper noise. In the second step edge detection is performed using Canny Edge detection algorithm. Next, the segmentation is performed on the image by k-means clustering algorithm. Finally, the feature extraction is done for the image using GLCM feature extraction algorithm and classified using Region of Interest (ROI) algorithm. The flow diagram is shown below in Fig 1.
IV.NOISEREMOVAL
Noise is defined as the unwanted pixel that impacts the image quality. It is represented mathematically as
f (x, y) = g (x, y) + η (x, y)
Fig. 1. Flow process of proposed method
A. Gaussian Noise
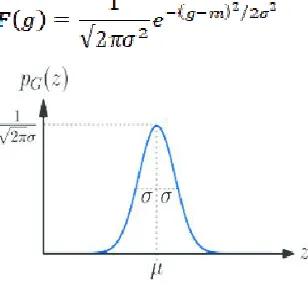
[image:3.612.237.391.379.531.2]Gaussian noise is most commonly called as Additive White Gaussian Noise (AWGN). It is having a probability density function (PDF) which is equal to normal distribution shown in Fig 2. The PDF of Gaussian random variable is given by:
Fig. 2. PDF of Gaussian noise
The main causes of this noise in image are poor illumination, high temperature and noise added in channel.
B. Salt and Pepper Noise
It is also called as Impulse noise. Salt and pepper noise images will have dark pixels in bright region and bright pixels in dark region. Impulse noise occurs due to analog to digital converters and in transmission through channel. The PDF is shown in Fig 3.
[image:3.612.227.382.621.722.2]C. Lucy Richardson filter
The Lucy Richardson algorithm is an iterative method and it arises from maximum likelihood in which image is modelled with Poisson noise. The Lucy Richardson algorithm gives stable solution quickly with a small point spread function (PSF) matrix. It produces reconstructed images of high quality even in presence of high noise levels.
D. Blind Deconvolution Filter
Blind convolution is the method of recovery of signal and degradation of kernel from their noisy convolution. It can be used in application of audio processing, image processing, astronomical imaging, medical imaging and for removing of motion blur of images captured by mobile phones. This algorithm is used when the information of noise and blur present in image is not known. Its process is similar to the accelerated, damped Lucy-Richardson algorithms in which the image and PSF are simultaneously. The kernel is given by
Where
H is blurring function
Suu is spectral density of image Snn is spectral density of Noise
E. Median Filter
It is an order statistic filter in which the center pixel value is replaced by the median of the intensity levels of the neighborhood of that pixel. Images with very less blur can be obtained with median filter and also give excellent noise reduction. Median filter is especially used to remove salt and pepper noise in an image.
V. CANNYEDGEDETECTIONALGORITHMSEGMENTATIONSEGMENTATION
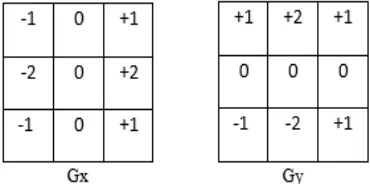
[image:4.612.215.400.472.564.2]Canny operator is an optimal edge detector to which input is grayscale image and the output is image showing the tracked intensity discontinuities. It is a multistage process where in first step the image is smoothened by Gaussian smoothing which can be performed by standard convolution method and in next stage is to find the edge strength by taking the gradient of image. Gradient of image can be found by Sobel operator which performs a 2-D spatial gradient on the image. Then the approximate gradient magnitude at each point can be found which uses two 3*3 convolution masks. Those two 3*3 convolution masks are used to find the gradient in x direction and gradient in y direction. The convolution mask of canny operator is shown in Fig 4.
Fig. 4 The Convolution Mask of Canny operator The magnitude of gradient is approximated using the formula:
VI.SEGMENTATION
Segmentation means segmenting the image into different segments that which can be used further applications like medical diagnosis, Image analysis and robotics. Segmentation means partitioning an image into many segments to change the representation of image to give more details about the image and also for making analysis easier. Segmentation is often called as Clustering.
A. K-means clustering
every object is now assigned with group that has same centroid (approximately). Once the all the objects are assigned with groups, recalculate the positions of ‘K’ centroids. Repeat the procedure until the centroids become stationary. This process of separation of objects into groups can be used to find the metric to be minimized.
VII. FEATUREEXTRACTION
Feature extraction is an informative and non-redundant set of derived values from the measured initial data which will facilitate the subsequent steps and in some cases, leads to better results than compared to human interpretations.
A. Gray Level Co-Occurrence Matrix
Haralick introduced Gray Level Co-Occurrence matrix in the year 1973 which are the popular statistical features of second order. He proposed 2 step texture extraction process which included computation of co-occurrence matrix and calculation of texture features from the co-occurrence matrix. The second order texture in GLCM is relation between two neighboring pixels in one offset. In the transformation, the neighboring pixels in one of some of the eight directions can be used which can be kernels of 3*3 5*5 etc. The commonly used directions are 0, 45, 90, 135 and its reverse directions can also be used. Each element (i, j) specifies the number of times the pixel with value ‘i’ has occurred adjacent to pixel with value ‘j’. After GLCM is calculated, important texture features like energy, contrast, homogeneity and correlation are found.
1.nergy (E): It is the measure of pixel pair repetitions extent which gives the uniformity of image. Energy is given by the formula:
Contrast (Con): It is the measure of intensity of a pixel and its neighbor in an image. It is given by the formula:
Homogeneity (Hom): It is the measure of image homogeneity as the larger values are assumed in place of smaller gray tone differences in pair elements. It is more sensitive to diagonal elements in GLCM. It has the maximum value when the elements in the image have same values. Homogeneity is given by the formula
Correlation (Cor): The gray tone linear dependence in an image can be measured using correlation. Correlation is given by the formula:
VIII. CLASSIFICATION
Region of Interest is selected subset with in a data set identified for a particular purpose which is commonly used in many application areas like medical imaging where the boundaries of tumor may be defined for measuring its size or volume etc.
A. The algorithm of ROI classification will be as follows
IX.RESULTS
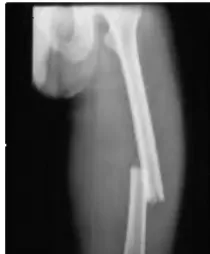
[image:6.612.65.507.58.736.2] [image:6.612.70.475.75.384.2] [image:6.612.383.488.251.378.2]Fig. 5. Original Image Fig. 6. Blurred Image Fig. 7. Deblurred Image using Lucy Richardson filter
Fig. 8. Deblurred Image using Fig. 9. Salt and Pepper Image Fig. 10. Image after Filtering Blind Deconvolution filter
Fig. 11. Canny Edge Detected Image
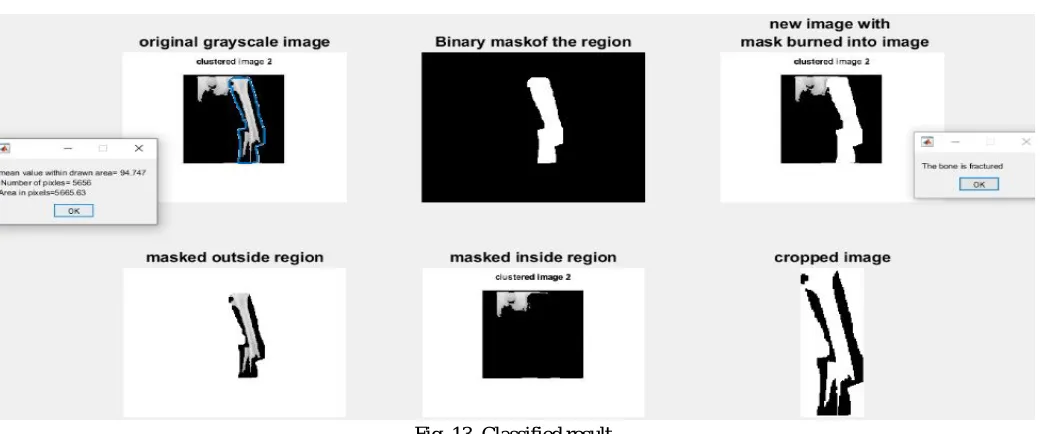
[image:6.612.133.477.375.701.2]Fig. 13. Classified result
X. CONCLUSIONS
In this work analysis and classification of bone X-Ray images is presented based on GLCM features of the image. At first the pre-processing is done to remove the noise using various filters and deconvolution methods. Among those noise is removed efficiently using blind deconvolution method as no information about noise is known initially and edges are detected by using canny edge detector efficiently as it can detect multiple edges. The method has been tested on a set of images and results have been evaluated based on GLCM features and using region of interest based classification bones are identified as fractured and non-fractured bone images with an accuracy of 94%. For more accuracy, the same technique can be implemented using NI vision assistance tool box.
REFERENCES
[1] Chokkalingam, SP. and Komathy, K. (2014). ―Intelligent Assistive Methods for Diagnosis of Rheumatoid Arthritis Using Histogram Smoothing and Feature Extraction of Bone Images. World Academy of Science, Engineering and Technology International Journal of Computer Information Systems and Control Engineering, Vol. 8, Issue .5, pp.834-843.
[2] Edward V, Cephas Paul. and Hepzibah S, Hilda. (2015), ―A Robust Approach for Detection of the type of Fracture from X-Ray Images‖, International Journal
of Advanced Research in Computer and Communication Engineering, Vol. 4, Issue No. 3, pp.479-482.
[3] Deshmukh, Snehal., Zalte, Shivani., Vaidya, Shantanu. And Tangade, Parag. (2015), ―Bone Fracture Detection Using Image Processing In MATLAB,
International Journal of Advent Research in Computer and Electronics (IJARCE), pp. 15-19.
[4] Aishwariya, R., Geetha, M. Kalaiselvi. and Archana, M. ―Computer- Aided Fracture Detection of X-Ray Images, IOSR Journal of Computer Engineering, pp.44-51.
[5] Harish Kumar J.R., Chaturverdi A., “Edge Detection of Femur Bone - A Comparative Study”, MIT, Manipal, NITK, Surathkal, Karnataka, India, 2010. [6] Abdolvahab Ehsanirad and Sharatkumar Y. H.” Leaf recognition for plant classification using GLCM and PCA methods”, Oriental Journal of Computer
Science & Technology, Vol. 3(1), 31-36 (2010).