5
VIII
August 2017
Seed Point Localization using Quad Tree
Decomposition and Active Contour
Taruna Goyal1 , Beant kaur2
1M.tech, Department of ECE, Punjabi University, Patiala, India 2Assistant professor, Department of ECE, Punjabi University, Patiala, India
Abstract: Based on Quad tree decomposition, the seed point is localized inside the tumor in which it can be found near the boundaries of the tumor and can be spread outside the tumor. To improve this limitation, this paper tries to provide an automatic method for finding the seed region at the centroid of the tumor. Two criteria consolidated iterative quad tree decomposition (QTD) and Active contour of the sore are thus intended to localize the seed point. One method is to choose the region where the seed point is found and the other is to limit it at the centroid. Moreover, This paper made it possible on 50 breast tumor ultrasonic images. If the seed point is located at the centroid of the tumor, it shows the proposed method is to be correct, else the method is a failure. As the experiment results show, this method in this paper can automatically find the seed point at the centroid of the tumor with an accuracy rate of 99%.
Keywords: Seed region growing. Iterative quad tree. Ultrasonic breast tumor. Active Contour
I. INTRODUCTION
II. IMAGE PREPROCESSING A. Speckle Reduction
The difficulties in ultrasound images such as attenuation, speckle, shadow and signal dropout are a major limitation on image quality in ultrasound imaging. Due to the intricacy of speckle measurements, the conventional filtering methods such as median filter, Gauss filter and so on, could not prevail to balance between speckle concealment and feature preservation. We use the anisotropic diffusion method to not only evacuation the noise but also reserve or even enhance the image edge information. In this study, the iteration times is set as 30 in the anisotropic diffusion method.
B. Histogram Equalization
Histogram equalization is a significant application of gray level transformation used in image enhancement processing. [5]
It actually tries to transform the histogram of the original image into homogeneous distribution. [6] [7] [8] It enhances the contrast of the overall by enhancing the range of the pixel gray value.
Taking a 2-D image P(i. j) with discrete gray levels of [ , , …….. ], the occurrence probability of a pixel level Pt will be
(P )
t, 0
t
L 1
t
x
E
X
Where, is the number of pixels in gray level and X refers to the total number of pixels in the image. The cumulative density function is defined as:
0
(t)
(P ), 0
1
t n n
CDF
E
t
L
In other words, the histogram equalization is a design that maps the input image into the entire dynamic range [P0, PL-1].
C. Automatic Seed Selection Algorithm
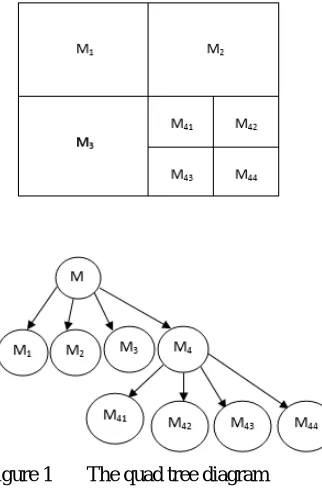
Quad tree is a tree data structure in which every node either ends up on a leaf having interesting spatial information, or subdivided itself into further four level Quad trees. [9] Quad trees are mostly used to divide a 2-D space by partitioning it into four quadrants. QTD is a data structuring technique used for storing 2D data with efficiency. [10].There are two ways of QTD: one is bottom-up and another is top-down. [11] We are employing top-down in this paper. The core idea of top-down Quad tree is to decompose internal node into further 4 children according to the decided threshold. If the change in highest and lowest pixel values in every sub-block is smaller or equal to the decided threshold value, the sub block need not to be further decomposed. If the difference is coming out to be greater than the threshold value, then the sub block will be decomposed into four sub blocks as shown in Figure 1 [12]
The next step after two preprocess phases i.e. speckle reduction and histogram equalization is to convert the gray level to double precision and after that normalize it so that it can become the floating point numbers from 0 to 1.
Pre-decomposition, ultrasound images of breast are changed into the size of 512×512. Further, the images can be divided into sub blocks in nine different sizes of 256×256,128×128,64×64,32×32,16×16,8×8,4×4,2×2 and 1×1 respectively. Post decomposition Before the QTD, breast ultrasound images are converted into the size of 512 × 512. Accordingly, the images can be decomposed into sub-blocks in 9 sizes of 256 × 256, 128 × 128, 64 × 64, 32 × 32, 16 × 16, 8 × 8, 4 × 4, 2 × 2 and 1 × 1 respectively. Post each QTD, the smallest sub-block in the image will appear in the region with the most dramatic gray value variation. The more homogeneous the range is, the larger the span of the sub-square will be. The tumor has larger homogenous echoic appearance when contrasted to other structural areas of the image. Therefore, sub-blocks with larger sizes frequently emerge in the inner regions of the tumor or the muscle regions at the base of the image where the gray values change smoothly. On the other hand, sub-squares with smaller sizes oftentime show up in the locale along the tumor margin which associates with image edges and near the highest point of the image. Hence, the seed point can be chosen approximately among the sub-squares of larger sizes. Keeping in mind to check whether the seed is situated in the internal locales of the tumor, the image is decomposed again by controlling the threshold into a smaller one. The algorithm can be portrayed as follows:
2) Disintegrate the breast ultrasound image by using the diverse thresholds in sequence. for n = 1 to n max. In the nth decomposition, since the dark esteems close to the edge of the image are also little, which is even close to the gray values in tumor, the related sub-squares associated with the edge of the image are disposed of. In this manner, the largest size of sub-blocks among the rest of the sub-squares can be found.
Figure 1 The quad tree diagram
The sum of gray values (SGV) S of these sub-blocks in the largest size is computed by
1, 1
(i, j)
n i jS
P
(3)Where, n denotes the extent of the sub-squares, while P (i, j) means the gray value of the (i, j) pixel in the sub-block. The largest size of sub-block with the minimum SGV is taken as the nth target area. In the (n + 1)th decomposition, the sub-blocks which are associated with the edges of the image will be discarded to get the sub-blocks of the most extreme size. After examining the Equation (3), the sub-block of the maximum size with the little estimation of S will be taken as the (n + 1)th target region. The (n + 1)th target locale is taken as the seed point; if the (n + 1)th target is found region inside the nth target region otherwise return
3) Arrange all the gray values inside the seed region according to their size and locate the seed point by finding out the coordinates of the minimum gray value.
D. Active Contour
It fragments the 2-D grayscale image into closer view (object) and foundation regions utilizing active contour based division. The output image bw is a binary image where the closer view is white (logical true) and the foundation is black (logical false) [13].
IV. PROPOSED METHOD:
V. EXPERIMENTAL RESULTS AND ANALYSIS:
[image:5.612.234.377.348.454.2]Figure 2: Original Image
Figure 3: Image after speckle reduction
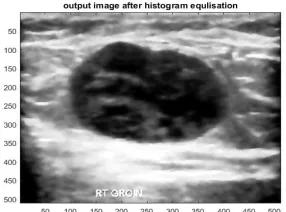
[image:5.612.236.374.492.569.2]Figure 4: Output after histogram equalization
Figure 5: Image normalization
[image:5.612.237.373.603.705.2]Figure 7: Results after the implementation of active contour
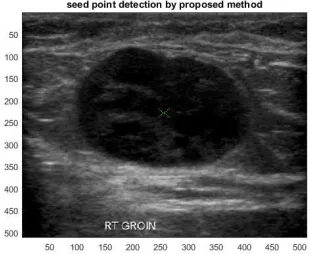
Figure 8: Results after the proposed method
A Performance
Tp 49
Fp 0
TN 49
FN 1
Performance index Percentage(%)
Sensitivity 98
Specificity 99
Accuracy 100
[image:6.612.193.414.422.701.2]
B Result Analysis
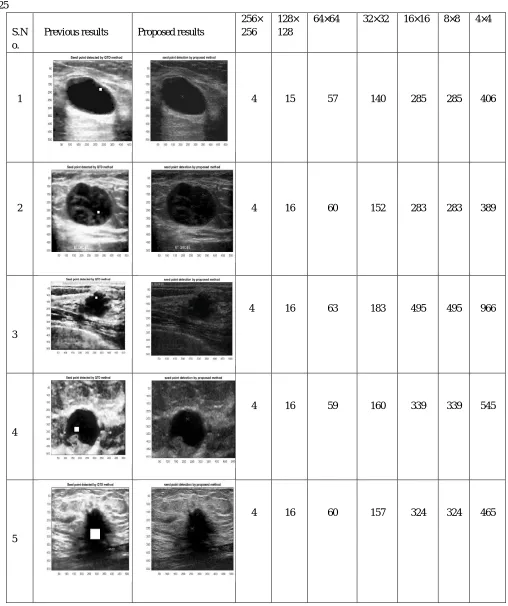
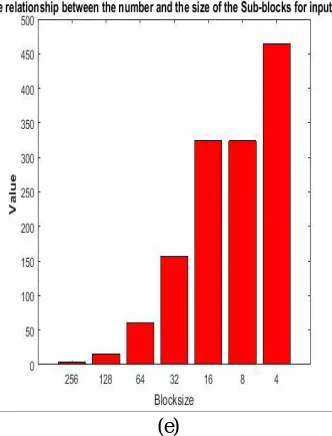
Table 1: The relationship between the number and the size of the Sub blocks and different threshold values for threshold equal to 0.25
S.N o.
Previous results Proposed results
256× 256
128× 128
64×64 32×32 16×16 8×8 4×4
1 4 15 57 140 285 285 406
2 4 16 60 152 283 283 389
3
4 16 63 183 495 495 966
4
4 16 59 160 339 339 545
5
C. Graphs for Quad-Tree Decompositions
(a)
(b)
(c)
(e)
Figure 10: The relationship between the number and the size of the input images in TABLE:1 (a)For the first image(b) For the second image(c) For the third image(d) For the fourth image(e) For the fifth image
VI. CONCLUSION
To the experience of the author, this whole project firstly applies QTD algorithm to detect the seed point inside the tumor. Furthermore, taking the benefit of Active contour, the foreground and background form of the image has been found. After that, the successful automatic evaluation of the centroid of the tumor in the image is located . The result of 50 breast tumor images justify the result with the accuracy rate of 99%.
REFERENCES
[1] H. Z. S. W. Foo, S. K. and C. H. Thng, "AUTOMATED BREAST MASSES SEGMENTATION IN DIGITIZED MAMMOGRAMS," in International Workshop on Biomedical Circuits & Systems , 2004.
[2] A. M. and D. N. M. , "Combining Low-, High-Level and Empirical Domain Knowledge for Automated Segmentation of Ultrasonic Breast Lesions," in TRANSACTIONS ON MEDICAL IMAGING, 2003.
[3] S. P. and G. R. , "A complete automatic region growing method for segmentation of masses on ultrasound images," in Biomedical and Pharmaceutical Engineering, 2006.
[4] J. S. H. S. and Y. W. , "Completely automated segmentation approach for breast ultrasound images using multiple-domain features," in Ultrasound in Medicine & Biology, 2012.
[5] L. H. C. W. L. C. and L. Z. , "Comparisons of Encryption Algorithms in Histogram-Equalized Image," in Networking and Distributed Computing (ICNDC), 2013.
[6] D.-R. C. R.-F. C. C.-J. c. M. F. ho, S.-J. K. S.-T. C. S.-J. H. and W. K. Moon, "Classification of breast ultrasound images using fractal feature," in Clinical Imaging, 2005.
[7] M. K. J. K. and J. K. , "Survey of Contrast Enhancement Techniques based on Histogram Equilization," in International Journal of Advanced Computer Science and Applications, 2011.
[8] M. H. Y. E. E. A. and B. H. E. , "A novel algorithm for initial lesion detection in ultrasoundbreast images," in Journal of Applied Clinical Medical Physics, 2008.
[9] B. G. and A. E. Harby, "Qualitative image compression algorithm relying on quadtree, International Journal on Graphics," in International Journal on Graphics, Vision and Image processing (GVIP), 2008.
[10] "Quad-Tree decomposition method for areal upscaling of heterogeneous reservoirs: : Application to arbitrary shaped reservoirs," in Fuel, 2015.
[12] R. C. G. and R. E. W. , Digital image processing (2nd Edition), Prentice Hall, 2002.
[13] T. F. C. and L. A. V. , "Active contours without edges," in TRANSACTIONS ON IMAGE PROCESSING, 2001.