3960 EFFECT OF PROCESS AND FORMULATION VARIABLES: MUPIROCIN
LOADED BIODEGRADABLE POLYMERIC MICROSPHERES
V. Shanmugam1*, P.K. Lakshmi2, R.V.Suresh Kumar3
1Department of Pharmaceutics, Sri Padmavathi School of Pharmacy, Tiruchanur, IN-517503. 1Research Scholar, Research & Development, JNT University, Kakinada, IN-533003. 2Professor & Head of Pharmaceutics, G.Pulla Reddy College of Pharmacy, Hyderabad, IN-500028. 3. Professor & Head, Dept. of Surgery, Sri Venkateswara Veterinary University, Tirupati, IN- 517502.
*Corresponding author: V.Shanmugam; E-mail: [email protected]
ARTICLE INFO ABSTRACT
Key Words
Biodegradable microspheres, Flux, Mupirocin, Optimal design and
Process variables
Mupirocin is an antibacterial agent used as topical agent in the treatment of superficial infections by gram positive bacteria, particularly staphylococcus aureus. The purpose of the study was to formulate and
invitro exploration of mupirocin encumbered biodegradable
microspheres using simple orthogonal factorial design. The concentration of retardant material, volume of external and internal phase, stirring speed and time and polymer-drug ratio as independent variables and the effects were analyzed on dependent variables like particle size, morphology, percentage drug loading and percentage drug entrapment efficiency. The function of desirability (DF) (di) was
produced to optimize the formulation by design expert software. Data analysis showed that microspheres with optimum diameter, shape, drug loading and drug release were 70.4µm, round, 32.5%(w/w) and 86.5% respectively with 3% chitosan, 75mg mupirocin, 10ml internal phase, 50ml external phase containing 2% span 80 emulsified at 1500 rotations per minute for 2hrs stabilization. The invitro release of mupirocin from chitosan microspheres was suggested to be controlled by the dissolution and diffusion from the matrix. The independent variables had great significant effects on dependent variables and a significant burst release effect and sustained delivery of mupirocin for more than 24 hrs.
INTRODUCTION:
Mupirocin calcium is a salt of pseudomonic acids which is having antibacterial activity produced by the growth of pseudomonas fluorescens inhibiting bacterial isoleucyl transfer ribonucleic acid– tRNA synthetase and blocking protein synthesis (R Sutherland et al 1985). The clinical effectiveness of mupirocin and impairing of wound healing in infected tissues is the result of its antibacterial action
(F Jacobsen et al 2011). Mupirocin itself does not form a depot in the skin; its metabolites (biologically inactive monic acid) are present in the skin for up to 168 hours after application (Reilly GD et al 1984). In an invitro study, mupirocin with occlusion achieved a fivefold greater penetration than without occlusion (Radika O et al 2014). The applications of biodegradable polymeric carrier provide a
An Elsevier Indexed Journal ISSN-2230-7346
3961
process of controlled and localized delivery of drugs. Nevertheless the biodegradable polymer dissolves/degrades rather rapidly in aqueous biological systems (Suping Lyu et al 2009). Hence the difficulty in polymer modification and production of a long period drug delivery carrier. These problems require the use of cross linking agent to form hydrophilic lipophilic networks to avoid rapid dissolution (Enas M.A. et al 2015). The selection of an encapsulation technique is primarily determined by the solubility uniqueness of the drug and polymer (Rainer Alex et al., 1990). The biodegradable mupirocin microspheres (MM) developed with suitable microencapsulation method should ideally produce high yields microparticles and free of agglomeration, high entrapment of drug substance, a reproducible release profile characteristics (M Jelvehgari et al., 2006).
The study was to explorate the mupirocin loaded biodegradable polymeric microspheres by the use of simple orthogonal design. The effects of internal and external phase volume ratio, stirring speed and time, drug: polymer ratios were analyzed on morphology, size of the particle, drug entrapment efficiency and drug release was studied. The orthogonal factorial design is an efficient tool for optimization of formulation design with an appropriate mathematical model.
MATERIALS AND METHODS
Mupirocin is a gift sample from Fourrts India laboratories, Chennai. Gelatin, Chitosan and sodium alginate were supplied by Merck; all other chemicals and reagents in this study used were of pharmaceutical and analytical grade.
Formulation of Mupirocin Loaded Microspheres (Table no 1)
Preparation of mupirocin loaded sodium alginate microspheres
Mupirocin (100mg) was previously dissolved in 25ml water was suspended sodium alginate (2%w/v) solution, homogenized for 15 min. The mixture was carefully added drop wise to the dispersion medium (100 ml) consisting of a mixture of
light and heavy liquid paraffin in a specific ratio (2:1) and 2 ml of span 80. The dispersion was stirred for 15 min to obtain w/o emulsion and was cross linked by the addition of CaCl2 (5%w/v) solution (2ml) of
specific strength (Shanmugam V et al., 2016) and continued stirring for 10 minutes. Microspheres were rigidized by adding 10ml of petroleum ether (10 ml) after 5 minutes. The microspheres were vacuum filtered and removed the adhered liquid paraffin by multiple washings with cold pet. Ether and freeze dried (M.C. Gohel et al 1998).
Preparation of mupirocin loaded gelatin microspheres
100mg mupirocin was dissolved in water and added to 25ml of preheated gelatin solution (5% m/V, in water) and added drop-wise to 100 ml) consisting of a mixture of light and heavy liquid paraffin in a specific ratio (2:1) with 2ml of Span 80 (Jayvadan patel et al., 2010). The biphasic system was stirred using an overhead stirrer to form a w/o emulsion. 2 ml of gluteraldehyde(GTA)-saturated toluene was added to the w/o emulsion (Majeti NV et al 2000) and stirred at 1000 rpm. Microspheres were rigidized, washed free of oil ice cold with isopropyl alcohol and dehydrated with 20 ml of acetone. Microspheres were freeze dried to obtain a yellow to yellowish orange colored free flowing material. (Rassoul D et al 2005).
Preparation of mupirocin loaded chitosan microspheres
3962
filters), (S. Senthil kumar et al 2012) washed with equal volume of n-hexane (non solvent) (Jelvehgari et al., 2010) and freeze dried (Anil K. Anal et al 2006).
Process variables in preparation of microspheres
Effect of polymer on physical appearance and particle size
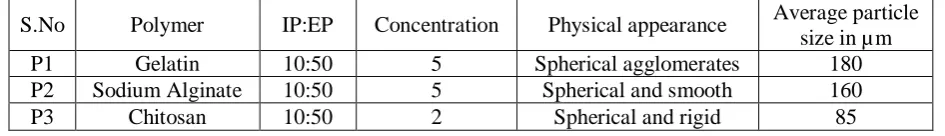
For the selection of polymer, various investigations were carried out using different polymers like gelatin, sodium alginate and chitosan (M.Jelvehgari et al 2010) with constant drug to polymer ratio of 2:1 and the stirring speed of 2000 rpm for a period of 5 hrs. Initial selections of both the phases were based on the solubility of mupirocin and biopolymers (Gelatin, Sodium alginate, Chitosan). The formed microspheres (P1 to P3) were evaluated for physical appearance and particle size.
Effect of concentration of retardant material
To optimize the concentration of polymers in the internal phase, microspheres were prepared using 10ml internal phase and 100 ml of external phase with varying concentration of retardant material. The minimum concentration of retardant material required for the formation of microspheres was determined. The microspheres (R1 to R9) were characterized for physical appearance; particle size (P.S) and production yield (P.Y) (Y M Jagtap et al 2012).
Effect of volume of external phase
Different volumes of internal phase i.e. distilled water were evaluated using 25, 50, 75, 100, 125 and 150 ml of external phase but the drug to polymer ratio was kept constant at 1:1 as internal phase, stirring speed of 1000 rpm for the period of 5 hours with surfactant concentration of 1% w/v of the external phase. The formed microspheres (MM1-MM6) were evaluated for their particle size, drug content (DC), percentage drug entrapment (DE) and free drug (Jelvehgari M et al 2006).
Effect of volume of internal phase
Different volumes of external phase were evaluated using 5 ml, 10 ml, 15 ml, 20 ml, 25 ml and 30 ml of the internal phase, but the drug to polymer ratio was kept constant at 1:1 in 100 ml of external phase, stirring speed of 1000 rpm for a period of 5 hours with surfactant concentration of 1.0%w/v of external phase. The formed microspheres (MM7-MM12) were evaluated for their particle size, drug content, entrapment efficiency and free drug (Jelvehgari M et al 2010).
Effect of stirring speed on formation of microspheres
Micro particles were prepared with different rpm of 500, 1000, 1500, 2000, 2500 and 3000 keeping the other entire variables constant (Utsav C. Rathod et al 2012) and the formed microspheres (MM13-MM18) were evaluated for their particles size, drug content, entrapment efficiency and free drug.
Effect of stirring time on the formation of microspheres
Microspheres were prepared at different time intervals of 1, 2, 3, 4, 5 and 6 hours keeping the other entire variables constant. The microspheres (MM19-MM24) were evaluated for particle size, drug content, entrapment efficiency and free drug (Nokhodchi A et al 2007).
Effect of Drug: Polymer ratio
In order to evaluate the effect of drug on the microspheres and its release characteristics, different polymers to mupirocin ratios (1:1, 2:1, 3:1, 4:1, 5:1 and 6:1) were used to prepare microspheres. The formed microspheres (MM25-MM30) were evaluated for their production yield, particle size, drug content, entrapped drug and free drug (Jelvehgari M et al 2006).
Evaluation of Mupirocin Microspheres
Percentage yield of microspheres
(Shovarani KN et al 1994) The yield of microspheres was calculated by the following formula:
3963
Drug content
Microspheres equivalent to 100 mg of mupirocin were dissolved in 100 ml of methanol, further dilutions were made to Beer’s range and absorbance was measured at 220nm by UV spectroscopy (Ghosh A et al 2007).
Free drug content
Microspheres equivalent to 100mg of mupirocin were washed with 100ml of Polyethylene glycol 400 (PEG 400). Filtrate was suitably diluted to get a concentration within Beer’s range and measured the absorbance at 220nm using UV spectrophotometer against blank (Ghosh A et al 2007).
Determination of entrapment efficiency
Weigh accurately microspheres equivalent to 100mg of mupirocin and dissolved in dilute acidic condition and vortexed. After 15 minutes of agitation, centrifuge the solution and measure the supernatant liquid for absorbance at 228nm by UV spectroscopy (Gohel MC et al 2005). The percentage of entrapment efficiency was calculated by the following formula:
% Entrapment efficiency =
Theoretical drug/ Released drug Theoretical drug ×100
Particle size analysis
The dried microspheres were dispersed in isopropyl alcohol and vortexed for 10 seconds to reduce the inter particle interactions; the particle size of microspheres were measured using a Microtrac S3500, USA particle size analyzer. (Shovarani KN et al 1994).
Morphology by scanning electron microscopy
The external morphology of microspheres was visualized at an accelerating voltage of 0.3–30 kV and identified by using SE, BSE detectors (B.Sree Giri Prasad et al 2011) using scanning electron microscopy (SEM, Hitachi, Japan).
In vitro drug release from microspheres:
Mupirocin microspheres equivalent to 10mg
of mupirocin were added to dissolution medium (100ml of pH 7.4 PBS) and kept at 37 ± 50C for 72 hours. At predetermined
time intervals aliquots were drawn and maintained the sink condition. After suitable dilutions, the samples absorbance was analyzed spectrophotometrically at 220nm and compared with the stock solution. The experiment was carried out in triplicate (MG Sankalia et al 2005).
Experimental design and optimization (Ya Min Wang et al 2006)
An orthogonal design was used to optimize the formulation of microspheres with different levels as given in the table 2. Seven factors of mupirocin microsphere formulation and 3 levels for each factor were selected based on our preliminary data and simple orthogonal experimental table was arranged accordingly. To compare each of the formulation quantitatively and qualitatively, the function of desirability (di)
was calculated according to Hassan et.al (1992).
di = Y1 - Ymin/Ymax-Ymin
di values were calculated from
percentage of particles, drug content, drug entrapment efficiency, morphology and free drug in each formulation batch respectively. These factors were not considered for optimization because prolong time to differentiate required drug release profiles for several preparations, although drug release properties is an important goal of microsphere formulation. The normalization of 5 levels of mupirocin microspheres by Ymax and Ymin values respectively are given
in table 3. The function of desirability (FD) of various formulations was compared by a statistic analytical system to identify the optimal formulation mixture of optimum levels of each factor. (Hassan E.E et al 1992).
3964
eliminated out of the model. The experimental results were analyzed the influence of variables on the particle size distribution, drug content and drug loading efficiency by utilizing the simplified models.
RESULTS AND DISCUSSION Effect of Process Variables
The minimum concentration of retardant material required in the internal phase was found to be in case of sodium alginate, % in case of gelatin and % in case of chitosan. At these concentrations the microspheres formation was initiated and showed good physical characteristic like proper shape, size, particle size (figure 1) and did not collapse even after removal from the solvent and subsequent drying. It was found that by decreasing the internal phase volume increased the particle size of microspheres (Li X, et al., 1999). When the viscosities of the internal phase of these formulations were studied, it was found that the particle sizes of microspheres were directly proportional to the viscosities of the dispersed phase. When the dispersed phase with higher viscosity was poured into continuous phase, due to the higher viscosity of the internal phase, the formed emulsion globules could not be divided into smaller particles and bigger droplets were formed with increased mean particle size (M.Jelvehgari et al., 2010). Table 6 also shows that when the amount of internal phase volume was increased from 25 to 150, % entrapment and drug content of microspheres decreased. This could be probably due to the lower concentration of the drug in the higher volume of internal phase (Rainer Alex et al., 2008).
The volume of external phase plays a crucial role in the formation of microspheres with reduction in free drug concentration and particle size. The results of the study show that the particle size ranged from 58µm to 112µm. The free drug concentration varied from 3.76% to 5.14%, when the volume of external phase varied from 25ml to 150 ml. It was found that was the optimum volume necessary and resulted
in the mean particle size of 87 µm with 83.16% entrapment efficiency.
3965 Table 1: Formulation of mupirocin microspheres
Ingredients F1 F2 F3
Mupirocin (mg) 100 100 100
Sodium alginate (%) 2.0 - -
Gelatin (%) - 5.0 -
Chitosan(%) - - 1.0
Glutaraldehyde saturated toluene (ml) 2 - -
Trisodium polyphosphate (ml) 2
Calcium chloride (5%(w/v)) (ml) - - 2
Heavy/ Light liquid paraffin (ml) 100 100 100
Span 80 (ml) 2 2 2
Cold pet. ether q.s q.s q.s
Isopropyl alcohol qs -
Acetone+ n-Hexane+3% Acetic acid - - qs
Water q.s - -
Table 2: Experimental optimal design – Orthogonal
Factor LEVEL
1 2 3 4 5 6
Polymer G C S A - - -
Concentration of polymer (% w/v)
a b c a b c a b c
- - -
5, 10, 15 0.5, 1, 1.5 2.5, 5, 7.5
Volume of Internal phase (ml) 5 10 15 20 25 30 Volume of External phase (ml) 25 50 75 100 125 150
Stirring rate (RPM) 500 1000 1500 2000 2500 3000
Stirring Time (hrs) 1 2 3 4 5 6
Drug : Polymer ratio 1:1 2:1 3:1 4:1 5:1 6:1
Table 3: Normalization of 5 indices by Ymax and Ymin values
Source factors Ymax Ymin
1. % of particle size in 50-150µm Y1 100 10 2. Drug content (%w/w) Y2 100 30 3. Drug trapping efficiency (%) Y3 80 20 4. Morphology Y4 Round Irregular
5. Free drug (%) Y5 30 5
Table 4: Effect of polymer(s) on formation and particle size of microspheres
S.No Polymer IP:EP Concentration Physical appearance Average particle size in µm
P1 Gelatin 10:50 5 Spherical agglomerates 180
P2 Sodium Alginate 10:50 5 Spherical and smooth 160
3966 Table 5: Effect of concentration of retardant material (polymer) in the internal phase (I.P)
S.No Polymer I.P
(%w/v) Physical appearance
Particle size (50-00µm)
Average P.S(µm)
% yield
R1 Gelatin 5 Spherical agglomerates 33.47 125 89.6
R2 Gelatin 10 Spherical agglomerates 36.87 132 88.4
R3 Gelatin 15 Uniform sized 41.05 144 89.7
R4 Sodium alginate 2.5 Spherical and smooth 11.24 118 82.3 R5 Sodium alginate 5.0 Spherical and smooth 12.70 120 83.8 R6 Sodium alginate 7.5 Spherical agglomerates 14.12 112 82.6
R7 Chitosan 0.5 Not uniform 30.91 94 88.2
R8 Chitosan 1.0 Spherical agglomerates 65.85 58 88.0
R9 Chitosan 1.5 Spherical and rigid 78.70 68 88.5
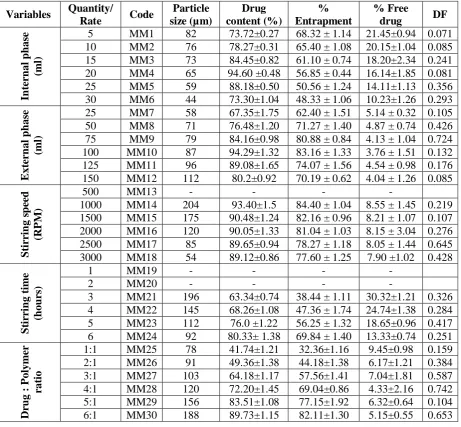
Table 6: Effect of process and formulation variables on microspheres
Variables Quantity/
Rate Code
Particle size (µm)
Drug content (%)
% Entrapment
% Free
drug DF
In
te
rn
al
p
h
ase
(m
l)
5 MM1 82 73.72±0.27 68.32 ± 1.14 21.45±0.94 0.071 10 MM2 76 78.27±0.31 65.40 ± 1.08 20.15±1.04 0.085 15 MM3 73 84.45±0.82 61.10 ± 0.74 18.20±2.34 0.241 20 MM4 65 94.60 ±0.48 56.85 ± 0.44 16.14±1.85 0.081 25 MM5 59 88.18±0.50 50.56 ± 1.24 14.11±1.13 0.356 30 MM6 44 73.30±1.04 48.33 ± 1.06 10.23±1.26 0.293
E
xt
er
n
al
p
h
ase
(m
l)
25 MM7 58 67.35±1.75 62.40 ± 1.51 5.14 ± 0.32 0.105 50 MM8 71 76.48±1.20 71.27 ± 1.40 4.87 ± 0.74 0.426 75 MM9 79 84.16±0.98 80.88 ± 0.84 4.13 ± 1.04 0.724 100 MM10 87 94.29±1.32 83.16 ± 1.33 3.76 ± 1.51 0.132 125 MM11 96 89.08±1.65 74.07 ± 1.56 4.54 ± 0.98 0.176 150 MM12 112 80.2±0.92 70.19 ± 0.62 4.04 ± 1.26 0.085
S
ti
rr
in
g
sp
ee
d
(R
PM
)
500 MM13 - - - -
1000 MM14 204 93.40±1.5 84.40 ± 1.04 8.55 ± 1.45 0.219 1500 MM15 175 90.48±1.24 82.16 ± 0.96 8.21 ± 1.07 0.107 2000 MM16 120 90.05±1.33 81.04 ± 1.03 8.15 ± 3.04 0.276 2500 MM17 85 89.65±0.94 78.27 ± 1.18 8.05 ± 1.44 0.645 3000 MM18 54 89.12±0.86 77.60 ± 1.25 7.90 ±1.02 0.428
S
ti
rr
in
g
ti
m
e
(h
ou
rs)
1 MM19 - - - -
2 MM20 - - - -
3 MM21 196 63.34±0.74 38.44 ± 1.11 30.32±1.21 0.326 4 MM22 145 68.26±1.08 47.36 ± 1.74 24.74±1.38 0.284 5 MM23 112 76.0 ±1.22 56.25 ± 1.32 18.65±0.96 0.417 6 MM24 92 80.33± 1.38 69.84 ± 1.40 13.33±0.74 0.251
D
ru
g
:
Polym
er
rat
io
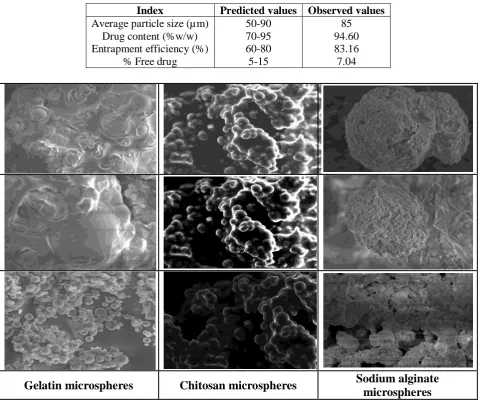
3967 Table 7: The model – predicted and observed values of the 4 indices under optimum conditions
Index Predicted values Observed values Average particle size (µm)
Drug content (%w/w) Entrapment efficiency (%)
% Free drug
50-90 70-95 60-80 5-15
85 94.60 83.16 7.04
Figure 1: Scanning electron microscopical images of biodegradable microspheres based on different concentrations of retardant material
Figure 2: Particle size report of MM9 formulation
3968
0 2 4 6 8 1 0 1 2 1 4 1 6 1 8 2 0 2 2 2 4 0
1 0 2 0 3 0 4 0 5 0 6 0 7 0 8 0 9 0 1 0 0
T i m e ( h )
C
u
m
u
l
a
t
i
v
e
%
D
r
u
g
R
e
l
e
a
s
e
M
M
2
6
M
M
2
7
M
M
2
8
M
M
2
9
M
M
3
0
Figure 3: Graph showing the effect of drug polymer ratio on invitro release profiles of mupirocin loaded biodegradable polymeric microspheres (data represent mean ±
standard deviation, n=3).
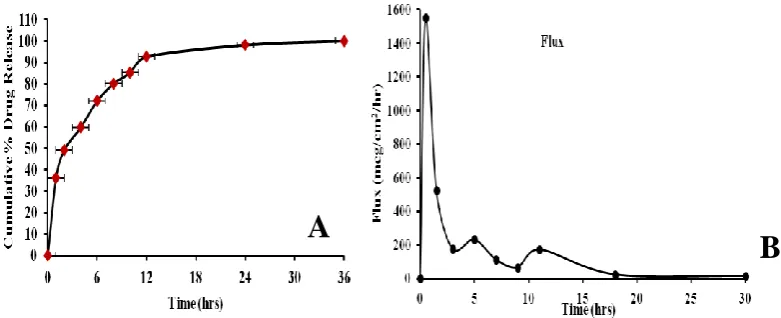
Figure 4: (A) Cumulative percentage drug release, (B) Drug release rate as a function of flux(mcg/cm2/hr)
The encapsulation efficiency gradually increased with increase in the drug to polymer ratio till ratio 6:1 ratio but no further increase in encapsulation efficiency was found with increasing drug to polymer ratio. But the mean particle size decreased and the particle size distribution become narrower. This effect may be due to higher viscosity and faster diffusion of the internal phase from the emulsion system.
Particle size and size distribution
The size distribution of microspheres were ranged from 10 to 80µm and the average particle size were found to be 280µm for gelatin microspheres, 800µm for sodium alginate microspheres and 12.5µm for chitosan microspheres as shown in figure 2. The particle size should be within the
range which can be penetrated through skin when applied topically (Cross S E et al., 2007) and should be accommodated in the pores. Particles in the range of 1 to 100µm shown better retention time/sustained effect through topical and transdermal delivery systems. Based on this investigation, we have attempted to formulate chitosan microspheres with further variables for their intended use.
Invitro drug release
The invitro drug release studies were performed in buffer saline (pH 7.2) close to the physiological skin conditions. Incorporation of mupirocin into the microspheres had a significant effect on the rate of drug release. Various variables like phase volume ratio, stirring speed and time,
A
3969
drug polymer ratio were illustrated in table 6. From the results, it was found that as concentration of polymer increases, the drug release percentage decreases (Analava Mitra et al., 2011). An initial burst release of drug was observed from all the batches that could be due to two reasons: the drug near or on the surface of the microsphere is the primary reason and secondly, well known leaching of drug with a faster ingress of the dissolution medium followed by diffusion of drug from porous nature of the microspheres (S. Senthil kumar et al., 2012), the pore providing a channel for release of the drug. The microspheres differ from micro sponges with their highly porous surface. The characteristic gives property control the drug release rate than that of the porous micro sponges. Among 30 formulations, MM8 showed a beneficial drug release effect of 40-50% burst release in 1st hour followed by controlled release observed till 24 hrs (figure 3 and figure 4(A). This release effect could support the therapeutic benefit with collagen scaffold.
Optimization of formulation by orthogonal design
The average particle size in µm, drug content, entrapment efficiency, free drug of microspheres of 27 formulations and whole desirability function are tabulated in table 6. The optimum combination of factors and levels for the preparation of mupirocin microspheres was established as A2; B2b; C4; D4; E5; F3 and G3 respectively. To 20ml of 1% (w/v) chitosan solution, 100mg of mupirocin is added, and the mixture is homogenized to obtain the desired dispersion. The mixed solution is added to 100ml of heavy/light liquid paraffin oil (1:1 ratio) containing 2ml of span 80 and emulsified at 2500 RPM for 3 hrs followed by stabilization with 2ml of 10% sodium tripolyphosphate solution for 1 hr. The reproducibility of this procedure was good, since no significant differences were observed in the mupirocin content, average particle size, entrapment efficiency, free drug content in all microspheres formulation prepared with optimum procedure. The average diameter was determined to be 65-85µm, drug content, %EE and %FD were
94.60±0.48, 83.16±1.33 and 7.04±1.81% (mean±S.D, n=3), respectively. The values of the 4 indices (Table 7) of the optimized formulation of mupirocin microspheres by this method appear to be close to the observed data. The rate of flux (figure 4(B)) of drug out of the microsphere per mass of formulation will increase with decreasing particle size (Neelesh K Varde et al., 2005).
CONCLUSION
Mupirocin loaded biodegradable microspheres were prepared using emulsification method followed by solvent removal. The polymer(s), concentration of retardant material, volume of internal and external phase, stirring speed and time, drug: polymer ratio influenced the agglomeration free microspheres. The entrapment efficiency was good for all formulations and the drug load was less unbiased with speed of stirring and time, volume of internal and external phase volume (dispersed and continuous phase volume). It was observed that the higher drug concentration, the mean particle size of the microspheres is elevated but smaller particle size with increasing the rate of stirring resulted here. The variation in the release profiles can be recognized to the difference in the surface of the microspheres regardless of the difference of particle size.
Acknowledgement
We are grateful to the principal and management, Sri Padmavathi School of Pharmacy, Tiruchanur, India for providing laboratory facility and constant encouragement.
REFERENCES
1. Analava Mitra and Baishakhi Dey. Chitosan microspheres in novel drug delivery systems. Indian Journal of Pharmaceutical Sciences. 2011; 73(4): 355-366.
2. Anil K. Anal, Willem F. Stevens. Chitosan–alginate multilayer beads for controlled release of ampicillin.
International Journal of
3970
3. B. Venkateswara Reddy and K. Krishnaveni. Formulation and evaluation of efavirenz microspheres. Der Pharmacia letters. 2015; 7(6): 1-9.
4. B.Sree Giri Prasad, Aceclofenac-loaded alginate microspheres prepared by ionotropic gelation method: effect of formulation variables on encapsulation efficiency, morphology and release characteristics. Der Pharmacia Letters, 2011, 3(2):10-24.
5. Baran Y, Baran S and Kemal N. Spectofotometric Determination of the pKa Values of Some Aminoacid Complexes of Pentacyanoferrate (II) and Pentacyanoruthenate (II).
Journal of Chemistry. 1997; 21: 105-110.
6. E E Hassan, Roy.C Parish, James M.Gallo. Optimized formulation of magnetic chitosan microspheres containing the anticancer agent, oxantrazole. Pharmaceutical Research. 1992; 9(3): 390-397. 7. E.L.Elliot, C.A.Kaysner, L.Jackson,
M.L.Tamplin, V.cholerae, V.parahaemolyticus, V.vulnificus and other Vibrio spp. Bacteriological Analytical Manual, 8th Edition, 1995.
8. Enas M. Ahmed. Hydrogel: Preparation, characterization and applications: A review. Journal of advanced research. 2015; 6(2): 105-121.
9. F Jacobsen, C Fisahn, M Sorkin, I Thiele, T Hirsch. Efficay of topically delivered moxifloxacin against wound infection by pseudomonas aeruginosa and methicillin resistant staphylococcus aureus.
Antimicrobial agents and
chemotherapy. 2011; 55(5): 2325-2334.
10.Ghosh A, Nayak UK, Roy P. Development, evaluation and method selection for the preparation of lamivudine microspheres. Pharma Times. 2007; 9(6): 67-71.
11.Jayvadan Patel, Darshna Patel and Jignyasha Raval. Formulation and evaluation of propranolol hydrochloride loaded Carbopol – 934P/ethyl cellulose mucoadhesive microspheres. Iranian journal of pharmaceutical research. 2010; 9(3): 221-232.
12.Jelvehgari M, Siahi-Shadbad MR, Azarmi S, Martin GP, Nokhodchi A. The microsponge delivery system of benzoyl peroxide: preparation, characterization and release studies.
International Journal of
Pharmaceutics. 2006; 308(1-2): 124-132.
13.Li X, Deng X, Yuan M, Xiong C, Huang Z, Zhang Y, Jia W, Investigation on process parameters involved in preparation of polylactide-poly(ethylene glycol) microspheres containing Leptospira Interrogans antigens. Int. J. Pharm.,
1999; 178: 245-255.
14.Lydia Echevarria, Maria J Blaco Prieto, Miguel Angel Campanero, Susana Santoyo, Pilar Ygartua. Development and validation of a liquid chromatographic method for in vitro mupirocin quantification in both skin layers and percutaneous penetration studies. Journal of chromatography B. 2003; 796(2): 233-241.
15.M.C. Gohel, G.K.Jani, A.F.Amin. Application of classical experimental design for the development of theophylline microspheres. Journal of controlled release.1998; 45(3): 265-271.
16.M.Jelvehgari, A.Nokhodchi, M.Rezapour, H.Valizadeh. Effect of formulation and processing variables on the characteristics of tolmetin microspheres prepared by double emulsion solvent diffusion method.
Indian Journal of Pharmaceutical Sciences. 2010; 72(1): 72-78.
3971 Pharmaceutical Sciences. 2000;
3(2): 234-58.
18.Nakamura J. Baba S, Nakamura T, Sasaki H and Shibasaki J. A method for the preparation of calibration curves for acetaminophen glucuronide and acetaminophen sulfate in rabbit urine without use of authentic compounds in high-performance liquid chromatography.
Journal of Pharmaco Bio dynamics. 1987; 10(11): 673-677.
19.Navneet Sharma, Parshotam Madan, Senshang Lin. Effect of process and formulation variables on the preparation of parenteral paclitaxel-loaded biodegradable polymeric Nanoparticles: A cosurfactant study.
Asian Journal of Pharmaceutical Sciences. 2016; 11(3): 404-416. 20.Neelesh K Varde and Daniel W
Pack. Microspheres for controlled release drug delivery. Expert opinion on biological therapy. 2004; 4(1): 35-51.
21.Netal Amrutiya, Amrita bajaj, Madhu Madhan. Development of microsponges for topical delivery of mupirocin. AAPS PharmSciTech. 2003; 10(2): 402-409.
22.R Suterland, R J Boon, K E Griffin, P J Masters, B Slocombe and A R White. Antibacterial activity of mupirocin (pseudomonic acid), a new antibiotic for topical use.
Antimicrobial agent’s chemotherapy. 1985; 27(4): 495-498.
23.Radka Opatrilova and Josef Jampilek. Rapid screening of mupirocin skin permeation modification by micronized and nanonized alaptide. ADMET & DMPK. 2014; 2(1): 56-62.
24.Rainer Alex & Ronald Bodmeier. Encapsulation of water soluble drugs by modified solvent evaporation method. Effect of process and formulation variables on drug entrapment. Journal of microencapsulation. 1990; 7(3): 347-355.
25.Rainer Alex, Ronald Bodmeier. Encapsulation of water soluble drug by a modified solvent evaporation method. Effect of process and formulation variables on drug entrapment. Journal of
microencapsulation. 1990; 7(3):
347-355.
26.Rasoul Dinarvand , Elham Rahmani and Efat Farbod. Gelatin Microspheres for the Controlled Release of All-trans-Retinoic Acid Topical Formulation and Drug Delivery Evaluation. Iranian Journal of Pharmaceutical Research (2003); 2(1); 47-50.
27.Ravin Gnanasambandam, A Proctor. Determination of pectin degree esterification by diffuse reflectance fourier transform infrared spectroscopy. Food chemistry. 2000; 68(3): 372-332).
28.Reilly GD, Spencer RC, Pseudomonic acid – anew antibiotic for skin infections. The Journal of antimicrobial chemotherapy. 1984; 13(3): 295-298.
29.S. Senthil kumar, Avik Kumar Saha, Kunchu Kavitha and Sanat Kumar Basu. Evaluation of clobazam loaded ionically cross-linked microspheres using chitosan. Der Pharmacia Sinica. 2012; 3 (6): 616-623.
30.Sankalia M.G., Mashru R.C., Sankalia J.M., Sutariya V.B. Reversed chitosan–alginate polyelectrolyte complex for stability improvement of alpha-amylase: optimization and physicochemical characterization. Eur. J. Pharm and Biopharm. 2007; 65(2): 215-232. 31.Sheree. Human skin penetration of
sunscreen Nanoparticles: Invitro assessment of a novel micronized zinc oxide formulation. Skin pharmacol physiol. 2007; 20: 148-154.
32.Shovarani KN, Goundalkar AG. Preparation and evaluation of microsphere of diclofenac sodium.
3972
33.Shraga Pinchas. Infrared absorption of aldehydic C-H group. Analytical chemistry., 1955; 27(1): 2-6.
34.Suping Lyu and Darrel Untereker. Degradability of polymers for implantable biomedical devices.
International Journal of Molecular Sciences. 2009; 10(9): 4033-4065. 35.Tarek A Ahmed and Bader M
Aljaeid. Preparation, characterization and potential application of chitosan nanoparticles in pharmaceutical drug delivery. Drug Design, Development and Therapy. 2016; 10: 483-507. 36.Utsav C. Rathod, Anandkkumar K.
Patel, Dushyant A. Shah. Statistical Evaluation and Optimization of Influence of Stirring Speed and Polymer Concentration on Hollow Microspheres of Diltiazem HCl. Der Pharmacia Lettre. 2012; 4(3): 972-978.
37.Y M Jagtap, R K Bhujpal, A N Ranade and N S Ranpise. Effect of various polymer concentrations on physicochemical properties of floating microspheres. Indian Journal of Pharmaceutical Sciences.
2012; 74(6): 512-520.
38.Ya Min Wang, Hitoshi Sato, Isao Adachi, and Isamu Horikoshi. Optimization of the formulation design of chitosan microspheres containing Cisplatin. Journal of
Pharmaceutical Sciences. 1996;