M E T H O D
Open Access
LUMPY: a probabilistic framework for structural
variant discovery
Ryan M Layer
1, Colby Chiang
1, Aaron R Quinlan
1,2,3*and Ira M Hall
1,3*Abstract
Comprehensive discovery of structural variation (SV) from whole genome sequencing data requires multiple detection signals including read-pair, split-read, read-depth and prior knowledge. Owing to technical challenges, extant SV discovery algorithms either use one signal in isolation, or at best use two sequentially. We present LUMPY, a novel SV discovery framework that naturally integrates multiple SV signals jointly across multiple samples. We show that LUMPY yields improved sensitivity, especially when SV signal is reduced owing to either low coverage data or low intra-sample variant allele frequency. We also report a set of 4,564 validated breakpoints from the NA12878 human genome. https://github.com/arq5x/lumpy-sv.
Background
Differences in chromosome structure are a prominent source of human genetic variation. These differences are collectively known as structural variation (SV), a term that encompasses diverse genomic alterations including de-letion, duplication, insertion, inversion, translocation or complex rearrangement of relatively large (for ex-ample, >100 bp) segments. While SVs are considerably less common than smaller-scale forms of genetic vari-ation such as single nucleotide polymorphisms (SNPs), they have greater functional potential due to their larger size, and they are more likely to alter gene structure or dosage.
Our current understanding of the prevalence and im-pact of SV has been driven by recent advances in gen-ome sequencing. However, the discovery and genotyping of SV from DNA sequence data have lagged far behind SNP discovery and genotyping because they are funda-mentally more complex. SVs vary considerably in size, architecture and genomic context, and read alignment accuracy is compromised near SVs by the presence of novel junctions (that is, breakpoints) between the‘sample’ and reference genomes. Moreover, SVs generate multiple alignment signals, including altered sequence coverage within duplications or deletions (read-depth),
breakpoint-spanning paired-end reads that align discordantly relative to each other (read-pair), and breakpoint-containing single reads that align in split fashion to discontiguous loci in the reference genome (split-read) [1,2]. These diverse alignment signals are difficult to integrate and most algo-rithms use just one. Other methods use two signals, but to our knowledge these limit initial detection to one signal and use the second to add confidence, refine breakpoint intervals, or genotype additional samples [3-7].
An approach that integrates multiple signals allows for more sensitive SV discovery than methods that examine merely one signal, especially when considering heteroge-neous samples and/or low coverage data, because each individual read generally produces only one signal type (for example, read-pair or split-read, but not both). The impact of improved sensitivity is particularly acute in low coverage datasets or in studies of heterogeneous cancer samples where any given variant may only be present in a subset of cells. However, even with high coverage data, integration of multiple signals can increase specificity by allowing for more stringent criteria for reporting a variant call.
Results
Here, we present a novel and general probabilistic SV discovery framework that naturally integrates multiple SV detection signals, including those generated from read alignments or prior evidence, and that can readily adapt to any additional source of evidence that may become avail-able with future technological advances.
* Correspondence:[email protected];[email protected]
1Department of Biochemistry and Molecular Genetics, Center for Public
Health Genomics, University of Virginia, Charlottesville, VA 22908, USA
2Department of Public Health Sciences, University of Virginia, Charlottesville,
VA 22908, USA
Full list of author information is available at the end of the article
Overview of LUMPY
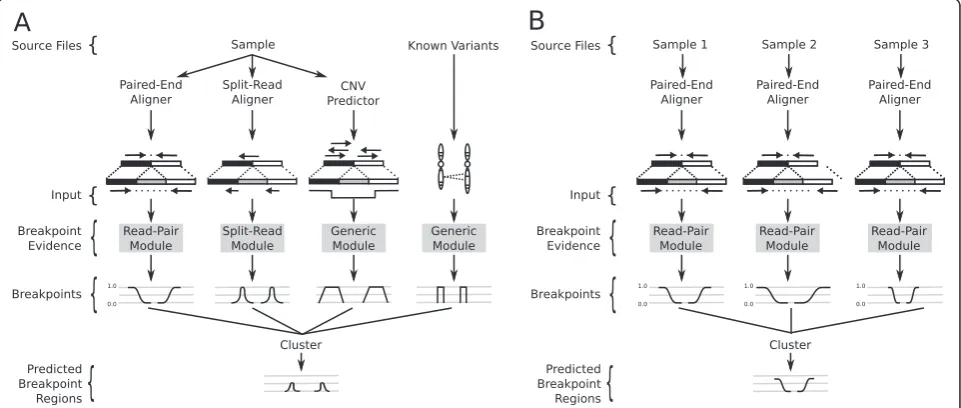
Our framework is based upon a general probabilistic representation of an SV breakpoint that allows any num-ber of alignment signals to be integrated into a single discovery process (Materials and methods). We define a breakpoint as a pair of bases that are adjacent in an ex-perimentally sequenced ‘sample’genome but not in the reference genome. To account for the varying level of genomic resolution inherent to different types of align-ment evidence, we represent a breakpoint with a pair of probability distributions spanning the predicted break-point regions (Figure 1; Materials and methods). The probability distributions reflect the relative uncertainty that a given position in the reference genome represents one end of the breakpoint.
Our framework provides distinct modules that map signals from each alignment evidence type to the com-mon probability interval pair. For example, paired-end sequence alignments are projected to a pair of intervals upstream or downstream (depending on orientation) of the mapped reads (Figure 1A). The size of the intervals and the probability at each position is based on the em-pirical size distribution of the sample’s DNA fragment li-brary. The distinct advantage of this approach is that any type of evidence can be considered, as long there ex-ists a direct mapping from the SV signal to a breakpoint probability distribution. Here, we provide three modules for converting SV signals to probability distributions: read-pair, split-read, and generic. However, we emphasize that our framework is readily extensible to new signals that may potentially result from new DNA sequencing
technologies or alternative SV detection approaches. The read-pair module maps the output of a paired-end se-quence alignment algorithm such as NOVOALIGN (C Hercus, unpublished) [8] or BWA [9], the split-read module maps the output of a split-read sequence align-ment algorithm (for example, YAHA [10], BWA-SW [11], or BWA-MEM [5]), and the generic module allows users to include signals that do not have a specific module implemented such as prior knowledge of known SV (for example, 1000 Genomes [12]), and output from copy number variation (CNV) discovery tools (for ex-ample, CNVnator [13]).
Once the evidence from the different alignment signals is mapped to breakpoint intervals, overlapping intervals are clustered and the probabilities are integrated (see Materials and methods for details). Any clustered break-point region that contains sufficient evidence (based on user-defined arguments) is returned as a predicted SV. The resolution of the predicted breakpoint regions can be improved by trimming the positions with probabilities in the lower percentile of the distribution (for example, the lowest 0.1%).
[image:2.595.58.539.472.676.2]It is well established that variant calling is improved by integrating data from multiple samples [5,6,14,15]. The LUMPY framework naturally handles multiple samples by tracking the sample origin of each probability distri-bution during clustering (Figure 1B; Materials and methods). As an example of a typical analysis, LUMPY can identify SVs in a whole-genome, 50X coverage paired-end Illumina dataset from the NA12878 CEPH individual in 12.2 hours using 8 Gb of memory using a
single processor (Materials and methods). Given that these performance characteristics are comparable to existing ap-proaches for SNP and indel detection, and that there is an approximately linear relationship between data volume, time and memory usage, we anticipate that simultaneous analysis of tens and eventually hundreds of human ge-nomes will be possible with LUMPY using commodity hardware.
We implemented LUMPY in an open source C++ software package (available at [16]) that is capable of detecting SV from multiple alignment signals in BAM [17] files from one or more samples.
Performance comparisons
We compared LUMPY’s performance to three other
popular and actively maintained SV discovery packages: GASVPro [4], DELLY [3] and Pindel [18]. These algo-rithms were selected due to their widespread use and in-clusion in large-scale projects such as The Cancer Genome Atlas (GASVPro) and 1000 Genomes (DELLY and Pindel). Moreover, Pindel was one of the first pub-lished SV discovery tools, and GASVPro and DELLY both consider a secondary SV signal along with paired-end alignments (read-depth and split-read, respectively). Both GASVPro and DELLY have also demonstrated substantial improvement over other popular SV tools such as Breakdancer [19] and HYDRA [20].
Detection performance was measured using both simu-lated data and previously published Illumina sequencing data from the widely studied NA12878 CEPH individual. The first simulation measured each tool’s basic detection capabilities in a prototypical scenario by simulating 2,500 homozygous variants from various SV classes at random genomic locations. The second simulation assessed the power of each tool to detect 5,516 known deletion variants present at varying allele frequencies within a mixed sam-ple, as often occurs in heterogeneous tumors. Lastly, the analysis of SVs in the NA12878 genome assessed the per-formance of each tool on real data containing sequencing errors and other detection confounders that are difficult to simulate. In addition, the analysis of NA12878 (and her parents) measured the effect of considering multiple samples, prior SV knowledge, and third-party CNV predic-tions on LUMPY’s performance. In each case, we measured performance in terms of sensitivity and false discovery rate (FDR) by comparing the predicted SV breakpoints to either known breakpoints or split-read alignments from long-reads (Pacific Biosciences (PacBio) and Illumina Moleculo) that span the breakpoint. Predictions that either overlapped known variants or had sufficient long-read support were considered true positives, and all other predictions were considered false positives (Materials and methods).
The simulated results were base on alignments gener-ated by NOVOALIGN, and the NA12878 results were
based on BWA alignments. In both cases, YAHA was used to generate split-read alignments. LUMPY was also tested using alternative read alignment pipelines using either BWA-backtrack or BWA-MEM for paired-end alignment, and BWA-MEM for split-read alignment (with roughly similar results; Figure 2D, E).
Homozygous variants of different structural variation types
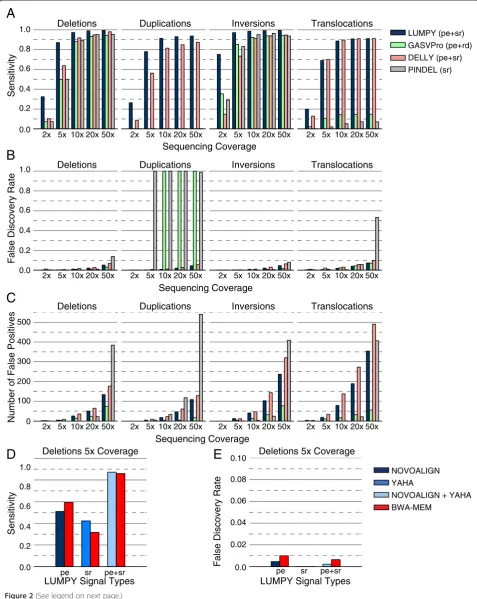
To assess the impact of coverage, SV type and SV size on algorithm performance, we first simulated a set of sample genomes that included 2,500 deletions, tandem duplica-tions, inversions and translocaduplica-tions, randomly placed throughout the human genome (Additional file 1). Vari-ants were created with SVsim, a tool that creates defined alterations to the reference genome (G Faust and I Hall, unpublished) [21]. For each SV type, the variant size ranged from 100 bp to 10 kb. We then used the WGSIM read simulator (H Li, unpublished) [22] to‘sequence’each simulated genome at 2X, 5X, 10X, 20X, and 50X haploid coverage.
LUMPY was consistently more sensitive than the other algorithms across nearly all coverage levels and SV types (Figure 2A). DELLY had negligibly higher sensitivity (less than one percentage point) for translocations at higher coverage. LUMPY and DELLY were the only algorithms that detected all variant types; GASVPro and Pindel do not support detection of tandem duplications. (Note that tandem duplication was added to Pindel since we per-formed the analysis.) LUMPY’s superior sensitivity was most dramatic in lower coverage tests (<10X). For ex-ample, LUMPY detected 32.4% and 87.2% of all deletions at 2X and 5X coverage, respectively, whereas GASVPro detected 7.4% and 49.8%, DELLY detected 10.3% and 63.8%, and Pindel detected 7.4% and 50%. At best, LUMPY was 35.5 times more sensitive than Pindel for detecting translocations at 5X coverage (69.1% versus 2%). At worst, LUMPY was 0.009 times less sensitive than DELLY for detecting translocations at 2X coverage (69.1% versus 70.0%). At higher coverage (10 to 50X), LUMPY’s sensitivity advantage persisted; it ranged from 88.8% to 99.6% across all SV types, whereas GASVPro ranged from 14.3% to 94.3%; DELLY ranged from 81.2% to 98.0%; and Pindel ranged from 5.2% to 96.5% (exclud-ing the SV types that GASVPro and Pindel are incapable of detecting).
LUMPY’s FDR remained low (less than 4%) in all but the highest coverage cases (Figure 2B), and there was only
one instance where LUMPY’s FDR was more than two
percentage points higher than the best performing tool (GASVPro’s FDR for inversions at 50X was 1.6% while
LUMPY’s was 4.9%). In general, the FDR for LUMPY,
Deletions Duplications Inversions Translocations
Sequencing Coverage 0.0
0.2 0.4 0.6 0.8 1.0
Sensitivity
Sequencing Coverage 0.0
0.2 0.4 0.6
False Discovery Rate
A
B
2x 5x 10x 20x
Deletions Duplications Inversions Translocations
0.8 1.0
LUMPY (pe+sr)
GASVPro (pe+rd) DELLY (pe+sr) PINDEL (sr)
50x 2x 5x 10x 20x 50x
2x 5x 10x 20x 50x 2x 5x 10x 20x 50x
2x 5x 10x 20x 50x 2x 5x 10x 20x 50x
2x 5x 10x 20x 50x 2x 5x 10x 20x 50x
Sequencing Coverage 0
100 200
Number of False Positives
C
2x 5x 10x 20x
Deletions Duplications Inversions Translocations
300 500
50x 2x 5x 10x 20x 50x
2x 5x 10x 20x 50x 2x 5x 10x 20x 50x
400
Deletions 5x Coverage
0.0 0.2 0.4 0.6 0.8 1.0
Sensitivity
0.0 0.02 0.04 0.06
False Discovery Rate
D
E
0.08
NOVOALIGN YAHA
NOVOALIGN + YAHA
BWA-MEM
pe
Deletions 5x Coverage
sr pe+sr LUMPY Signal Types
pe pe+sr
LUMPY Signal Types sr
[image:4.595.58.536.90.690.2]0.10
for GASVPro, 1% to 10% for DELLY, and 0% to 53.2% for Pindel. These patterns suggest that coverage-based param-eter tuning could be used to minimize FDR for all the tools (as in Figure 3). We also note that FDR calculations depend on the number of true positives, which vary widely across SV varieties (Figure 2C). In certain cases (for ex-ample, translocations), LUMPY had a far higher absolute number of false positives, but these were counterbalanced
by a much higher number of true positives as well. Alterna-tively, in cases where a specific SV type is not supported and no true positive calls were made (that is, GASVPro and Pindel for tandem duplications), the FDR reached 100%.
Heterogeneous tumor simulation
Variant detection is especially challenging in tumor stud-ies because biopsied samples generally include a mixture
[image:5.595.58.537.395.606.2](See figure on previous page.)
Figure 2Performance comparison using homozygous variants of various structural variation types.We simulated a genome with SVs by embedding 2,500 deletions, tandem duplications, inversions or translocations in random locations in the human reference genome. We then simulated sequence data from the altered genome with varying levels of sequence coverage. The performance measurements for LUMPY and DELLY were based on paired-end (pe) and split-read (sr) alignments, GASVPro considered pe and read-depth (rd), and Pindel considered sr alignments.(A)Sensitivity for each tool. LUMPY was the most sensitive in most cases, and had a marked improvement at lower coverage. DELLY detected three more translocations than LUMPY at 20X, at the expense of 93 more false positives.(B)The corresponding FDR for each tool. LUMPY’s FDR was low in all but the highest coverage cases. GASVPro and Pindel did not support tandem duplications, but false calls were made in some cases, which resulted in a 100% FDR.(C)The absolute number of false positive calls. LUMPY had a high number of false positives in some cases, but these are counterbalanced by a higher number of true positives(A).(D,E)To determine the impact that sequence alignment strategies had on SV detection accuracy, LUMPY’s sensitivity(D)and FDR(E)are shown when predicting deletions at 5X coverage via different alignment strategies from the simulations in (A-C). BWA-MEM produces both pe and sr alignment signals in a single alignment step, and serves as a basis of comparison to the NOVOALIGN (pe) and YAHA (sr) strategy. BWA-MEM provides better sensitivity than NOVOALIGN when using the pe signal alone, yet YAHA provides better sensitivity than BWA-MEM when using the sr signal alone. Sensitivity and FDR are roughly equivalent with either the BWA-MEM or NOVOALIGN/YAHA strategies when LUMPY integrates both alignment signals.
LUMPY (pe+sr) LUMPY + prior (pe+sr+prior) LUMPY trio (pe+sr) LUMPY & CNVnator (pe+sr&rd) GASVPro (pe+rd)
DELLY (pe+sr) PINDEL (sr)
PacBio/Moleculo Mills et al.
False Positives False Positives
s
e
vit
i
s
o
P
e
ur
T
PacBio/Moleculo
s
e
vit
i
s
o
P
e
ur
T
Mills et al. 50x
5x
s
e
vit
i
s
o
P
e
ur
T
s
e
vit
i
s
o
P
e
ur
T
A
B
500 1000 2500
2000
0 2000 4000 6000 8000 10000
False Positives False Positives
0 50 100 150 200
1000
0 200 600
400
0 2000 4000 6000 8000 10000
0 50 100 150 200
800
1000
0 200 600
400 800
1500 3000
500 1000 2500
2000
1500 3000
500 1000 2500
2000
1500
500 1000 2500
2000
1500
0 1000
0 1000
of abnormal and normal tissue, and because many tumor samples are composed of multiple clonal lineages defined by distinct somatic mutations. To assess the performance of our algorithm in this more realistic scenario where in-creased sensitivity is crucial, we simulated heterogeneous samples by pooling reads from an‘abnormal’genome and a‘normal’genome at varying ratios (Additional file 2). The source of the simulated abnormal genome was the human reference genome (build 37) modified (using SVsim) with 5,516 non-overlapping deletions identified by the 1000 Genomes Project [12], and an unmodified human refer-ence genome was used to simulate the normal genome. As above, each genome was ‘sequenced’ using WGSIM, and the reads from the two genomes were combined in varying proportions to create a single heterogeneous sam-ple. The ratio of the reads from the abnormal genome (SV allele frequency) varied between 5% and 50%, and the total coverage ranged from 10X and 80X. For example, to simu-late a sample with a 5% SV allele frequency at 10X cover-age, the abnormal genome was sequenced at 0.5X coverage and the normal genome at 9.5X coverage: when combined, the two sets of reads represent a single hetero-geneous sample sequenced at 10X coverage.
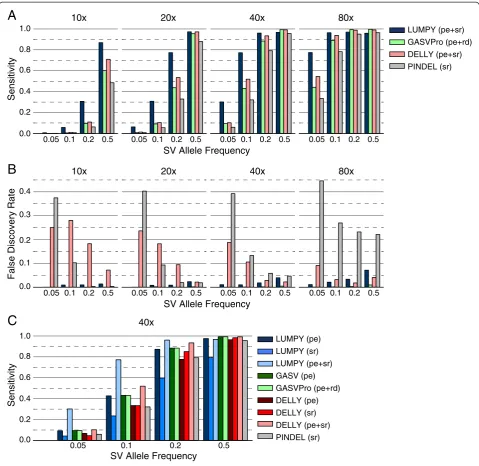
LUMPY was more sensitive than GASVPro, DELLY, and Pindel in nearly all cases, especially when the coverage of the abnormal genome was low owing to either lower coverage, low SV allele frequency, or both (Figure 4A). For example, at 10X coverage and 20% SV allele frequency LUMPY detects 30.7% of the SVs, whereas GASVPro, DELLY, and Pindel detect only 9.6%, 10.9%, and 6.2% of the SVs, respectively. This represents a 2.8-fold increase in sensitivity over the next best method. In general, to achieve the same level of sensitivity, GASVPro, DELLY and Pindel required roughly twice as much evidence as LUMPY (by either increased coverage or SV allele fre-quency). For example, at 20X coverage LUMPY detected 6.2% of variants present at 5% SV allele frequency, whereas GASVPro, DELLY, and Pindel required 10% SV allele fre-quency to achieve similar sensitivity (10.3%, 9.1%, and 5.5%, respectively). We note that this trend is also appar-ent across SV varieties in the previous homozygous test (Figure 2A). LUMPY had slightly lower sensitivity at higher coverage levels and SV allele frequencies, but was never more than four percentage points lower than the best performing tool. For example, at 80X coverage and 50% SV allele frequency LUMPY’s sensitivity was 95.9% and the best performing tool was GASVPro at 99.69% (a 3.79% difference).
In all but the highest coverage and SV allele frequency case, the FDR for LUMPY was less than 4% (Figure 4B), and the FDR for GASVPro was less than 1% in all cases. For DELLY and Pindel, the FDR was particularly high when SV allele frequency was low. For example, at 10X coverage the FDR for DELLY was 3.4 times higher at 5%
SV allele frequency than at 50% frequency, and the Pin-del FDR was 111.9 times higher. At 20X coverage these differences were 10.9 and 21.5 times higher at 5% fquency than at 50% frefquency for DELLY and Pindel, re-spectively. This is in contrast to LUMPY, where modest coverage-associated increases to FDR can likely be man-aged via parameter tuning, without significantly decreas-ing sensitivity.
SV detection in the NA12878 genome
Although it is difficult to precisely measure the sensitiv-ity and accuracy of SV predictions made from a real data set, it is also important to evaluate each tool’s perform-ance when confronted with real data containing artifacts that are not easily captured by simulations (for example, PCR artifacts, chimeric molecules, reads from poorly as-sembled genomic regions, and so on). In this experiment we compared SV detection performance in the NA12878 individual by analyzing the Illumina Platinum Genomes dataset, which represents approximately 50X coverage of the NA12878 genome (European Nucleotide Archives; ERA172924). We additionally subsampled this dataset to approximately 5X coverage to assess SV detection in low coverage scenarios.
To estimate sensitivity and FDR, we compared predic-tions made by each tool to two truth sets: 1) 3,376 vali-dated, non-overlapping deletions from the 1000 Genomes Project [12] (Additional file 3); and 2) 4,095 deletions that were detected by at least one tool in the 50X dataset, or that were reported by Millset al. [12] (which used nu-merous SV detection tools), and that were validated by split-read mapping analysis of independent long-read sequencing data from PacBio or Illumina Moleculo plat-forms (Additional file 4). We expect that mostbona fide
10x 20x 40x 80x
0.05 0.1 0.2 0.5 0.05 0.1 0.2 0.5
0.05 0.1 0.2 0.5 0.05 0.1 0.2 0.5
SV Allele Frequency 0.0
0.2 0.4 0.6 0.8 1.0
Sensitivity
10x 20x 40x 80x
0.05 0.1 0.2 0.5 0.05 0.1 0.2 0.5
0.05 0.1 0.2 0.5 0.05 0.1 0.2 0.5
SV Allele Frequency 0.0
0.2 0.3 0.4
False Discovery Rate
0.0 0.2 0.4 0.6 0.8 1.0
Sensitivity
40x
0.05 0.1 0.2 0.5
SV Allele Frequency
LUMPY (pe) LUMPY (sr) LUMPY (pe+sr)
GASV (pe) GASVPro (pe+rd)
DELLY (pe) DELLY (sr)
DELLY (pe+sr) PINDEL (sr)
A
B
C
0.1LUMPY (pe+sr) GASVPro (pe+rd)
[image:7.595.58.538.88.554.2]DELLY (pe+sr) PINDEL (sr)
a catalog of high-confidence structural variants in the NA12878 genome.
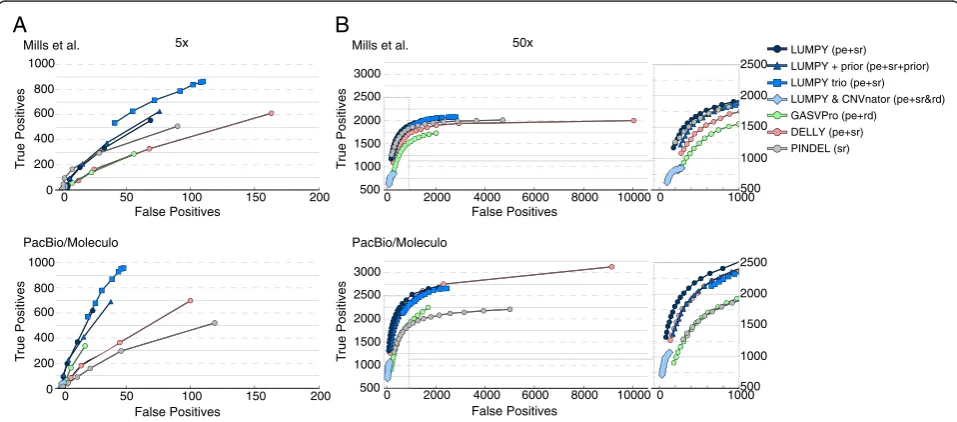
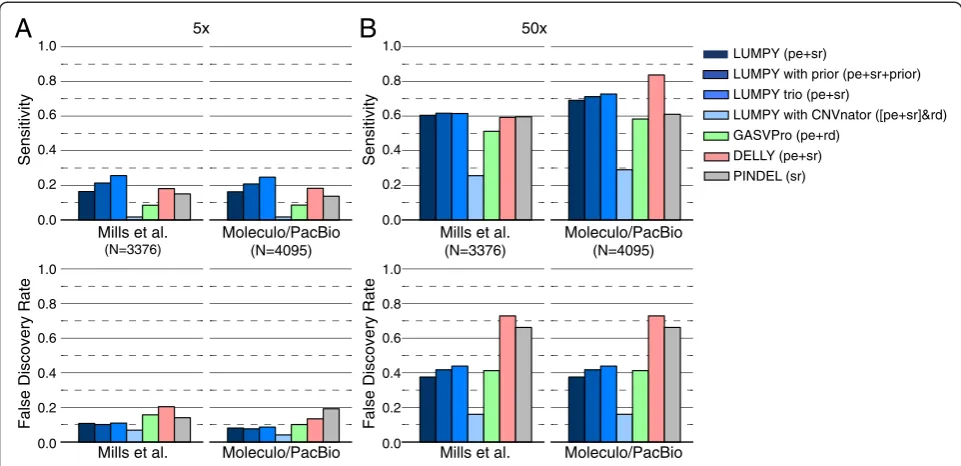
A unique strength of LUMPY relative to other tools is the ability to consider different types of evidence from multiple samples. To demonstrate this capability, we in-cluded results for four different LUMPY configurations: 1) the standard configuration of read-pair and split-read signals from NA12878; 2) read-pair and split-read signals from NA12878, as well as prior knowledge (using LUM-PY’s generic evidence module) of deletions discovered by the 1000 Genomes Project using low coverage whole genome sequencing (phase 1, release version 3); 3) read-pair and split-read signals from both NA12878 and her parents (NA12891 and NA12892); 4) read-pair and split-read signals from NA12878, plus CNV predictions based on read-depth analysis using CNVnator [13] (also using LUMPY’s generic evidence module). For clarity, this last dataset was filtered to only include LUMPY calls with both read-pair/split-read and CNV evidence. The last three calling strategies are unique to LUMPY and are intended to demonstrate both the ability and the benefit of including data from different samples, prior results, and other SV detection methods.
At 5X coverage (Figure 5A), LUMPY was more sensi-tive than both GASVPro and Pindel (16.4% versus 8.6% and 15% for the first (that is, 1000 Genomes) truth set and 16.3% versus 8.6% and 13.7% for the second (that is, the expanded‘long-read’) truth set and had a better FDR
[image:8.595.63.537.100.338.2](10.7% versus 15.7% and 14.1% for the first truth set and 8.1% versus 10.1% and 19.2% for the second truth set). While DELLY was more sensitive than LUMPY (18.1% for the first truth set and 18.3% for the second), it was at the expense of at least 60% higher FDR (20.4% and 13.4%). When LUMPY is provided with priors from the 1000 Genomes low coverage deletion calls, sensitivity in-creased to 21.3% and 20.8% with almost no change to FDR. Sensitivity is further improved to 25.6% and 24.7% when LUMPY performs simultaneous variant calling on NA12878 and her parents, with a similarly small effect on FDR, which clearly demonstrates the benefit of pooled variant calling on genetically related samples. In-clusion of read depth-based CNV calls as an additional input to LUMPY, followed by filtering to require CNV evidence, resulted in the lowest FDR among all tools (6.8% and 4.1%) but also greatly reduced sensitivity (1.7% in both cases); however, we note that CNVnator makes very few calls using low coverage data (n = 507), and thus this approach is better suited to high-coverage data (see below). As expected, the observed FDR for LUMPY, GASVPro, and DELLY was reduced (decreasing by 2.6, 5.6, and 7 percentage points, respectively) when lower coverage SV predictions were compared to the ex-panded ‘long-read’ truth set. In contrast, Pindel’s FDR increased by 5.2 percentage points; however, we note that this effect is expected considered that Pindel was used in part to create the 1000 Genomes Project truth
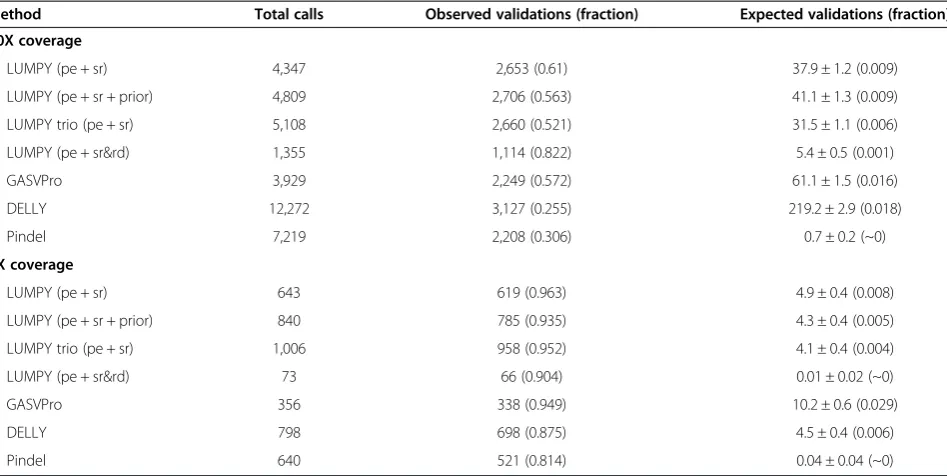
Table 1 Long-read validation rates for each tool relative to randomly permuted data
Method Total calls Observed validations (fraction) Expected validations (fraction) 50X coverage
LUMPY (pe + sr) 4,347 2,653 (0.61) 37.9 ± 1.2 (0.009)
LUMPY (pe + sr + prior) 4,809 2,706 (0.563) 41.1 ± 1.3 (0.009)
LUMPY trio (pe + sr) 5,108 2,660 (0.521) 31.5 ± 1.1 (0.006)
LUMPY (pe + sr&rd) 1,355 1,114 (0.822) 5.4 ± 0.5 (0.001)
GASVPro 3,929 2,249 (0.572) 61.1 ± 1.5 (0.016)
DELLY 12,272 3,127 (0.255) 219.2 ± 2.9 (0.018)
Pindel 7,219 2,208 (0.306) 0.7 ± 0.2 (~0)
5X coverage
LUMPY (pe + sr) 643 619 (0.963) 4.9 ± 0.4 (0.008)
LUMPY (pe + sr + prior) 840 785 (0.935) 4.3 ± 0.4 (0.005)
LUMPY trio (pe + sr) 1,006 958 (0.952) 4.1 ± 0.4 (0.004)
LUMPY (pe + sr&rd) 73 66 (0.904) 0.01 ± 0.02 (~0)
GASVPro 356 338 (0.949) 10.2 ± 0.6 (0.029)
DELLY 798 698 (0.875) 4.5 ± 0.4 (0.006)
Pindel 640 521 (0.814) 0.04 ± 0.04 (~0)
Monte Carlo simulations were performed to assess the rate at which false positive SV calls are validated purely by chance using split-read mapping analysis of
PacBio and Moleculo data. For each NA12878 deletion callset shown in Figures5and6, deletion coordinates were shuffled 100 times (retaining the breakpoint
set [12]. These results demonstrate that the expanded
‘long-read‘ truth set is a more comprehensive and un-biased reference; it will, therefore, be the basis for the remaining performance comparisons.
At 50X coverage (Figure 5B) and considering solely the second (‘long-read’) truth set, the effect on perform-ance was dramatic for all the tools except Pindel (as ex-pected given the aforementioned bias). DELLY had the highest sensitivity at 83.8%, but this came at the expense of an extremely high FDR (72.9%). GASVPRO and Pin-del exhibit intermediate levels of sensitivity (58.3% and 61%, respectively) and FDR (41.2% and 66.2%). LUMPY had the second highest sensitivity (69.1%) and the lowest FDR (37.5%) of any tool. When read depth-based CNV calls from CNVnator (n = 6,248) are included as input to LUMPY, the resulting FDR (15.3%) is nearly 2.5X lower than the next-best performing tool, although this comes at the cost of reduced sensitivity (29.5%). The main util-ity of such an analysis is therefore to greatly reduce lower FDR at calls exhibiting independent read-depth evidence, and to properly classify SVs that alter copy
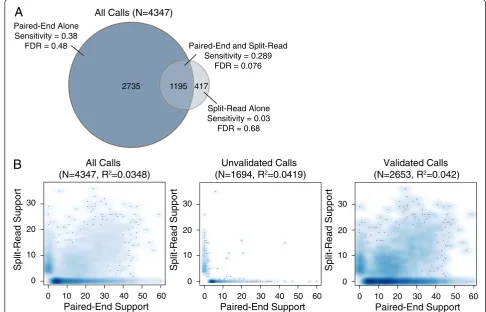
number. Similarly, if we consider a high confidence sub-set of 1,195 deletion calls that are detected by both paired-end and split-read signals, the FDR falls dramatic-ally from 37.5% to 7.6%, but sensitivity also decreases from 69.1% to 28.9% (Figure 6A). This indicates that most variant calls exhibiting both paired-end and split-read signals are true positives, but that many variants are not well captured by one or the other signal, presum-ably due to local sequence features that inhibit accurate alignment. This interpretation is consistent with the ob-servation that the strength of paired-end and split-read signals are not well correlated with each other (Figure 6B), which may account (at least in part) for LUMPY’s im-proved sensitivity over methods that consider the two signals sequentially. Taken together, the above results demonstrate that LUMPY provides significantly improved performance over other tools when one considers the trade-off between sensitivity and FDR.
In addition, the 4,095 deletions from our ‘long-read’ truth set (Additional file 4) combined with the 469 validated non-deletion variants reported by LUMPY
5x 50x
0.0 0.2 0.4 0.6 0.8 1.0
Sensitivity
False Discovery Rate
LUMPY (pe+sr)
LUMPY with prior (pe+sr+prior) LUMPY trio (pe+sr)
LUMPY with CNVnator ([pe+sr]&rd) GASVPro (pe+rd)
DELLY (pe+sr)
PINDEL (sr)
A
0.0 0.2 0.4 0.6 0.8 1.0
Mills et al.
(N=3376)
Moleculo/PacBio (N=4095)
Mills et al. (N=3376)
Moleculo/PacBio (N=4095)
Mills et al. Moleculo/PacBio Mills et al. Moleculo/PacBio
0.0 0.2 0.4 0.6 0.8 1.0
Sensitivity
False Discovery Rate
B
[image:9.595.57.538.89.322.2]0.0 0.2 0.4 0.6 0.8 1.0
(Additional file 5) provide what is, to our knowledge, the largest collection of validated SV breakpoints (N = 4,564) yet reported for a single ‘normal’ human genome. This dataset will be a valuable resource for future benchmark-ing studies.
Improved performance in common usage scenarios
Importantly, although the comparisons presented in Figure 5 are based upon the choice of a single detection threshold chosen for each tool (Materials and methods), LUMPY outperforms other tools across a broad spectrum of thresholds (Figure 3), indicating that the framework it-self - not arbitrary parameter choices - underlies LUMPY’s superior performance. It is also clear from this result that a more relevant measure of tool performance is the rela-tive SV detection sensitivity achieved by each tool under parameter settings that result in an acceptably low FDR. We therefore varied the minimum-evidence parameter of each tool to select settings that achieved an FDR of ap-proximately 10% at 5X coverage and apap-proximately 20%
at 50X coverage (Figure 7A). Using these settings, LUMPY was twice as sensitive as the next-best performing tool GASVPro (16.3% versus 8.6%) on low coverage 5X data, with DELLY at 4.9% and Pindel at 0.4% (Figure 7A). At 50X coverage, LUMPY was 1.1X more sensitive than the next-best performing tool, DELLY (58.2% versus 53%), with GASVPRO at 32.5% and Pindel at 33.5%. Therefore, when we control for FDR, LUMPY is significantly more sensitive than other tools on both low and high coverage data.
The above result has important practical implications: in the vast majority of genome sequencing-based study designs it is necessary to select tool parameter settings that constrain the FDR to acceptable levels, and an algo-rithm’s sensitivity under these conditions determines the number of true variants that can be discovered and the biological insights that can be gleaned. For example, at 5X coverage LUMPY finds 281 more true deletion vari-ants than the next-best tool, GASVPro (619 versus 338), and finds 237 ‘novel’ deletions not found by any other
A
B
417 1195 2735
Paired-End Alone Sensitivity = 0.38
FDR = 0.48
Split-Read Alone Sensitivity = 0.03
FDR = 0.68 Paired-End and Split-Read
Sensitivity = 0.289 FDR = 0.076 All Calls (N=4347)
tr
o
p
p
u
S
d
a
e
R-t
il
p
S
All Calls (N=4347, R2=0.0348)
Paired-End Support
0 20 50 60
0 20
10 30
30 40
10
tr
o
p
p
u
S
d
a
e
R-t
il
p
S
Unvalidated Calls (N=1694, R2=0.0419)
Paired-End Support
0 20 50 60
0 20
10 30
30 40
10
tr
o
p
p
u
S
d
a
e
R-t
il
p
S
Validated Calls (N=2653, R2=0.042)
Paired-End Support
0 20 50 60
0 20
10 30
30 40
[image:10.595.52.539.91.403.2]10
tool (Figure 7B). At 50X coverage, LUMPY finds 232 more deletions than the next-best tool, DELLY (2,246 versus 2,014) and 312‘novel’deletions not found by any other tool. In contrast, all other tools combined find only 46 variants not detected by LUMPY at 5X coverage, and only 428 at 50X coverage. Thus, although LUMPY finds only 196 truly novel validated deletions in NA12878 when one considers the entire set of calls made by all tools regardless of FDR (90 of which were not reported previ-ously [12]), LUMPY detects hundreds of true variants that are not detected by the other methods when rational parameters that constrain FDR are used. Considering that our algorithmic approach is especially advantageous when variant coverage is low, and that clinically relevant somatic variants are often present at low allele frequencies due to tumor heterogeneity, LUMPY’s unsurpassed sensi-tivity at acceptable FDR levels translates directly to more comprehensive variant callsets and, hence, new biological insights.
Discussion
We have developed a general probabilistic framework for SV discovery, and have demonstrated that our frame-work outperforms existing discovery tools across all SV types and coverage levels, and in both real and simulated human genome datasets. LUMPY’s performance improve-ments are especially pronounced when evidence is scarce, either due to low coverage data or low variant allele fre-quency. LUMPY therefore represents an important techno-logical advance, particularly in the context of cancer genomics where sensitivity is crucial for identifying low frequency variants within heterogeneous tumor samples.
LUMPY’s high sensitivity is a direct consequence of combining multiple SV detection signals. LUMPY inte-grates disparate signals by converting them to a common format in which the two predicted breakpoint intervals in the reference genome are represented as paired probability distributions. SV prediction operations are then per-formed at this higher level. This novel approach has the
5 0
2
2
1 0
1
4 0
46
35
237 5
237
90 5x
50x 0.0 0.2 0.4 0.6 0.8 1.0
Sensitivity
False Discovery Rate
A
0.0 0.2 0.4 0.6 0.8 1.0
False Discovery Rate
Sensitivity
Private/Shared Moleculo/PacBio Validated Calls
732 8
267
48
2 0
69
137
346 16
393
204
125 15
312
B
5x Coverage, 10% FDR
LUMPY (pe+sr)
GASVPro (pe+rd) DELLY (pe+sr) PINDEL (sr) Moleculo/PacBio (N=4095)
[image:11.595.54.538.91.354.2]50x Coverage, 20% FDR
key advantage that any SV detection signal can be inte-grated into the framework so long as a breakpoint prob-ability can be assigned to each base pair in a candidate breakpoint region. Potential detection signals include paired-end and split-read alignments, alignments from assembled contigs, raw read-depth measurements, or CNVs detected by segmentation of read-depth, array comparative genomic hybridization or SNP array data. As we demonstrate using the NA12878 genome, inclu-sion of previously discovered SVs as priors can signifi-cantly enhance SV discovery sensitivity, while inclusion of third-party CNV calls as an input signal can signifi-cantly lower FDR, both of which are examples of the flexibility and generality of our framework. To facilitate integration, each evidence type can be assigned a differ-ent weight reflecting the user’s prior expectations. As sequencing technologies and SV detection strategies evolve, new sources of evidence can be easily incorpo-rated without modifying the underlying logic of the SV detection algorithm itself; the sole requirement is the development of a new module that maps the SV detec-tion signal to a paired probability distribudetec-tion.
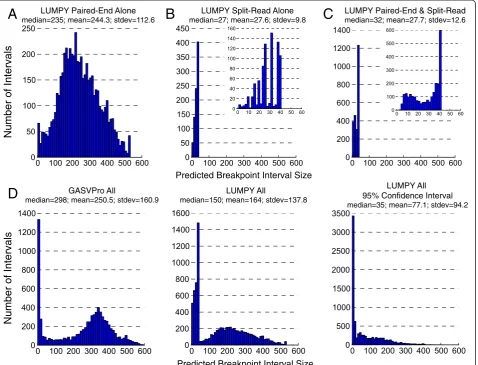
In addition to facilitating signal integration, our use of probability distributions should, in theory, enable more accurate prediction of breakpoint positions. In most cases, not all coordinates within a predicted breakpoint interval are equally likely to be the breakpoint based on input data, and LUMPY’s use of probability distributions allows this spatial uncertainty to be propagated through-out the SV detection process. Although a detailed analysis of the spatial resolution provided by each SV detection tool is complicated by the variable ways in which different tools report breakpoints, our data suggest that LUMPY is matching if not exceeding the resolution of other tools. LUMPY reported significantly smaller breakpoint intervals than GASVPro (Figure 8), and although DELLY and Pin-del report predictions at single base resolution, in order to achieve respectable validation rates it was necessary to
‘pad’these coordinates to a similar interval size as those reported by LUMPY (Materials and methods). The use of probability distributions also allows LUMPY to report breakpoints at different levels of precision; by default, LUMPY reports the entire interval predicted to contain each breakpoint, the 95% confidence interval, and the most likely single base position. This feature will enable more accurate functional annotation of SV predictions. Following SV detection, LUMPY can report the final inte-grated probability distribution for each predicted variant to allow for comparison across studies. Alternatively, the final breakpoint probability distributions from one study could potentially be used as a source of prior evidence in another.
How could LUMPY’s performance be further improved? First and foremost, native support for read-depth data as
an input signal should significantly improve performance at duplication and deletion variants. Here, we have incor-porated read-depth information by converting the output of a copy number segmentation tool to breakpoint prob-ability distributions, and providing these to LUMPY using the generic module (Figure 1A); however, we expect that more significant improvements will be possible using raw read-depth data. Second, for applications that require ultrasensitive detection of known structural variants such as low coverage population scale sequencing -LUMPY could be packaged with dataset priors reflecting the positions and allele frequencies of previously identified SVs. While we show that this is feasible using the existing LUMPY framework (Figure 5), we note that substantial improvements to sensitivity may require more compre-hensive and accurate SV catalogs than are currently avail-able. Third, LUMPY’s current evidence clustering logic is suboptimal for small insertion variants that are fully cap-tured within a single read. These insertions are a special case because proper clustering of split-read signals re-quires that the size of the insertion event - as defined by read coordinates rather than the reference genome coordi-nates - be taken into account during clustering. Although this weakness is predicted to have minimal impact using short-read data, improving LUMPY’s behavior on inser-tion variants is a high priority given increasing use of long-read data. Finally, a major challenge for SV detection is distinguishing bona fide variants from false positives caused by alignment artifacts and other sources of error. In this respect, breakpoint probability distributions pro-vide a highly quantitative source of information regarding the relative spacing of discordant and/or split alignments at a locus. By training on a set of known variants, it should be possible to derive a probabilistic measure of variant confidence that is based not only on the number of clus-tered reads, but also on the shape of the final integrated probability distribution. Alternatively, knowledge of the shape of ‘true’ breakpoint probability distributions could potentially be used as an objective function during read clustering.
In a more general sense, our approach for integrating SV detection signals - in essence, performing genome interval comparison operations using probability distribu-tions rather than‘flat’features - could be useful for any ap-plication that involves comparison of genomic features whose exact coordinates are unknown, and whose pos-itional uncertainty can be represented rationally in the form of a probability distribution. Rapid and efficient prob-abilistic comparisons could be enabled through extensions to existing interval-based software such as BEDTools [23].
Conclusions
integrates multiple SV detection signals during SV discov-ery. The benefits of this approach are clear from the super-additive effect of combining read-pair and split-read signals within the LUMPY framework, relative to using ei-ther signal alone (Figure 4C). In contrast, although oei-ther tools such as GASVPro [4], DELLY [3], CNVer [7], CREST [6] and Genome STRiP [5] also exploit multiple SV detection signals, to our knowledge they first use one signal (that is, read-pair) to drive discovery and then refine and/or genotype candidates with a second signal (that is, split-read or read-depth). An intrinsic limitation of stepwise
integration is that other available signals cannot increase the number of true positive SV calls beyond those candi-dates identified by the signal used for initial discovery. Consistent with this interpretation, inclusion of a second SV detection signal has little to no effect on DELLY’s or GASVPro’s sensitivity (Figure 4C) relative to using the primary read-pair signal alone.
Materials and methods
We propose a breakpoint prediction framework that can accommodate multiple classes of evidence from multiple
A
Predicted Breakpoint Interval Size
Number of Intervals
LUMPY Paired-End Alone
median=235; mean=244.3; stdev=112.6
LUMPY Split-Read Alone
median=27; mean=27.6; stdev=9.8
LUMPY Paired-End & Split-Read
median=32; mean=27.7; stdev=12.6
Number of Intervals
GASVPro All
median=298; mean=250.5; stdev=160.9 median=150; mean=164; stdev=137.8
LUMPY All LUMPY All
95% Confidence Interval
median=35; mean=77.1; stdev=94.2
Predicted Breakpoint Interval Size
D
[image:13.595.62.541.90.455.2]B
C
sources in the same analysis. Our framework makes use of an abstract breakpoint evidence type to define a set of functions that serve as an interface between specific evi-dence subtypes (for example, paired-end sequence align-ments and split-read mappings) and the breakpoint type. Any class of evidence for which these functions can be defined may be included in our framework. To demon-strate the applicability of this abstraction, we defined three breakpoint evidence subtypes: read-pair, split-read, and a general breakpoint interface.
Since our framework combines evidence from multiple classes, it extends naturally to include evidence from mul-tiple sources. The sources that can be considered in a sin-gle analysis may be any combination of evidence from different samples, different evidence subclasses from a sin-gle sample, or prior information about known variant po-sitions. We refer to a given set of data as a breakpoint evidence instance, and assume that each instance contains only one evidence subtype and is from a single sample. To help organize the results of analysis with multiple samples or multiple instances for a single sample, each instance is assigned an identifier that can be shared across instances.
Breakpoint
A breakpoint is a pair of genomic coordinates that are adjacent in a sample genome but not in a reference gen-ome. Breakpoints can be detected, and their locations predicted by various evidence classes such as paired-end sequence alignments or split-read mappings. To support the inclusion of different evidence classes into a single analysis, we define a high-level breakpoint type as a col-lection of the evidence that corroborates the location and variety (for example, deletion, tandem duplication, and so on) of a particular breakpoint. Since many evi-dence classes provide a range of possible breakpoint lo-cations, we represent the breakpoint’s location with a pair of breakpoint intervals where each interval has a start position, an end position, and a probability vector that represents the relative probability that a given pos-ition in the interval is one end of the breakpoint. More formally, a breakpoint is a tupleb=⟨E,l,r,v⟩, whereb.Eis the set of evidence that corroborates the location and variety of a particular breakpoint;b.landb.rare left and right breakpoint intervals each with valuesb.l.sandb.l.e
that are the start and end genomic coordinates andb.lp
is a probability vector where |b.l.p| =b.l.e–b.l.sandb.l. p[i] is the relative probability that positionb.l.s+iis one end of the breakpoint (similar for b.r); and b.v is the breakpoint variety. Within the context of this method, breakpoint variety determinations are based on the orientation of the evidence. It is important to note that while a breakpoint may be labeled as a deletion when it contains evidence from a paired-end sequence align-ment with a +/−orientation, the breakpoint may in fact
be the result of some other event or series of complex events.
If there exist two breakpointsb and c in the set of all breakpointsB whereb andcintersect (b.rintersects c.r,
b.lintersects c.l, andb.v=c.v), thenb and c are merged into interval m, b and c are removed from B, andm is placed into B. The evidence set m.E is the union of the evidence setsb.Eandc.E.
A straightforward method to define breakpoint inter-vals m.l and m.r would be to let m.l.s= max(b.l.s, c.l.s) and m.l.e= min(b.l.e, c.l.e), similar form.r. However, if a spurious alignment is merged into a set of genuine breakpoints, the resulting breakpoint interval can be
‘pulled’away from the actual breakpoint. The impact of an outlier can be minimized or eliminated once the full set of corroborating alignments is collected for a given breakpoint, but collecting the full set is complicated by the fact that alignments are considered in order and out-liers typically occur first. To account for this, we define a liberal merge process where m.l.s is the mean start position for the left intervals in m.E, and m.l.e is the mean end position for the left intervals in m.E, similar form.r.
Once all the evidence has been considered, an SV call
s(also a breakpoint) is made for each breakpointb ∈B
that meets a user-defined minimum evidence threshold (for example, four pieces of evidence). The boundaries of the breakpoint intervals s.l and s.r are the trimmed product of the distributions of the left and right inter-vals in b.E. Let s.l.s= max({e.l.s | e ∈ b.E}), s.l.e= min ({e.l.e |e ∈b.E}), and s.l.p[i] =∏e∈b.E e.l.p[i-o] where ois the offset valuee.l.s-s.l.s(similar fors.r). The intervalss.l
Breakpoint evidence
To combine distinct SV alignment signals such as read-pair and split-read alignments with the general breakpoint type defined above, we define an abstract breakpoint evi-dence type. This abstract type defines an interface that al-lows for the inclusion of any data that can provide the following functions: is_bp determines if a particular in-stance of the data contains evidence of a breakpoint; get_v determines the breakpoint variety (for example, deletion, tandem duplication, inversion, and so on); and get_bpi maps the data to a pair of breakpoint intervals.
To demonstrate the applicability of this abstraction, we defined three breakpoint evidence instances: paired-end sequencing alignments, split-read alignments, and a general breakpoint interface. Read-pair and split-read are the most frequently used evidence types for breakpoint detection, and the general interface provides a mechanism to include any other sources of information such as known variant positions or output from other analysis pipelines (for example, read-depth calls). As technologies evolve and our understanding of structural variation im-proves, other instances can be easily added.
Paired-end alignments
Paired-end sequencing involves fragmenting genomic DNA into roughly uniformly sized fragments, and se-quencing both ends of each fragment to produce paired-end reads ⟨x, y⟩, which we will refer to as ‘read-pairs’. Each read is aligned to a reference genomeR(x) =⟨c,o,s,e⟩,
where R(x).c is the chromosome thatx aligned to in the reference genome, R(x).o= +|−indicates the alignment orientation, and R(x).s and R(x).e delineate the start and end positions of the matching sequence within the chromosome. We assume that bothxandyalign uniquely to the reference and that R(x).s<R(x).e<R(y).s<R(y).e. While in practice it is not possible to know the position of read x in the sample genome (in the absence of whole-genome assembly), it is useful to refer toS(x) =⟨o,s,e⟩as the alignment ofxwith respect to the originating sample’s genome.
Assuming that genome sequencing was performed with the Illumina platform, read-pairs are expected to align to the reference genome with aR(x).o= +,R(y).o=− orienta-tion, and at distance R(y).e -R(x).s roughly equivalent to the fragment size from the sample preparation step. Any read-pair that aligns with an unexpected configuration can be evidence of a breakpoint. These unexpected con-figurations include matching orientationR(x).o=R(y).o, alignments with switched orientationR(x).o=−,R(y).o= +, and an apparent fragment length (R(y).e-R(x).s) that is ei-ther shorter or longer than expected. We estimated the expected fragment length to be the sample mean fragment lengthl, and the fragment length standard deviation to be the sample standard deviations from the set of properly
mapped read-pairs (as defined by the SAM specification) in the sample data set. Considering the variability in the sequencing process, we extend the expected fragment length to include sizesl+vls, wherevlis a tuning parameter that reflects spread in the data.
Whenxandyalign to the same chromosome (R(x).c = R(y).c), the breakpoint variety can be inferred from the orientation of R(x) and R(y). If the orientations match, then the breakpoint is labeled as an inversion, and ifR(x).
o=− and R(y).o= + then the breakpoint is labeled as a tandem duplication. Any breakpoint with the orientation
R(x).o= + andR(y).o=−is labeled as a deletion. Whenx
andyalign to different chromosomes (R(x).c≠R(y).c), the variety is labeled inter-chromosomal. At present, LUMPY does not explicitly support identification of insertions that are spanned by paired-end reads; however, if desired these can be identified in a post-processing step through as-sessment of ‘deletion’calls.
To map ⟨x, y⟩ to breakpoint intervals l and r, the ranges of possible breakpoint locations must be deter-mined and probabilities assigned to each position in those ranges. By convention, xmaps tolandyto r, and for the sake of brevity we will focus onxandlsince the same process applies toy and r. Assuming that a single breakpoint exists between x andy, then the orientation of x determines ifl will be upstream or downstream of
x. If the R(x).s= +, then the breakpoint interval begins after R(x).e (downstream), otherwise the interval ends beforeR(x).s(upstream).
The length of each breakpoint interval is proportional to the expected fragment lengthLand standard deviation
s. Since we assume that only one breakpoint exists between
xandy, and that it is unlikely that the distance between the ends of a pair in the sample genome (S(y).e - S(x).s) is greater thanL, then it is also unlikely that one end of the breakpoint is at a position greater thanR(x).s+L, assuming that R(x).o= +. If R(x).o=−, then it is unlikely that a breakpoint is at a position less than R(x).e - L. To ac-count for variability in the fragmentation process, we extend the breakpoint toR(x).e+ (L+vfs) whenR(x).o= +, andR(x).s- (L+vfs) whenR(x).o=−, wherevfis a tuning parameter that, likevl, reflects the spread in the data.
The probability that a particular position i in the breakpoint interval lis part of the actual breakpoint can be estimated by the probability that x and y span that position in the sample. For x and y to span i, the frag-ment that produced ⟨x, y⟩ must be longer than the dis-tance from the start of x to i, otherwise y would occur before i and x and y would not span i (contradiction). The resulting probability is P(S(y).e-S(x).s>i-R(x).s) if
D of fragment lengths from the same sample that was used to find L and s, where D(j) gives the proportion of the sample with fragment length greater thanj.
Split-read alignments
A split-read alignment is a single DNA fragment X that does not contiguously align to the reference genome. In-stead, X contains a set of two or more substringsxi…xj (X=x1x2…xn), where each substring aligns to the refer-ence R(xi) =⟨c, o, s, e⟩, and adjacent substrings align to non-adjacent locations in the reference genomeR(xi).e≠
R(xi+ 1).s+ 1 or R(xi).c≠R(xi+ 1).c for 1≤i≤n – 1. A single split-read alignment maps to a set of adjacent split-read sequence pairs (⟨x1, x2⟩,⟨x2, x3⟩,…,⟨xn-1,xn⟩), and each pair⟨xi,xi+ 1⟩is considered individually.
By definition, a split-read mapping is evidence of a breakpoint and therefore the function is_bp trivially returns true.
Both orientation and mapping location must be consid-ered to infer the breakpoint variety for ⟨xi, xi+ 1⟩. When the orientations match R(xi).o =R(xi+ 1).o, the event is marked as either a deletion or a tandem duplication. As-suming that R(xi).o=R(xi+ 1).o= +,R(xi).s<R(xi+ 1).s in-dicates a gap caused by a deletion and R(xi).s>R(xi+ 1).s indicates a tandem duplication. These observations are flipped when orientations R(xi).o=R(xi+ 1).o=−. When the orientations do not match R(xi).o≠R(xi+ 1).o, the event is marked as an inversion and the mapping locations
do not need to be considered. When x and y align to
different chromosomes, the variety is marked as inter-chromosomal. LUMPY does not currently attempt to identify insertions that are completely contained within a long read, but this will be supported in future versions. We note that this capability requires long-read aligners to report the number and order of alignments within a read (which is not formally supported in the current SAM for-mat specifications).
The possibility of errors in the sequencing and align-ment processes creates some ambiguity in the exact lo-cation of the breakpoint associated with a split-read alignment. To account for this, each alignment pair ⟨xi, xi+ 1⟩maps to two breakpoint intervals l andr cen-tered at the split. The probability vectors l.pand r.p are highest at the midpoint and decrease exponentially toward their edges. The size of this interval is a configurable parameter vs and is based on the quality of the sample under consideration and the specificity of the alignment algorithm used to map the sequences to the reference genome.
Depending on the breakpoint variety, the intervals l
andrare centered on either the start or the end ofR(xi) andR(xi+ 1). When the breakpoint is a deletionlis cen-tered at R(xi).e and rat R(xi+ 1).s, and when the break-point is a tandem duplication lis centered atR(xi).sand
rat R(xi+ 1).e. If the breakpoint is an inversion, land r are both centered either at the start positions or end po-sitions of R(xi) and R(xi+ 1), respectively. Assuming that
R(xi).s<R(xi+ 1).s, ifR(xi).o= + thenland rare centered at R(xi).e andR(xi+ 1).e, otherwise they are centered at
R(xi).s and R(xi+ 1).s. If R(xi).s>R(xi+ 1).s, then the conditions are swapped.
Generic evidence
The generic evidence subclass provides a mechanism to directly encode breakpoint intervals using the BEDPE format [17]. BEDPE is an extension of the popular BED format that provides a means to specify a pair of gen-omic coordinates; in this case the pair represents the two breakpoint positions in the reference genome. This subclass extends our framework to include SV signal types that do not yet have a specific subclass imple-mented. For example, the set of variants that are known to exist in the population can be included in the analysis of an individual or variants that are known to exist in a particular type of cancer can be included in the analysis of a tumor. This signal can be included in the analysis by expanding the edges of the predicted intervals to cre-ate breakpoint intervals, and encoding these intervals in BEDPE format. Each BEDPE entry is assumed to be a real breakpoint (is_bp), the variety is encoded in the auxiliary fields in BEDPE (get_v), and the intervals are directly encoded in BEDPE (get_bpi).
Performance comparisons
Both simulated and real datasets were used to compare the sensitivity and FDR of LUMPY to other SV detection algorithms (GASVPro, DELLY, and Pindel). Two types of simulations were performed: one in which homozy-gous variants of diverse varieties were introduced at ran-dom positions throughout the reference genome, and another in which a heterogeneous tumor sample was simulated by mixing reads from a modified ‘abnormal’ human reference genome (containing 1000 Genomes de-letions) and an unmodified ‘normal’ human reference genome in varying proportions. We also used publicly available Illumina sequencing data of the NA12878, NA12891, and NA12892 individuals. Two scenarios were considered: the original 50X coverage files, and 5X sub-samples of the original data sets.
Although we note that the true variant variety in this case is actually an insertion, the inserted segment exceeds the insert size of the sequencing library as well as the read length, and thus the breakpoints formed by such inser-tions accurately simulate a translocation. Each simu-lated genome was sampled to 40X, 20X, 10X, 5X, and 2X coverage.
To simulate a heterogeneous tumor sample, we com-bined simulated reads from both a modified and unmodi-fied version of the human reference genome (build 37). The modified genome was created using SVsim, and in-cluded 5,516 non-overlapping deletions identified by the 1000 Genomes Project. Each simulation combined reads from both the modified and unmodified genomes in vary-ing proportions. We refer to the proportion of reads that were derived from the modified genome as the SV allele frequency. The simulated SV allele frequencies were 5%, 10%, 20% and 50%, and the simulated coverages were 10X, 20X, 40X, and 80X. For example, in the simulation with 5% SV allele frequency and 10X coverage, the modified genome was sampled at 0.5X coverage and the unmodified genome was sampled at 9.5X coverage. The two sets of reads are then pooled into a single 10X coverage sample.
For all simulations, WGSIM was used to sample paired-end reads with a 150 bp read length, a 500 bp mean outer distance with a 50 bp standard deviation, and default error rate settings. Paired-end reads were mapped to the refer-ence genome with NOVOALIGN version V2.07.08, using the random repeat reporting and allowing only one align-ment per read. From the NOVOALIGN output, all soft-clipped (≥20 bp clipped length) and unmapped reads were realigned with the split-read aligner YAHA using a word length of 11 and a minimum match of 15. The NOVOA-LIGN output was used as input to DELLY, GASVPro, and Pindel, and both NOVOALIGN and YAHA output were used as input to LUMPY. In all algorithms, the minimum evidence threshold was four. For LUMPY, the tuning parameters min_non_overlap was set to 150, discor-dant_z was set to 4, back_distance was set to 20, weight was set to 1, and min_mapping_threshold was set to 1. For GASVPro, LIBRARY_SEPARATED was set to all, CUTOFF_LMINLMAX was set to SD = 4, WRITE_ CONCORDANT was set to true, and WRITE_LOWQ was set to true. For DELLY, map-qual was set to 1, and the inc-map flag was set. DELLY paired-end (pe) and split-read (sr) calls were combined into a single paired-end and split-read (pe + sr) callset by taking the union of the two sets where the split-read call was retained when a call was common to both sets. For Pindel, mini-mum_support_for_event was set to 4, all chromosomes were considered, and report_interchromosomal_events was set to true. Since the output of DELLY and Pindel are single-base-resolution intervals, we increased the size of those intervals to match the mean interval size of
a similar LUMPY call. Any call that had split-read sup-port (Pindel and DELLY sr calls) was expanded to a 28 bp interval, and any call that had only paired-end support (DELLY pe calls) was expanded to a 282 bp interval. The intervals for GASVPro were not modified since, like LUMPY, it reports an interval whose size is based on the supporting evidence.
For the real data, LUMPY, GASVPro, DELLY, and Pindel considered Illumina sequencing of the NA12878 individ-ual. The original sequencing files were at 50X coverage and were used in the 50X experiments. The 5X experi-ments considered sequencing files that were created by subsamples 10% of the original paired-end alignments. For all the tools, only deletion predictions on chromosomes 1 though X were considered. All sequencing samples were retrieved from the European Nucleotide Archives (sub-mission ERA172924), and were previously aligned using BWA. Soft-clipped (≥20 bp clipped length) and unmapped reads were realigned with the split-read aligner YAHA using a word length of 11 and a minimum match of 15. In addition to the NA12878 data, the LUMPY trio results also considered sequencing data from that individual’s parents, NA12891 and NA12892. The LUMPY prior re-sult considered all 1000 Genomes variant calls using the generic evidence module. The LUMPY read-depth results considered all deletion calls made by CNVnator [13] for the NA12878 genome with a window size of 100 for the 50X coverage experiment and 1,000 for the 5X coverage experiment. The single-base-resolution regions predicted by CNVnator were extended upstream and downstream by one-half the window size before being considered by LUMPY. Each tool was run with the same options that were used in the simulation experiments, except the mini-mum mapping quality for LUMPY, GASVPro, and Pindel was increased to 10. Since Pindel uses paired-end reads differently than the other tools, the default mapping qual-ity of 20 was used. Each call required support of at least four. In the LUMPY trio result, a call had to have support of four from at least one individual (NA12878, NA12891, or NA12892) and at least one piece of support from NA12878. The weight for the 1000 Genomes variant calls in the LUMPY prior result was set to 2. In the LUMPY depth result, a call had to have support from read-depth and paired-end or split-read.
(for example, deletion) match. To account for varied spatial resolution among the tools, we pad the simulated breakpoint coordinates with 50 bp of bidirectional slop, such that each simulated variant is represented by two 100 bp breakpoint intervals.
The second truth set consisted of the 4,095 deletions called by at least one tool in the 50X dataset or by the 1000 Genomes Project [12], and that were also validated by long-read sequencing from PacBio or Illumina Moleculo data. Overlapping calls were merged by retaining the mini-mum shared interval. PacBio reads (median length, 880 bp; mean depth, 30X) were aligned to GRCh37 using BWA Smith-Waterman (bwa bwasw -b 5 -q 2 -r 1 -z 20 -w 500). Illumina Moleculo reads (median length, 3,012 bp; mean depth, 30X) were aligned to GRCh37 with BWA-MEM (bwa mem -t 1 -B 4 -O 6 -E 1 -M). These BAM files are available from the 1000 Genomes Project repository at [24,25], respectively.
Deletion calls were considered to be validated if sup-ported by at least two non-duplicate PacBio split reads or at least one Moleculo split read. A supporting long-read is defined by the following criteria: 1) the long-read is split by the aligner such that at least 20 bp aligned to the flank-ing sequence on either side of the reported breakpoint; 2) the left and right intervals of the split long-read both intersect with the respective left and right intervals of re-ported breakpoint, allowing 5 bp of slop space on either side of the long-read breakpoint to account for microho-mology or inserted sequence at the novel adjacency; 3) the strand orientation of the split long-read is consistent with the strand orientation at the reported breakpoint; 4) in the case of PacBio, where at least two non-duplicate long-reads are required to validate a call, the two long-long-reads must not only fill criteria 1 to 3, but must also overlap with each other within 5 bp of slop on either side.
We performed Monte Carlo shuffling of the callsets to estimate the number of spurious long-read validations due to random chance. We shuffled each callset 100 times using BEDTools shuffle while retaining identical interval sizes, variant spans, and number of variants for each iter-ation [23]. Regions of the genome that were excluded from the original analyses were also excluded from the shuffling (see‘Excluded regions’section below). We then performed long-read validation as described above to each shuffled callset, with less than 3% of shuffled calls validat-ing (Table 1).
Excluded regions
For structural variation detection with LUMPY and other tools, we excluded regions of the reference genome with consistently high sequencing depth over multiple individ-uals, since high depth is indicative of artifacts in the refer-ence assembly. To define these regions, we first aligned the 17-member CEPH 1463 pedigree to the GRCh37
human reference genome using BWA-MEM 0.7.5a-r405 (bwa mem -t 32 -M -p) [26]. Each member of the pedigree was whole-genome sequenced from a PCR-free library to 50X coverage with 101 bp reads, and is publicly available through the Illumina Platinum Genomes project [27]. We used BEDTools v2.17.0 to generate a BED graph of aggre-gate per-base coverage from all 17 individuals [23]. The mode and standard deviation of the aggregate depth were calculated separately for the autosomes and sex chromo-somes. Any regions with depth exceeding 2 * mode + 3 standard deviations were excluded from our analyses. (We chose to double the mode to allow inclusion of duplicated copy number variant regions.) Finally, the mitochondrial chromosome was excluded entirely. A BED graph of the excluded regions can be obtained at [28].
Additional files
Additional file 1:This file contains the breakpoints used for the
homozygous variant simulation.The format is BEDPE. Each line has a
‘TYPE:’field that indicates DELETION, DUPLICATION, INVERSION, or TRANSLOCATION.
Additional file 2:This file contains the breakpoints used for the
heterogeneous tumor simulation.The format is BEDPE. These deletions
are based on the variants released by the 1000 Genomes Project in [29]. We selected non-overlapping deletions that were at least 50 bases long and successfully lifted over from build 36 of the human reference genome to build 37.
Additional file 3:This file contains the breakpoints used for the
Millset al. truth set.The format is BEDPE, which is described by [30].
The breakpoints are the non-overlapping validated deletions observed in NA12878 and are based on the variants given in [31].
Additional file 4:This file contains the breakpoint intervals for the deletion predictions that were made by LUMPY (pe + sr, trio, prior, pe + sr&rd), GASVPro, DELLY, Pindel, or the 1000 Genomes Project [12] and that were validated by long read alignments from PacBio
and/or Illumina Moleculo sequencing.The format is BEDPE, and the
score field indicates the number of overlapping predictions. Note: in some cases one algorithm made two predictions that contributed to a single call. For example, there are two calls with a score of 8. In both cases Pindel contributed two very similar calls.
Additional file 5:This file contains the calls made by LUMPY for NA12878 with paired-end and split-read evidence that were also
validated with PacBio/Moleculo data.The format is BEDPE and the
score field is the total amount of supporting evidence. This file contains extra fields that are described at [16].
Abbreviations
bp:base pair; CNV: copy number variation; FDR: false discovery rate; PacBio: Pacific Biosciences; PCR: polymerase chain reaction; SNP: single nucleotide polymorphism; SV: structural variation.
Competing interests
The authors declare that they have no competing interests.
Authors’contributions