M E T H O D
Open Access
NicE-seq: high resolution open chromatin
profiling
V. K. Chaithanya Ponnaluri
1†, Guoqiang Zhang
1†, Pierre-Olivier Estève
1, George Spracklin
1, Stephanie Sian
2,
Shuang-yong Xu
1, Touati Benoukraf
2and Sriharsa Pradhan
1*Abstract
Open chromatin profiling integrates information across diverse regulatory elements to reveal the transcriptionally active genome. Tn5 transposase and DNase I sequencing-based methods prefer native or high cell numbers. Here, we describe NicE-seq (nicking enzyme assisted sequencing) for high-resolution open chromatin profiling on both native and formaldehyde-fixed cells. NicE-seq captures and reveals open chromatin sites (OCSs) and transcription factor occupancy at single nucleotide resolution, coincident with DNase hypersensitive and ATAC-seq sites at a low sequencing burden. OCSs correlate with RNA polymerase II occupancy and active chromatin marks, while
displaying a contrasting pattern to CpG methylation. Decitabine-mediated hypomethylation of HCT116 displays higher numbers of OCSs.
Keywords:Open chromatin, NicE-seq, Transcription factor occupancy, DNA methylation
Background
The mammalian genome is largely packaged into chro-matin consisting primarily of DNA, proteins, and RNA. This macromolecular structure is further condensed into larger folded structures, such as chromosomes, during cell division. The cell cycle phase and the transcriptional status of the cell influences the state of the chromatin. It often undergoes remodeling events for switching be-tween closed and open conformations to provide acces-sibility to DNA-binding proteins, including transcription factors [1–3]. In addition to core histones, chromatin contains a wide variety of non-histone chromosomal proteins involved in various activities, including DNA replication and gene expression [4, 5].
A series of genome-wide methods and approaches for mapping chromatin accessibility (open chromatin), nucleosome positioning, transcription factor occu-pancy, and other chromosomal protein binding have been established to decipher the epigenetic informa-tion encoded in the chromatin [6–14]. Early studies identified nucleosome-depleted regions as being hypersen-sitive to DNase I and point to the association of these
protein-depleted regions with gene activation in eukaryotic organisms [15–18]. Although DNase I-based sequencing (DNase-seq) is a powerful method on its own, it requires specific reagents and vast amounts of cells. Mapping of open chromatin by DNase-seq requires between one and ten million cells and often involves titration of enzyme and multiple steps before the library is made for sequencing. DNase-seq employs the prefer-ential digestion of nucleosome- and transcription factor-depleted sites using DNase I and it identifies DNase I hypersensitivity sites (DHSs) by sequencing [16, 17]. In another method, transcription factor binding sites are interrogated using chromatin-immunoprecipitation (ChIP) sequencing technology [19]. The major drawback of this method is antibody availability and specificity. Recently, DHS mapping has been conducted using an improved protocol, which includes the addition of circular carrier DNA, single cell DNase I seq (scDNase I-seq), requiring an input of between one and 1000 cells. This technology revealed highly expressed genic regions with multiple active histone marks displaying constitutive DNase I hypersensitive sites among different single cell analysis data. However, in scDNase I-seq the mappability of 1000 cells to the reference genome was 40%, and 2% at the single cell level [20].
* Correspondence:[email protected] †Equal contributors
1New England Biolabs Inc., 240 County Road, Ipswich, MA 01938, USA Full list of author information is available at the end of the article
Two other well-adapted methods for the identification of open chromatin and regulatory sites across the gen-ome are FAIRE-seq (formaldehyde assisted isolation of regulatory element sequencing) and ATAC-seq (assay for transposase-accessible chromatin using sequencing) [21–23]. FAIRE-seq enriches the nucleosome-depleted DNA using formaldehyde fixation, sonication, and phe-nol/chloroform extraction of the non-protein-bound DNA. ATAC-seq uses a hyperactive Tn5 transposase which preferentially integrates its payload adaptor into accessible chromatin regions compared to less access-ible, compact chromatin. Indeed, ATAC-seq maps of hu-man CD4+ T cells from a proband on consecutive days demonstrated the feasibility of analyzing an individual’s epigenome on a timescale that is compatible with clin-ical decision-making [23]. However, ATAC-seq also gen-erates non-specific amplification of non-nuclear DNA, such as the mitochondrial genome, accounting for ~50% of all reads. Both DNase-seq and FAIRE-seq can be ap-plied to fixed cells but ATAC-seq works best on unfixed cell nuclei. The lack of a common metholodology for chromatin occupancy mapping in both unfixed (living) and fixed cells is a limitation of existing techniques.
Here we report a robust and sensitive method, nicking enzyme assisted sequencing (NicE-seq), for epigenetic profiling of the mammalian chromatin that can provide in-depth open versus closed chromatin sequence infor-mation from limited amounts of either native or fixed cells. We used NicE-seq to identify regions of transcrip-tion factor occupancy and compared these to DHSs identified by DNAse-seq and ATAC-seq identified sites. Finally, we studied the dynamic open chromatin sites (OCSs) of human colorectal cancer HCT116 cells before and after chemotherapeutic treatment with the DNA demethylating drug decitabine.
Results
Nicking enzyme-mediated tagging of the open chromatin
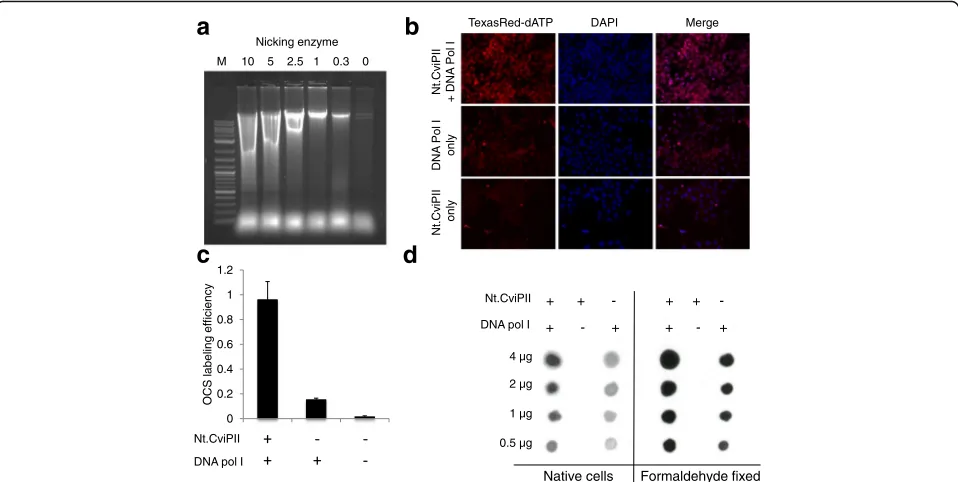
We isolated nuclei from colorectal cancer HCT116 cells and incubated the sample with the nicking enzyme Nt.CviPII, which nicks human genomic DNA with se-quence specificity CCD (D = A/G/T). We hypothesized that Nt.CviPII would be able to travel across the nuclear membrane and nick open chromatin regions inside the nucleus. We used formaldehyde-fixed cell nuclei in buf-fer containing various concentrations of Nt.CviPII for a fixed time, extracted DNA, and analyzed the product on a 1% agarose gel. When sufficient enzyme was added, high molecular weight genomic DNA was digested and nucleosome banding patterns were observed, confirming the activity of Nt.CviPII on chromatin inside the nu-cleus. To avoid false positives in open chromatin nicking and to facilitate random and optimal nicking by the en-zyme, we chose a median concentration of 2.5 unit of
Nt.CviPII/μg of chromatin for all downstream experi-ments (Fig. 1a). The nicked open chromatin regions in fixed HeLa cells were filled-in using Escherichia coli DNA polymerase I plus dNTP mix supplemented with TexasRed-dATP to demonstrate the labeling of OCSs. The cells were scored for TexasRed-dATP incorporation and compared to DAPI for open chromatin index (OCI) measurement. Indeed, the cells without Nt.CviPII andE. coli DNA polymerase I (control) displayed no TexasRed signal (Fig. 1b, c), although a small amount of signal was observed when E. coli DNA polymerase I was used alone, suggesting endogenous nicks were present in the nucleus (Fig. 1b, c). In the open chromatin sequencing experiment, we used biotin-14-dATP and biotin-16-dCTP to generate biotin-tagged open chromatin regions. To validate incorporation of biotin in the chromatin, DNA was extracted, dot blotted, and probed with anti-biotin antibody (Fig. 1d). Thus, both native chromatin and formaldehyde-fixed chromatin were efficiently la-beled with biotin and the labeling reaction could be visu-alized in the nucleus, suggesting that the nicking enzyme and E. coli DNA polymerase I were able to ac-cess the open chromatin.
Open chromatin mapping with 250 cells
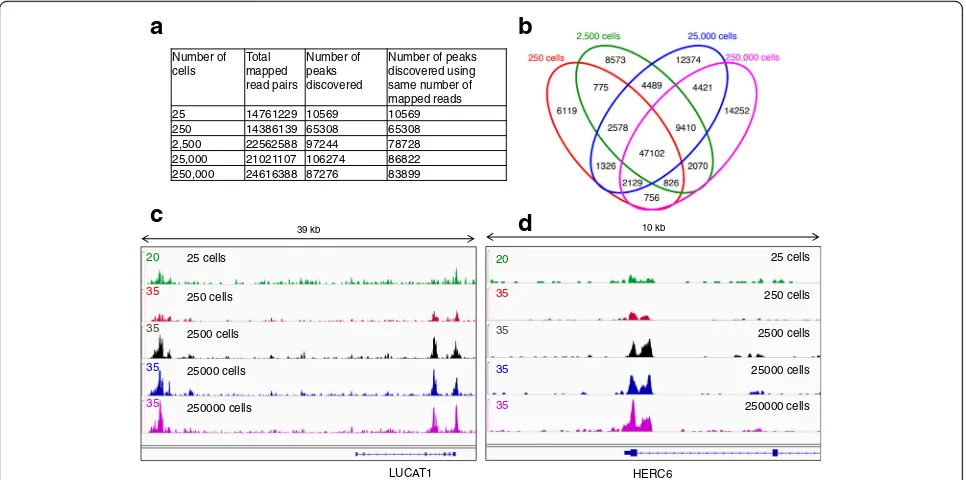
between number of nicking sites and sequence tags in the open chromatin peaks (Additional file 1: Figure S3b). These results suggest that the frequency of nicking sites has no bearing on open chromatin enrichment, but that the accessibility of the open chromatin to the nicking enzyme is the major determinant of tag reads (Add-itional file 1: Figure S3). Therefore, we termed the iden-tified sequences/peaks as open chromatin sites (OCSs). We further visualized the OCSs between 25 and 25,000 cells using selected genic regions and observed consist-ent overlap in enrichmconsist-ent of sequence tags/peaks as seen in 39- and 10-kb windows (Fig. 2c, d), confirming the versatility of NicE-seq.
NicE-seq identifies unique and divergent peaks on native or fixed chromatin
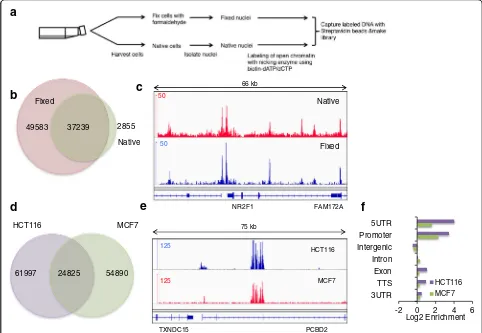
To determine if the open chromatin configurations are preserved between native and formaldehyde-fixed cells, we performed NicE-seq of both HCT116 fixed and na-tive cells (Fig. 3a). To our surprise the nana-tive cell chro-matin samples displayed half the number of OCSs compared to the fixed cells (Fig. 3b). Most of the open chromatin peaks in native cells were a subset of those in fixed cells, suggesting native cell chromatin structure is
dynamic and may prevent efficient incorporation of bio-tinylated dNTP (Fig. 3b, c). However, a comparison of the sequence read peaks from both confirmed that some peaks or OCSs were indeed relatively static and common, while others were dynamic (Fig. 3c; Additional file 1: Figure S4).
We also performed NicE-seq on MCF7 (breast carcin-oma) cells and obtained 79,000 OCSs, compared to 87,000 for HCT116 cells. Further comparison between the OCSs of MCF7 and HCT116 cells showed an over-lap of 24,000 peaks, suggesting the presence of both common and unique OCSs specific to the two cell types (Fig. 3d). A genome browser track also demonstrated both constitutive as well as unique OCSs in MCF7 cells (Fig. 3e; Additional file 1: Figure S5).
NicE-seq and distribution of open chromatin marks in human cells
To further our understanding of the distribution of open chromatin in the genome, we annotated the genomic features of open chromatin regions identified by NicE-seq. The open chromatin peaks were mostly concen-trated at gene promoters, specifically transcription start sites. In the genic region both introns and coding exons
M
Nicking enzyme
a
b
c
d
Nt.Cv
iPII
+ DNA
Pol
I
DNA
Pol I
only
Nt.Cv
iPII
only
TexasRed-dATP DAPI Merge
0 0.2 0.4 0.6 0.8 1 1.2
y
c
n
ei
cif
f
e
g
nil
e
b
al
S
C
O
Nt.CviPII DNA pol I
+ + - + +
-+ - + + - +
Nt.CviPII DNA pol I
Native cells Formaldehyde fixed
4 µg 2 µg 1 µg 0.5 µg 10 5 2.5 1 0.3 0
Fig. 1Nicking enzyme-mediated labeling of open chromatin.aNicking of crosslinked chromatin using varying amounts of Nt.CviPII. A 1% a
[image:3.595.59.538.88.329.2]displayed varying degrees of open chromatin status (Fig. 3f ).
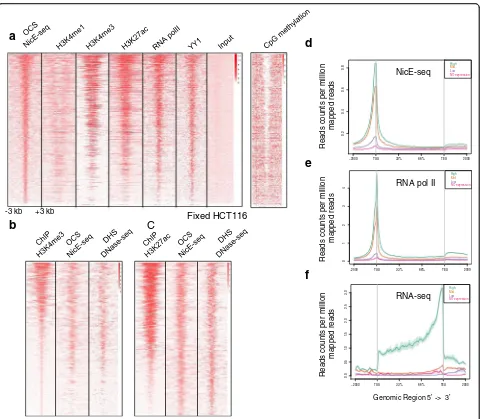
ENCODE datasets for various active chromatin marks and DNA-binding protein factors were investigated using OCSs identified by NicE-seq for further validation of the technique. We determined the distribution of tag densities for various ChIP-seq experiments (H3K4me1, H3K4me3, H3K27ac, RNA pol II, and YY1) in a ±3-kb window around the OCSs identified by NicE-seq and generated heat maps. NicE-seq heat maps positively cor-related with RNA pol II binding, suggesting that most of the OCSs may be transcriptionally active. Furthermore, the signature transcriptional activation marks H3K27ac and H3K4me3 displayed strong enrichment around OCSs in the heat map. Also, H3K4me1, which is mainly enriched in the enhancer regions, was more depleted at the OCS peaks and showed a bimodal distribution around OCSs (Fig. 4a). Interestingly, YY1, a ubiquitously distributed transcription factor belonging to the GLI-Kruppel class of zinc finger protein that is involved in repression and activation of a diverse number of pro-moters, displayed a pattern similar to that defined by NicE-seq. As expected, the heat map for CpG methyla-tion status inversely mirrored the NicE-seq open chro-matin configuration (Fig. 4a). This provides strong evidence for validating OCSs identified by NicE-seq as truly open and being actively transcribed. We also looked for enrichment of ChIP-seq peaks for H3K4me3
and H3K27ac in both NicE-seq and DNase-seq experi-ments and observed strong correlation. This clearly demonstrates that transcriptionally active histone marks are correlated with open chromatin regions (Fig. 4b, c).
Open chromatin and transcription
Transcription of mammalian genes is regulated by pro-moter elements and transcription factors. Transcription start sites (TSS) are speculated to be devoid of nucleo-somes for transcription factor accessibility and have characteristic histone marks. NicE-seq tags were highly enriched at the TSS region of genes in HCT116 cells (Fig. 4d). We analyzed the ENCODE data set for MNase-seq and observed nucleosome depletion at the TSS corresponding to the open chromatin (Additional file 1: Figure S6a). Correlating with the open chromatin and lack of nucleosomes, this region also displayed high occupancy of RNA pol II, suggesting transcriptional acti-vation (Fig. 4e). Indeed, the transcriptional actiacti-vation marks H3K4me3 and H3K27ac are partially depleted at TSSs, due to a lack of nucleosomes, but are highly occu-pied at both distal and proximal ends (Additional file 1: Figure S6b, c). However, H3K4me1 was highly depleted at TSSs and was prominent at upstream enhancer and downstream regions (Additional file 1: Figure S6d). Further analysis of TSSs using NicE-seq data suggested that the rate of gene expression mirrored the degree of open chromatin conformation, i.e., more highly
Number of cells
Total mapped read pairs
Number of peaks discovered
Number of peaks discovered using same number of mapped reads 25 14761229 10569 10569 250 14386139 65308 65308 2,500 22562588 97244 78728 25,000 21021107 106274 86822 250,000 24616388 87276 83899
a
b
c
d
250 cells 2500 cells 25000 cells 250000 cells 25 cells
39 kb
35
35
35
35
20
LUCAT1
250 cells 2500 cells 25000 cells 250000 cells 25 cells
10 kb
HERC6
35
35
35
35
20
Fig. 2NicE-seq using 25–250,000 cells for open chromatin profiling.aThe number of total mapped reads and the number of peaks identified
[image:4.595.57.540.88.328.2]expressed genes contain highly open chromatin at the TSS and this is occupied by RNA pol II (Fig. 4e, f; Additional file 1: Figure S7). Highly open chromatin with RNA pol II occupancy displayed a high degree of RNA transcription.
NicE-seq and DNase-seq identify an overlapping as well as unique set of open chromatin sites in human cells
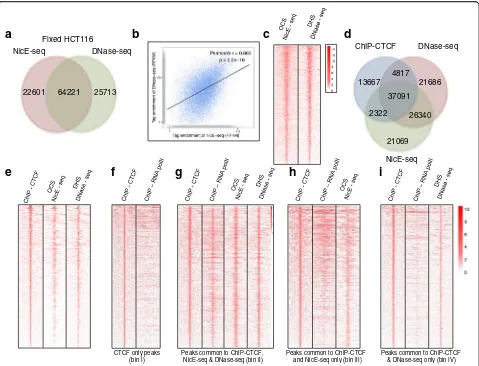
DNase-seq and NicE-seq identify regions of chromatin devoid of nucleosomes and other DNA-binding proteins. To quantify the level of overlap between these assays, we identified the peaks common to both techniques. ENCODE data for DNase-seq analysis of HCT116 cells was used to call peaks as described in “Methods”. Among 86,000 and 90,000 peaks identified by both NicE-seq and DNase-seq, respectively, 75% overlapped and ~25% were unique (Fig. 5a). Comparison of genome browser track profiles for OCSs and DHSs from both NicE-seq and DNase-seq also displayed common peaks
(Additional file 1: Figure S8a). We considered the over-lapping sites from both DNase-seq and NicE-seq experi-ments to represent high confidence open chromatin sites. The Pearson’s correlation coefficient for the tag density of common peaks between DNase-seq and NicE-seq was found to be 0.66 with a highly significantpvalue of 2.2e−16. This suggested a high level of correlation be-tween the two methods (Fig. 5b). Furthermore, a heat map showing the distribution of tag densities for DNase-seq and NicE-DNase-seq in a ±3-kb window around the com-mon peaks displayed similar enrichment patterns (Fig. 5c). Annotation of peaks unique to either NicE-seq or DNase-seq and common both showed similar enrich-ment across different genomic regions (Additional file 1: Figure S8b). Furthermore, using NicE-seq and ENCODE DNase-seq data for the MCF7 cell line, we identified 79,000 and 133,000 peaks for NicE-seq and DNase-seq, respectively (Additional file 1: Figure S9a). Of these, 43,000 peaks overlapped with a Pearson’s correlation
a
b
c
d
e
f
37239 2855 49583
Fixed
Native
24825
61997 54890
HCT116 MCF7
-2 0 2 4 6
3UTR TTS Exon Intron Intergenic Promoter 5UTR
Log2 Enrichment
HCT116
MCF7
Native
Fixed
FAM172A NR2F1
50
50
66 kb
HCT116
MCF7 125
125
75 kb
PCBD2 TXNDC15
Fig. 3NicE-seq and validation of NicE-seq in fixed and native cells.aThe different steps involved in labeling and capture of open chromatin sites
using NicE-seq.bA Venn diagram showing the overlap between the OCSs identified using fixed and native HCT116 cells.cA screenshot of the IGV browser showing the overlap between OCSs identified in native (top panelinred) and fixed (bottom panelinblue) HCT116 cells in a 66-kb window.dA Venn diagram showing overlap between OCSs identified from HCT116 and MCF7 cell lines.eSnapshot of IGV browser showing overlap of OCS peaks (top panelinbluefor HCT116 andbottom panelinredfor MCF7) in a 75-kb window.fThe log2fold change of OCS peaks in
[image:5.595.56.538.89.422.2]coefficient of 0.746 (p< 2.2 e−16), exhibiting strong cor-relation between OCSs and DHSs as seen in the heat-map (Additional file 1: Figure S9b, c). The broader dynamic range of DNase-seq may be due to non-specific nicking of the genome compared to sequence-specific nicking mediated by the nicking enzyme Nt.CviPII (Additional file 1: Figure S9b).
To correlate the transcriptional status, we analyzed the distribution of the active chromatin marks H3K4me3 and H3K27ac in peaks common to NicE-seq and seq, unique to NicE-seq, and unique to DNase-seq. Indeed, common peaks displayed high enrichment of H3K4me3 and H3K27ac marks corresponding to transcriptional activation (Additional file 1: Figure S10a).
-3 kb +3 kb
Fixed HCT116
0.
2
0
.4
0
.60
.8
−2000 TSS 33% 66% TES 2000 High Mid Low NO expression
Reads
c
o
unts per
m
illion
m
a
pped r
e
ads
0
1234
−2000 TSS 33% 66% TES 2000 High Mid Low NO expression
0
.0
0
.5
1
.01
.5
2.0
2
.5
3.
0
−2000 TSS 33% 66% TES 2000 High Mid Low NO expression
Reads
c
o
unts per
m
illion
m
a
pped r
e
ads
Reads c
o
unts per
m
illi
o
n
m
a
pped r
e
ads
NicE-seq
RNA pol II
RNA-seq
a
b
C
d
e
f
Genomic Region 5’ -> 3’
Fig. 4Validation of open chromatin sites identified by NicE-seq.aA heat map showing the correlation of NicE-seq peaks in a ±3-kb window with
[image:6.595.59.539.85.504.2]A similar enrichment profile for H3K4me3 was ob-served for unique NicE-seq peaks. However, H3K27ac levels remained consistent with unique NicE-seq peaks compared to slightly elevated enrichment of DNase-seq peaks (Additional file 1: Figure S10b, c), suggesting differential identification of open chroma-tin marks using these enzymes. Also, the mean FPKM value for peaks unique to DNase-seq was lower compared to peaks unique to NicE-seq and peaks common to both NicE-seq and DNase-seq (Additional file 1: Figure S10d).
NicE-seq offers higher specificity for OCSs compared to DHSs from DNase-seq in human cells
CTCF binds strands of DNA together to form chromatin loops, and also anchors DNA to nuclear lamina. It de-fines the boundaries between active and heterochromatic DNA and is shown to be a gene repressor. CTCF recog-nizes and binds the CCCTC sequence motif in DNA, which is a subset of the trinucleotide CCD recognition sequence of Nt-CviPII. We hypothesized that any open chromatin region containing a CTCF binding site will be specifically targeted by Nt-CviPII and will be displayed
a
b
c
64221
22601 25713
NicE-seq DNase-seq Fixed HCT116
37091
26340
21069 21686 13667
2322 4817
DNase-seq ChIP-CTCF
NicE-seq
d
CTCF only peaks (bin I)
Peaks common to ChIP-CTCF, NicE-seq & DNase-seq (bin II)
Peaks common to ChIP-CTCF and NicE-seq only (bin III)
Peaks common to ChIP-CTCF & DNase-seq only (bin IV)
e
f
g
h
i
Fig. 5Comparison of OCSs and DHSs in HCT116 cells and correlation of CTCF binding with open chromatin regions.aVenn diagram showing the
[image:7.595.59.538.87.453.2]positively in NicE-seq. To investigate the relationship between CTCF-bound regions and chromatin accessibil-ity, we examined the distribution of peaks between NicE-seq, DNase-seq, and ChIP-CTCF experiments. Interestingly, 64% of ChIP-CTCF peaks were common to all three experiments, suggesting that these regions could in fact be open. Further, 68 and 72.3% of ChIP-CTCF peaks were associated with NicE-seq OCSs and DNase-seq DHSs, respectively (Fig. 5d). Also, we identi-fied CTCF-bound peaks unique to OCSs and DHSs to comprise 4 and 8% of the total ChIP-CTCF peaks, respectively (Fig. 5d). Similar results were obtained for two other transcription factors, Max and Sp1 (Additional file 1: Figures S11 and S12).
CTCF has been shown to promote gene expression and CTCF-bound OCSs/DHSs may belong to the class of genes that are transcriptionally active. To further elu-cidate the transcriptional status of ChIP-CTCF peaks in the context of OCSs and DHSs, we analyzed the distri-bution of CTCF peaks in the RNA pol II ENCODE data set by binning the peaks four ways. Peaks in bin I (24% of total ChIP-CTCF peaks) were unique to CTCF and showed no enrichment for RNA pol II occupancy, sug-gesting binding of CTCF is associated with intergenic or closed chromatin status (Fig. 5f ). We further binned the remaining 76% of ChIP-CTCF peaks into those common to ChIP-CTCF, NicE-seq, and DNase-seq (bin II), com-mon to ChIP-CTCF and NicE-seq (bin III), and comcom-mon to ChIP-CTCF and DNase-seq (bin IV) and analyzed RNA pol II occupancy. As expected, peaks from bin II displayed a strong correlation with RNA pol II occu-pancy (Fig. 5g). However, peaks from bin III (Fig. 5h) displayed a higher correlation with RNA pol II occu-pancy than those in bin IV (Fig. 5i), suggesting differen-tial transcriptional status.
For validation of transcriptional status, we analyzed the distribution of the active chromatin marks H3K4me3 and H3K27ac in peaks common to ChIP, NicE-seq, and DNase-seq (bin II), peaks common to ChIP and NicE-seq (bin III), and peaks common to ChIP and DNase-seq (bin IV). Indeed, peaks from bin II dis-played high enrichment of H3K4me3 and H3K27ac marks, corresponding to transcriptional activation (Additional file 1: Figure S13a). A similar enrichment profile was observed for bin III, but not for bin IV (Additional file 1: Figure S13b, c). This was also evi-dent in ChIP fragment depth analysis. When common OCS and DHS sequences were extracted and plotted with ChIP-seq H3K4me3 and H3K27ac reads, about a quarter of peaks from the heat map were devoid of H3K4me3 or H3K27ac, suggesting the possibility of other open chromatin marks that are yet to be dis-covered or open chromatin regions that are structural to the nuclear genome.
Based on the lack of enrichment for H3K4me3 and H3K27ac marks, we believe that peaks in bin IV are not truly open. However, strong enrichment was ob-served in DNase-seq for these peaks (Additional file 1: Figure S13c). Peaks in bin IV amount to 12% of all the DHS peaks associated with CTCF bound peaks. However, OCSs identified by NicE-seq and bound by CTCF are truly open, as evidenced by enrichment of active chromatin marks (Additional file 1: Figure S13b). Taken together, we suggest that some of the DHS regions identified could be false positives. Fur-ther, FPKM values for ChIP-CTCF peaks common to NicE-seq and DNase-seq (bin II) and NicE-seq alone (bin III) showed good agreement, although peaks from DNase-seq alone (bin IV) displayed FPKM values that were significantly less than those for the former two (Additional file 1: Figure S13d). We also correlated the DHSs and OCSs with transcription based on corresponding common and unique peaks for Max and Sp1. In both cases the unique peaks of NicE-seq (bin III) displayed higher transcriptional ac-tivity compared to the unique DHS peaks (bin IV). Interestingly, the number of unique DHS peaks (bin IV) was 1.5 times higher when compared to unique OCS peaks (bin III) and yet these peaks displayed lower FPKM values, suggesting the presence of false positives in DHS peaks (Additional file 1: Figure S11b and S12b).
NicE-seq and ATAC-seq identify an overlapping as well as unique set of open chromatin sites in human cells
Before comparing NicE-seq to ATAC-seq, we com-pared open chromatin regions of GM12878 cells using DNase-seq and ATAC-seq datasets. Open chro-matin peaks identified by ATAC-seq (99,885 peaks) and DNase-seq (118,157 peaks) for GM12878 cells displayed an overlap of 57,697 peaks (48% of DNase-seq peaks), suggesting half of the open chromatin re-gions are method specific (Additional file 1: Figure S14a). When we compared the open chromatin peaks identified by ATAC-seq between two different cell lines, GM12878 cells (99,885 peaks) and primary hu-man neonatal keratinocytes (93,313 peaks), the over-lap was reduced to 29,294 peaks (29% of GM12878 peaks), suggesting a high level of variation in open chromatin structure across the two different cell lines (Additional file 1: Figure S14b).
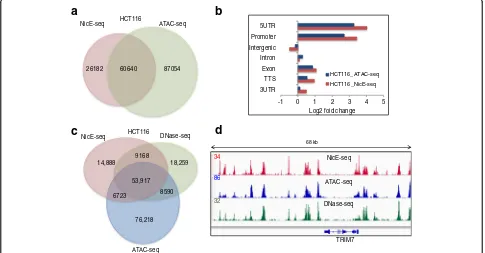
NicE-seq peaks for GM12878 cells) and 60,640 peaks (70% of NicE-seq peaks for HCT116 cells)—overlapped between ATAC-seq and NicE-seq by at least a single base (Fig. 6a; Additional file 1: Figure S14c). Interest-ingly, the log2fold enrichment of peaks across different
genomic features was similar in both cell line data sets (Fig. 6b; Additional file 1: Figure S15). Compari-son between NicE-seq (HCT116 cells) and ATAC-seq and DNase-seq (GM12878 cells) resulted in 34% over-lap in peaks, similar to the comparison between two unrelated cell lines (Additional file 1: Figure S14b, d). However, when data sets for all three methods in HCT116 cells were compared, we observed 64% of OCSs overlapping with ATAC-seq and DNase-seq peaks, suggesting very good agreement between all three methods (Fig. 6c). When the data were visual-ized using the IGV browser, peaks common to all data sets displayed similar enrichment (Fig. 6d; Additional file 1: Figure S14e), although sequencing depth was higher for ATAC-seq and DNase-seq with ~190 million for GM12878 cells, 100 million for HCT116 cells, and 39 million mapped reads com-pared to ~20 million mapped reads for NicE-seq. Therefore, with low background and high mapping ef-ficiency, NicE-seq offers insights into the distribution of open chromatin at low sequencing depths.
DNA hypomethylation of HCT116 genome correlates with OCSs
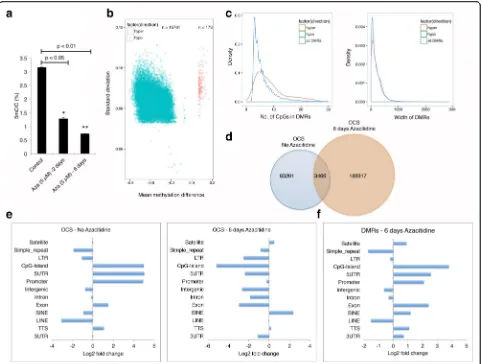
The cancer genome is globally hypomethylated. A high degree of DNA hypomethylation is also noted in tran-scriptionally active tumor suppressor genes in cancer cells. The demethylating drug decitabine is used for can-cer treatment (for myelodysplastic syndromes, a class of conditions where certain blood cells are dysfunctional, and acute myeloid leukemia). We hypothesized that gen-ome demethylation would lead to open chromatin and transcriptional activation of previously silenced genes. To test our hypothesis, we treated HCT116 cells with decitabine and measured levels of genomic 5mC. As ex-pected, we observed a gradual demethylation of the gen-ome and by the sixth day of treatment 5mC was reduced by 75% (Fig. 7a). Mean methylation difference analysis demonstrated ~99% of differentially methylated region (DMRs) were indeed hypomethylated (Fig. 7b). Although most of the hypomethylated DMRs had less than ten CpGs, the majority had three CpGs with a mean DNA length distribution of ~200 bp (Fig. 7c; Additional file 1: Figure S16a–d). OCS analysis between the control and 6-day decitabine-treated cells displayed a small percent-age of common OCSs. Indeed, the vast majority of con-trol OCSs were not represented in decitabine-treated cells and ~189,000 new OCSs were identified, suggesting
53,917
8590
76,218
18,259 14,888
6723 9168
DNase-seq NicE-seq
ATAC-seq HCT116
NicE-seq
ATAC-seq
DNase-seq
TRIM7 34
86
32
68 kb
60640
26182 87054
NicE-seq HCT116 ATAC-seq
a
b
c
-1 0 1 2 3 4 5
3UTR TTS Exon Intron Intergenic Promoter 5UTR
Log2 foid change
HCT116_ATAC-seq HCT116_NicE-seq
d
Fig. 6Comparison of open chromatin peaks identified by NicE-seq and ATAC-seq reveals both common and unique peaks.aA Venn diagram
showing the overlap between NicE-seq and ATAC-seq for HCT116 cells.bThe log2fold change of open chromatin peaks in different genomic
[image:9.595.56.541.419.672.2]large-scale chromatin landscape changes accompanying hypomethylation of the genome (Fig. 7d). In the un-treated control cells, the OCSs primarily resided in CpG islands, 5′ UTRs, promoters, exons, and transcription termination sites (TTSs), as expected. Once the genome was hypomethylated, the SINE and satellite chromatin were opened. Surprisingly, previous OCSs at CpG islands, 5′UTRs, promoters, exons, and TTSs were un-derrepresented. This observation suggests these regions were open to begin with and hypomethylation led to them becoming more open and thus more accessible to the nicking enzyme, resulting in degradation of the distal accessible DNA in the chromatin and underrepresenta-tion of these regions (Fig. 7e). Also, the percentage in-crease in OCS peaks after 6 days of decitabine treatment was evenly distributed across all chromosomes as a
function of their size (Additional file 1: Figure S17). Comparisons of DMRs between control and decitabine-treated cells suggested that most of the methylation changes occurred on chromatin representing CpG islands, 5′UTRs, promoters, exons, SINEs, satellites, 3′ UTRs, and TTS regions (Fig. 7f ).
Discussion
Genome-wide studies using DNase-seq, FAIRE-seq, and ATAC-seq have provided crucial clues to regions of tran-scriptional regulation. Humans have approximately 1700 to 1900 transcription factors, which bind different types of DNA elements, including promoters, enhancers, silencers, insulators, and locus control regions. By com-paring data from ChIP-seq, microarray, and genome-wide studies to detect open chromatin, one would be
Fig. 75-aza-2′-deoxycytidine affects nucleosome occupancy.aLiquid chromatography–mass spectrometry analysis showing loss of DNA
methylation after treatment of HCT116 cells with 5μM 5-aza-2′-deoxycytidine for 2 and 6 days.bVolcano plot showing the distribution of DMRs identified after 6 days of treatment.Blue dotsrepresent hypomethylation (n = 15,761) andred dotsrepresent hypermethylation (n = 173).cDensity plots showing the distribution of number of CpGs in the DMRs and the width of DMRs identified in the study.dA Venn diagram showing the overlap between the OCSs identified with and without 6 days of 5μM 5-aza-2′-deoxycytidine treatment.eThe log2fold change of OCS peaks in
different genomic regions for samples treated with and without 6 days of 5μM 5-aza-2′-deoxycytidine treatment.fThe log2fold change of DMRs
[image:10.595.58.541.87.451.2]able to decipher crucial clues about gene regulation, par-ticularly transcription. Classically, DHSs according to cell type specificity have been classified as common or unique. In one study, 900,000 DHSs were identified in 29 cell lines, accounting for almost 8.3% of the human genome [13]. Categorizing these DHSs further revealed that cell type-specific and ubiquitous DHSs are present in a 1:2 ratio and account for about 30,000 total peaks. The percentage of cell type-specific DHSs was much smaller than that found in a previous study [24]. Shu et al. [13] concluded this discrepancy may be due to the particular cell type since DNase I has a propensity to nick DNA at phosphodiester bonds, irrespective of the sequence context. NicE-seq, DNase-seq, and ATAC-seq in HCT116 cells identified 85,000–145,000 open chro-matin peaks. Overlapping of NicE-seq peaks with either DNase-seq or ATAC-seq peaks was over 70%, suggesting authentic identification of OCS.
We have compared the random nicking activity of DNase I with a sequence-specific nicking enzyme, Nt-CviPII, and its impact on open chromatin identification. Nt-CviPII recognizes the CCD trinucleotide sequence and these sites are densely dispersed throughout the human genome. We have also demonstrated that the frequency of nicking sites has no bearing on open matin enrichment; rather, accessibility to the open chro-matin by the nicking enzyme is the major determinant of tag reads of OCSs. However, when DHS and OCS reads were compared for HCT116 cells, about a third from either method remain unique. Additional transcrip-tional and histone mark analysis and comparison of these unique sequence tags revealed that the OCS peaks are more enriched in H3K4me3 and H3K27ac, suggest-ing Nt-CviPII has a higher specificity than DNase I, resulting in more accurate open-chromatin region deter-mination. Furthermore, OCSs between two different cancer-derived cell lines demonstrated cell type-specific and common open chromatin regions, suggesting conservation of OCSs in mammalian cells. Comparison between NicE-seq, ATAC-seq, and DNase-seq demon-strated both unique and common open chromatin re-gions. This may be attributed to sequence and structural bias of DNase I or Nt-CviPII or biased tagging of DNA by the transposase used in ATAC-seq. Therefore, for limited numbers of cells, both NicE-seq and ATAC-seq may be performed to negate sequence bias.
When we used NicE-seq to determine the impact of decitabine-mediated hypomethylation on OCSs, we ob-served large numbers of OCSs compared to the control genome. DNA methylation of the genome attracts me-thyl CpG binding proteins and associated transcriptional repressors to confer a heterochromatin structure. In the absence of a DNA methylation signature, the hetero-chromatin structure is destabilized [25] and presumably
chromatin is more open. This observation is supported by an earlier indirect chromatin accessibility study using array hybridization technology and the DNA methyl-transferase inhibitor 5-aza-2′-deoxycytidine (5-Aza-CdR) or the histone deacetylase inhibitor suberoylanilide hydroxamic acid [26]. In another study, localized DNA demethylation at the H19 imprinting control region (ICR) induced by 5-AzaCdR reduced IGF2 expression, increased H19 expression, increased CTCF and cohesin recruitment, and also changed histone modifications along with chromatin accessibility [27].
Therefore, NicE-seq is a straightforward method that can be performed on potentially any cell type from any species with a sequenced genome. The protocol de-scribed here works for cell numbers between 250 and 25,000. Below 250 or above 25,000 cells the dynamic range of the current NicE-seq protocol is compromised, resulting in a drop in the number of peaks. This could be overcome by optimizing the concentration of nicking enzymes, reaction conditions, and cell numbers. Further-more, different cell types and cells with different chro-matin compaction, such as mitotic (compact chrochro-matin) versus replicating (relaxed chromatin), will offer chal-lenges to nicking enzyme catalysis. This may result in under representation of OCS for compact chromatin re-gions. The sequence specificity of Nt.CviPII (CCD) may cause it to misidentify AT-rich open chromatin se-quences and thus may not be suitable for AT-rich gen-ome studies. However, NicE-seq has similar resolution to ATAC-seq and DNase-seq in the human genome and no prior knowledge is required with regards to histone modifications, transcription factor binding sites, gene annotation, or relative degree of sequence conservation between species. It can aid in the identification of the most active gene regulatory elements in order to under-stand the chromatin landscape during mammalian de-velopment programming and epigenetic drug discovery studies.
Conclusions
and pharmacological studies. We envision that when NicE-seq is coupled with fluorescent-labeled dNTPs it will facilitate visualization of open chromatin in eukaryotic cells.
Methods
Cell culture and 5-aza-2′-deoxycytidine treatment
HCT116 cells were cultured in McCoy’s 5A media sup-plemented with 10% fetal bovine serum (FBS). Cells (25,000) were treated with 5μM 5-aza-2′-deoxycytidine (decitabine) for 6 days [28]. Samples were harvested after 2 days of treatment and the medium was replaced and fresh 5-aza-2′-deoxycytidine was added for another 4 days. MCF7 and HeLa cells were cultured in DMEM plus 10% FBS.
Open chromatin labeling
For library construction, we used HCT116 and MCF7 cells. Cells were cross-linked using 1% formaldehyde for 10 min at room temperature and quenched by using 125 mM glycine. Nuclei were isolated by incubating the cross-linked cells in cytosolic buffer (15 mM Tris-HCl
pH 7.5, 5 mM MgCl2, 60 mM KCl, 0.5 mM DTT,
15 mM NaCl, 300 mM sucrose, and 1% NP40) for 10 min on ice with occasional agitation. Nuclei were precipitated by spinning at 1000 ×g, 4 °C for 5 min and the supernatant was discarded. Open chromatin DNA was labeled with biotin by incubating the nuclei in the presence of 2.5 U of Nt.CviPII (NEB R0626S), 10 U of DNA polymerase I (M0209S) and 30μM of each dNTP including 6 μM of biotin-14-dATP (Invitrogen, 19524-016) and 6 μM of biotin-16-dCTP (ChemCyte, CC-6003-1) in 200μL of 1× NEB buffer 2. The labeling reac-tion was carried out at 37 °C in a thermo-mixer at 800 RPM for 2 h. We added 20μL of 0.5 M EDTA and 2μg of RNase A to the labeling reaction and incubated it at 37 °C for 0.5 h to stop the reaction and digest RNA. Fi-nally DNA–protein cross-linking was reversed by adding 20μL of proteinase K (NEB, P8107S) and 20μL of 20% SDS to the reaction and incubating at 65 °C for over-night. Biotin-labeled genomic DNA was extracted using phenol chloroform. Open chromatin labeling in native cells was performed without the formaldehyde crosslink-ing step.
Open chromatin labeling for microscopy was performed by culturing HeLa cells in an eight-well Lab-Tek II cham-bered coverglass system (Nalge Nunc International, 155409). The cells were fixed using 1% paraformaldehyde for 10 min and then washed thrice with 1× PBS for 5 min followed by incubation with cytosolic buffer for 10 min. The nicking reaction mix was as described earlier but with biotinylated dATP and dCTP replaced by TexasRed-dATP (PerkinElmer, NEL471001EA) for 1 h followed by washing the cells with 1× PBS supplemented with 50 mM EDTA
and 0.1% TritonX-100 (wash buffer) for 5 min. Nuclear staining was performed by 0.01% Hoechst stain for 5 min. Finally, cells were washed thrice with wash buffer for 10 min each and visualized using a Zeiss LSM880 confocal microscope with 20× objective.
Quantification of labeling efficiency
Open chromatin labeling efficiency was analyzed by dot blot on genomic DNA and by imaging labeled cells. A serial dilution of genomic DNA was spotted onto positively charged nylon membrane (Roche, 11209299001) and cross-linked by UV. Membrane was blocked by 5% non-fat milk and probed using an HRP-conjugated goat anti-biotin antibody (1:2000 di-lution, CST, 7075). Biotin signal was revealed using LumiGLO reagent (CST, 7003).
NicE-seq library construction
Biotin-labeled genomic DNA from fixed (HCT116, MCF7, and decitabine-treated HCT116 cells) and native (HCT116 cells) reactions were sonicated into 150-bp fragments (Covaris) and 1μg of DNA was end-repaired, dA-tailed, and ligated with NEB Illumina adaptor (E7370S). Without further purification, the ligation product was mixed with 50μL of Streptavidin magnetic beads (Invitrogen 65001, blocked using 0.1% cold fish gelatin in 1× PBS overnight at 4 °C) in 1 mL of B&W buffer (10 mM Tris-HCl pH 8.0, 1 mM EDTA, 2 M NaCl). Biotin-labeled open chromatin DNA was cap-tured by streptavidin magnetic beads at 4 °C for 2 h with end-over-end rotation. The beads were washed four times with B&W buffer plus 0.05% of Triton X-100 followed by one wash with TE plus Triton X-100. The beads were resuspended in 40 μL of nuclease-free water and 4 μL was used for library amplification using PCR (NEB, E7370S). Ten PCR cycles were usually sufficient to generate the amount of library DNA needed for sequencing.
For library construction using 250 cells, all procedures remained the same except for the addition of 10 μg of glycogen during genomic DNA extraction. In the case of the 25-cell experiments, 0.25 U of Nt.CviPII and 5 U of DNA polymerase I were used. The entire DNA was soni-cated and 10 μL of streptavidin beads were added to capture the biotinylated DNA, which was used as tem-plate for library amplification. For input library prepar-ation 1μg of purified genomic DNA was used instead of the labeled chromatin.
ATAC-seq library construction
six times to facilitate cell lysis. ATAC-seq library was size-selected for 250–500 bp and 75-bp paired-end sequenced on the NextSeq 500 Illumina platform.
Read mapping and open chromatin peak calling
Adaptor and low quality sequences were trimmed from paired-end sequencing reads using Trim Galore (http:// www.bioinformatics.babraham.ac.uk/projects/trim_galore/) with default settings. Sequencing reads were mapped to reference human genome hg19 with Bowtie2 [30]. Four different packages with different algorithms were used for calling open chromatin peaks. MACS2 was used with -f BAMPE, -g hs, –broad, –broad-cutoff 0.1, –bdg, –keep-dup 1, -m 5 50, –slocal 1000, –llocal 10000 [31], ZINBA was used with extension = 360, printFullOut = 1 and refine-peaks = 1 [32], PeaKDEck was used with -sig 0.0001 [33], and SICER was used with a window size of 200 bp, frag-ment size of 150 bp, gap size of 600 bp, and FDR of 0.01 [34]. In all cases input library sequences were supplied if required. The input library was generated using sonicated genomic DNA of normal HCT116 cells. Peaks called by four different packages were considered associated if they have at least one base pair overlapping. Venn diagrams were plotted based on overlapping analysis.
In order to compare NicE-seq data when using differ-ent numbers of input cells (25–250,000), we downsized the mapped reads from different experiments to 14.4 million mapped read pairs. Peaks were called using the same parameter with MACS2 as mentioned above.
Association analysis of Nt.CviPII site density and open chromatin tag enrichment
To exclude the possibility that open chromatin DNA en-richment is solely caused by the occurrence of Nt.CviPII sites (CCD, D = A or G or T) in certain genomic regions but not the accessibility of chromatin by labeling en-zymes, we did correlation analysis on CCD site density and open chromatin tag density in 100-bp genomic tiles or open chromatin peak regions called by MACS2. Hg19 was scanned for Nt.CviPII sites using an in-house Perl program and the genomic coordinates of Nt.CviPII sites were recorded. Nt.CviPII site density was expressed as sites per kilobase genomic sequence. Pearson linear cor-relation was implemented on the number of Nt.CviPII sites and the number of sequencing tags or Nt.CviPII site density and log2 fold enrichment of open chromatin tags in MACS2 peak regions. The Pearson product-moment correlation coefficient was used to measure the degree of correlation.
Comparison of NicE-seq with other chromatin profiling methods
We compared NicE-seq, ATAC-seq with DNase I hyper-sensitivity sequencing (referred throughout as
DNase-seq) for sensitivity and specificity. DNase-seq data was downloaded from ENCODE
(wgEncodeUwDnaseHc-t116AlnRep1 and wgEncodeUwDnaseMcf7AlnRep1)
[35]. ATAC-seq data for HCT116 was generated in-house, GM12878 and primary human neonatal keratino-cytes were obtained from Gene Expression Omnibus GSE47753 and GSM1645708 respectively. Sequencing reads were mapped and open chromatin peaks were called using MACS2 with the same parameters as the NicE-seq experiment. Overlapped open chromatin peaks in both methods were identified using DiffBind package in R [36]. For a more detailed comparison between NicE-seq and DNase-seq, the RPKM values of common peaks were correlated using the Pearson linear correl-ation method. The tag density of common peaks was also plotted on a heatmap to reveal the fine alignment of NicE-seq and DNase-seq peaks in common genomic re-gions. Data sets for DNase-seq (HCT116), ATAC-seq (HCT116, GM12878) and NicE-seq (HCT116) was loaded in bedGraph format on IGV browser for visualization.
Analysis of association between open chromatin, histone modifications, transcription factor binding, and CpG methylation status
Open chromatin peaks identified by NicE-seq were correlated with ChIP-seq targeted to H3K4me1, H3K4me3, H3K27ac, RNApolII, and YY1 identified in the HCT116 cell line (ENCODE project files wgEnco-deEH002874, wgEncodeEH000949, wgEncodeEH002873, wgEncodeEH001627, and wgEncodeEH001671). The sequencing tag density of chromatin and transcription factor marks on open chromatin peaks was counted using HOMER [37], and heat maps were plotted using the pheatmap package in R [38]. For the association ana-lysis of CpG methylation and open chromatin, whole genome bisulfite sequencing data of the HCT116 cell line was retrieved from GEO (accession GSM1465024), CpG sites were mapped to the ±3-kb region of open chromatin, and the methylation ratio of single CpG sites was plotted on a heat map.
For correlation between CTCF occupancy and chro-matin status, peaks for the ChIP-CTCF data set from
ENCODE (wgEncodeEH003220) were called using
in these four bins was determined by counting the se-quencing tag density for RNA pol II using HOMER and plotted as heat maps using pheatmap. Similar heat maps were plotted for determining the enrichment of H3K4me3 and H3K27ac for bins II, III, and IV. ChIP fragment depth analysis was performed using HOMER for H3K4me3 and H3K27ac data sets. Peaks from ChIP-Max (wgEncodeHaibTfbsHct116ChIP-MaxV0422111AlnRep1) and ChIP-SP1 (wgEncodeHaibTfbsHct116Sp1V0422111 AlnRep1) ENCODE data sets were also analyzed by binning as mentioned above.
Correlation of chromatin accessibility with gene expression
Based on the expression level, all of the genes discovered by RNA-seq were divided into four groups, high, medium, low, and no expression. RNA-seq data were from a previous study using the HCT116 cell line
(GSM1661373, GSM1661374, GSM1661375) [41].
Sequencing tag density of NicE-seq and other ChIP-seq data across the gene body was calculated and plotted using the ngsplot package [42]. Box plot of FPKM values for peaks corresponding to bins II, III, and IV for ChIP-CTCF, ChIP-Max, and ChIP-SP1 was plotted using the ggplot2 R package [43].
Liquid chromatography–mass spectrometry analysis for
quantifying global 5mC level
Genomic DNA of control and decitabine treated (days 2 and 6) was digested with NEB nuclease cocktail for 1 h and nucleoside analysis was performed using liquid chromatography–mass spectrometry for quantification of 5mC levels [44].
Genome-wide DNA methylation analysis
Genomic DNA (1 μg) isolated from HCT116 cells treated with 5 μM 5-aza-2′-deoxycytidine for 6 days or untreated control was sonicated into 150-bp fragments, bisulfite treated, library prepared, and sequenced on the Illumina NextSeq 500 platform with 150-bp paired-end reads for whole genome bisulfite sequencing analysis. Adaptor and low quality sequences (Phred score <20) were trimmed and reads were mapped to hg19 using Bismark with Bowtie2 [45]. CpG methylation levels were calculated with uniquely mapped reads using Bismark methylation extractor with the parameter -p –no_over-lap and a minimum coverage of 3. Differential methyla-tion analysis was carried out using the bsseq R package [46]. CpGs present in at least two replicates of each group were retained for downstream analysis. DMRs were identified containing a minimum of three CpGs and mean difference between the control and 5-aza-2′-deoxycytidine-treated samples of greater than 0.1 using the bsseq R package. DMRs were annotated by mapping
the genomic coordinates to various genomic regions using the annotatePeaks.pl function of HOMER [37]. DMRs were visualized by plotting a volcano plot using the ggplot2 R package [43]. Density plots for number of CpGs in DMR and the lengths of DMRs were plotted using the bsseq R package.
Additional file
Additional file 1:Supplementary Figures S1–17. (DOCX 1378 kb)
Abbreviations
ATAC-seq:Assay for transposase-accessible chromatin with high throughput sequencing; ChIP: Chromatin-immunoprecipitation; DHS: DNase I hypersensitivity site; DMR: Differentially methylated region; DNase-seq: DNase I-based sequencing; FAIRE-seq: Formaldehyde assisted isolation of regulatory element sequencing; LINE: Long interspersed nuclear element; NicE-seq: Nicking enzyme accessible chromatin sequencing; OCS: Open chromatin site; scDNase I-seq: Single cell DNase I-seq; SINE: Short interspersed nuclear element; TSS: Transcription state site; TTS: transcription termination site; UTR: Untranslated region
Acknowledgements
We would like to thank Drs. Donald Comb, Rich Roberts, William Jack, and Clotilde Carlow at New England Biolabs Inc. for research support and encouragement. We appreciate William Jack’s suggestions during the experiments and Clotilde Carlow’s critical reading of the manuscript.
Funding
Funding was provided by New England Biolabs Inc.
Availability of data and materials
The sequencing data generated in this manuscript have been deposited in the Gene Expression Omnibus database (https://www.ncbi.nlm.nih.gov/ geo) with the accession number GSE97889.
Authors’contributions
SP, VKCP, and GZ conceptualized and designed the study. VKCP, GZ, POE, GS, SS, and TB acquired the data. VKCP and GZ analyzed the data. SP and VKCP wrote the manuscript. SX provided reagents and optimized reaction conditions. All authors read and accepted the final version of the manuscript.
Competing interests
This research was supported by New England Biolabs, Inc. VKCP, GZ, POE, GS, SX, and SP performed the work as employees of New England Biolabs, Inc. A provisional patent with serial number 62/383,151 was submitted by New England Biolabs, Inc. that covers open chromatin sequencing and labeling, the patent does not restrict the research use of NicE-seq.
Consent for publication
Not applicable.
Ethics approval and consent to participate
Not applicable.
Publisher’s Note
Springer Nature remains neutral with regard to jurisdictional claims in published maps and institutional affiliations.
Author details
Received: 19 April 2017 Accepted: 26 May 2017
References
1. Zaret KS, Mango SE. Pioneer transcription factors, chromatin dynamics, and cell fate control. Curr Opin Genet Dev. 2016;37:76–81.
2. Weipoltshammer K, Schofer C. Morphology of nuclear transcription. Histochem Cell Biol. 2016;145:343–58.
3. Tsompana M, Buck MJ. Chromatin accessibility: a window into the genome. Epigenetics Chromatin. 2014;7:33.
4. Radman-Livaja M, Rando OJ. Nucleosome positioning: how is it established, and why does it matter? Dev Biol. 2010;339:258–66.
5. Boyle AP, Song L, Lee BK, London D, Keefe D, Birney E, Iyer VR, Crawford GE, Furey TS. High-resolution genome-wide in vivo footprinting of diverse transcription factors in human cells. Genome Res. 2011;21:456–64. 6. Schones DE, Cui K, Cuddapah S, Roh TY, Barski A, Wang Z, Wei G, Zhao K.
Dynamic regulation of nucleosome positioning in the human genome. Cell. 2008;132:887–98.
7. Shivaswamy S, Bhinge A, Zhao Y, Jones S, Hirst M, Iyer VR. Dynamic remodeling of individual nucleosomes across a eukaryotic genome in response to transcriptional perturbation. PLoS Biol. 2008;6:e65. 8. Lee CK, Shibata Y, Rao B, Strahl BD, Lieb JD. Evidence for nucleosome
depletion at active regulatory regions genome-wide. Nat Genet. 2004;36: 900–5.
9. Boeger H, Griesenbeck J, Strattan JS, Kornberg RD. Nucleosomes unfold completely at a transcriptionally active promoter. Mol Cell. 2003;11:1587–98. 10. Wallrath LL, Lu Q, Granok H, Elgin SC. Architectural variations of inducible
eukaryotic promoters: preset and remodeling chromatin structures. Bioessays. 1994;16:165–70.
11. Hogan GJ, Lee CK, Lieb JD. Cell cycle-specified fluctuation of nucleosome occupancy at gene promoters. PLoS Genet. 2006;2:e158.
12. Korber P, Luckenbach T, Blaschke D, Horz W. Evidence for histone eviction in trans upon induction of the yeast PHO5 promoter. Mol Cell Biol. 2004;24: 10965–74.
13. Shu W, Chen H, Bo X, Wang S. Genome-wide analysis of the relationships between DNase I HS, histone modifications and gene expression reveals distinct modes of chromatin domains. Nucleic Acids Res. 2011;39:7428–43. 14. Buck MJ, Lieb JD. A chromatin-mediated mechanism for specification of
conditional transcription factor targets. Nat Genet. 2006;38:1446–51. 15. Wu C, Wong YC, Elgin SC. The chromatin structure of specific genes: II.
Disruption of chromatin structure during gene activity. Cell. 1979;16:807–14. 16. Wu C. The 5′ends of Drosophila heat shock genes in chromatin are
hypersensitive to DNase I. Nature. 1980;286:854–60.
17. Keene MA, Elgin SC. Micrococcal nuclease as a probe of DNA sequence organization and chromatin structure. Cell. 1981;27:57–64.
18. Levy A, Noll M. Chromatin fine structure of active and repressed genes. Nature. 1981;289:198–203.
19. Park PJ. ChIP-seq: advantages and challenges of a maturing technology. Nat Rev Genet. 2009;10:669–80.
20. Jin W, Tang Q, Wan M, Cui K, Zhang Y, Ren G, Ni B, Sklar J, Przytycka TM, Childs R, et al. Genome-wide detection of DNase I hypersensitive sites in single cells and FFPE tissue samples. Nature. 2015;528:142–6.
21. Nagy PL, Cleary ML, Brown PO, Lieb JD. Genomewide demarcation of RNA polymerase II transcription units revealed by physical fractionation of chromatin. Proc Natl Acad Sci U S A. 2003;100:6364–9.
22. Crawford GE, Holt IE, Whittle J, Webb BD, Tai D, Davis S, Margulies EH, Chen Y, Bernat JA, Ginsburg D, et al. Genome-wide mapping of DNase hypersensitive sites using massively parallel signature sequencing (MPSS). Genome Res. 2006;16:123–31.
23. Buenrostro JD, Giresi PG, Zaba LC, Chang HY, Greenleaf WJ. Transposition of native chromatin for fast and sensitive epigenomic profiling of open chromatin, DNA-binding proteins and nucleosome position. Nat Methods. 2013;10:1213–8.
24. Xi H, Shulha HP, Lin JM, Vales TR, Fu Y, Bodine DM, McKay RD, Chenoweth JG, Tesar PJ, Furey TS, et al. Identification and characterization of cell type-specific and ubiquitous chromatin regulatory structures in the human genome. PLoS Genet. 2007;3:e136.
25. Haaf T. The effects of 5-azacytidine and 5-azadeoxycytidine on chromosome structure and function: implications for methylation-associated cellular processes. Pharmacol Ther. 1995;65:19–46.
26. Pandiyan K, You JS, Yang X, Dai C, Zhou XJ, Baylin SB, Jones PA, Liang G. Functional DNA demethylation is accompanied by chromatin accessibility. Nucleic Acids Res. 2013;41:3973–85.
27. Ito Y, Nativio R, Murrell A. Induced DNA demethylation can reshape chromatin topology at the IGF2-H19 locus. Nucleic Acids Res. 2013;41: 5290–302.
28. Hesson LB, Patil V, Sloane MA, Nunez AC, Liu J, Pimanda JE, Ward RL. Reassembly of nucleosomes at the MLH1 promoter initiates resilencing following decitabine exposure. PLoS Genet. 2013;9:e1003636. 29. Buenrostro JD, Wu B, Chang HY, Greenleaf WJ. ATAC-seq: a method for
assaying chromatin accessibility genome-wide. Curr Protoc Mol Biol. 2015; 109:21–9.
30. Langmead B, Salzberg SL. Fast gapped-read alignment with Bowtie 2. Nat Methods. 2012;9:357–9.
31. Liu T. Use model-based Analysis of ChIP-Seq (MACS) to analyze short reads generated by sequencing protein-DNA interactions in embryonic stem cells. Methods Mol Biol. 2014;1150:81–95.
32. Rashid NU, Giresi PG, Ibrahim JG, Sun W, Lieb JD. ZINBA integrates local covariates with DNA-seq data to identify broad and narrow regions of enrichment, even within amplified genomic regions. Genome Biol. 2011;12: R67.
33. McCarthy MT, O’Callaghan CA. PeaKDEck: a kernel density estimator-based peak calling program for DNase I-seq data. Bioinformatics. 2014;30:1302–4. 34. Xu S, Grullon S, Ge K, Peng W. Spatial clustering for identification of
ChIP-enriched regions (SICER) to map regions of histone methylation patterns in embryonic stem cells. Methods Mol Biol. 2014;1150:97–111.
35. Meyer CA, Liu XS. Identifying and mitigating bias in next-generation sequencing methods for chromatin biology. Nat Rev Genet. 2014;15:709–21. 36. Ross-Innes CS, Stark R, Teschendorff AE, Holmes KA, Ali HR, Dunning MJ,
Brown GD, Gojis O, Ellis IO, Green AR, et al. Differential oestrogen receptor binding is associated with clinical outcome in breast cancer. Nature. 2012; 481:389–93.
37. Heinz S, Benner C, Spann N, Bertolino E, Lin YC, Laslo P, Cheng JX, Murre C, Singh H, Glass CK. Simple combinations of lineage-determining
transcription factors prime cis-regulatory elements required for macrophage and B cell identities. Mol Cell. 2010;38:576–89.
38. Kolde R. pheatmap: Pretty Heatmaps. 2015. https://cran.r-project.org/web/ packages/pheatmap/index.html.
39. DiffBind: differential binding analysis of ChIP-Seq peak data. http:// bioconductor.org/packages/release/bioc/vignettes/DiffBind/inst/doc/ DiffBind.pdf.
40. Neph S, Kuehn MS, Reynolds AP, Haugen E, Thurman RE, Johnson AK, Rynes E, Maurano MT, Vierstra J, Thomas S, et al. BEDOPS: high-performance genomic feature operations. Bioinformatics. 2012;28:1919–20. 41. Zhang G, Esteve PO, Chin HG, Terragni J, Dai N, Correa Jr IR, Pradhan S.
Small RNA-mediated DNA (cytosine-5) methyltransferase 1 inhibition leads to aberrant DNA methylation. Nucleic Acids Res. 2015;43:6112–24. 42. Shen L, Shao N, Liu X, Nestler E. ngs.plot: Quick mining and visualization of
next-generation sequencing data by integrating genomic databases. BMC Genomics. 2014;15:284.
43. Wickham H. ggplot2: elegant graphics for data analysis. Springer-Verlag New York: Springer; 2009.
44. Estève PO, Terragni J, Deepti K, Chin HG, Dai N, Espejo A, Correa Jr IR, Bedford MT, Pradhan S. Methyllysine reader plant homeodomain (PHD) finger protein 20-like 1 (PHF20L1) antagonizes DNA (cytosine-5) methyltransferase 1 (DNMT1) proteasomal degradation. J Biol Chem. 2014; 289:8277–87.
45. Krueger F, Andrews SR. Bismark: a flexible aligner and methylation caller for Bisulfite-Seq applications. Bioinformatics. 2011;27:1571–2.