http://dx.doi.org/10.4236/jcc.2014.29009
Variance Window Based Car License Plate
Localization
Jing Pang
Department of Electrical & Electronic Engineering, Computer Engineering Program, California State University, Sacramento, CA, USA
Email: [email protected]
Received April 2014
Abstract
In this paper, a new method for discovering the candidate car license plate locations is presented. First, the image is decomposed using a Haar wavelet to get the HL band with vertical edges. Then, the HL band image is binarized using an Otsu threshold. Next a black top-hat algorithm is applied to reduce the effects of interfering large continuous features other than the license plate. At this time, a moving window based modified variance score calculation is made for areas with white pixels. This work found that the top 3 detected rectangle windows correctly locate the license plate regions with a success rate of about 98.2%. Moreover, the proposed method is robust enough to locate the plates in cases where the rough vehicle position has not been previously discovered and the cars are not centered in the image.
Keywords
Harr Wavelet, Black Top-Hat, Binarization, Moving Window, Variance Score
1. Introduction
There is growing interest in license plate detection, segmentation and recognition among researchers due to wide applications in the fields of computer vision, vehicle toll collection, vehicle traffic monitoring, security, control and law enforcement.
Many researchers have tried to detect license plates using color information, plate features, edge detection, ar- tificial neural networks and others [1]-[6]. Moreover, most reports for license character segmentation have used license plate character features such as character projection methods [7] [8], and classifier methods [9]. As for li- cense character recognition, a lot of research efforts have focused on feature based methods, learning based me- thods [10], and template matching methods [11] [12].
Usually, color based methods are memory-consuming and unsuitable for real time applications due to large data processing, and sensitivity to illumination variations [13].
car character is normalized to the template size, the most similar template will be considered as the match. The success rate of this method strongly depends on the high similarity between the template image and the original image [19]. However, different image capturing angles, lighting, plate sizes, and so on can cause errors.
One of the most challenging aspects of license plate identification, however, is establishing an approximate target location of the plate in a raw image. Raw images that have not been manually cropped to an area of inter- est can contain many competing elements that will interfere with detection. Firstly, a natural scene contains many high frequency elements like leaves, reflections, and lettering on signs and roads. Even in a traffic video that has a relatively uninteresting background, there are many features on a vehicle that provide sources of false positives. Trucks frequently have advertisements, bumper stickers frequently have text, and since the vehicles are moving through the video frame, it is not possible to simply guess at a target rectangle in the frame based on assumption that a car would be in the center frame, or that the plate would be in the bottom half of the image.
The remains of this paper will discuss in detail the proposed new method for locating the license plate. In Section 2, the image pre-processing techniques using conventional transforms and filters are discussed. Section 3 presents the window based modified variance technique for locating the license plate. Section 4 shows design results and Section 5 draws conclusions.
2. Plate Localization
The objective of this work was to use a published dataset taken from a video using a fixed camera positioned near or above a roadway. Because the technique should be fully automated, no manual pre-cropping to a region of interest (ROI) was permitted. The 1290 un-cropped pictures from the gilman frames folder of the published dataset [20] were used in this design work.
2.1. Plate Localization Challenges
If the image is cropped to the back of the car and near the license plate, many existing techniques are very effec- tive at using the character textures in order to precisely identify the outline of the characters of the license plate in the image. For example, the wavelet based texture identification is excellent at defining the plate region, but it does not work well if the image is not first cropped to the approximate area of the plate.
There are several challenges in locating the license plate with the published gilman dataset. Firstly, the license plate can appear almost anywhere in the picture, and can’t be easily narrowed down by techniques such as tak- ing the bottom half of the image. Secondly, the pictures are expansive enough so that there are plenty of edges from the background scene that are not related to the license plate itself. Also the view of the car with the plate may be obstructed by another car behind it where another plate is visible. This prevents the use of shadows un- der the car as a method for isolating the approximate location of the car in the image. Finally, the images in the gilman dataset are low resolution to the point where many letters on license plates cannot even be read by hu- man eyes. This makes their signature much less obvious to globally applied texture algorithms. This work tested a technique that used the shadows to identify the bottom of the car, and it worked on less than 60% of the pic- tures in the gilman dataset because the rest of the time the region below the car was cropped or obstructed.
Figure 1 shows new strategy used by this work.
2.2. Crop and Grayscale
The image in Figure 2 shows the text areas that are added by the camera to the top and bottom of the image. These should be removed. So the first step is to remove any annotation added by the camera through cropping the top and bottom of the image in case annotation is added to the image. Cropping is not needed for images without camera annotation.
Figure 1. Car license plate localization flow chart.
Figure 2. Original image with annotation.
in the image, especially in the shadows and roads. In addition, many camera models may only have grayscale. In this work, the RGB color car image is converted into a grayscale image using Equation (1) shown below.
F = 0.299 *R + 0.587 * G + 0.114 * B. (1)
where F is the luminance value, R is read color value, G is green color value, and B is blue color value. The result of the converted grayscale image is shown in Figure 3.
2.3. Haar Wavelet
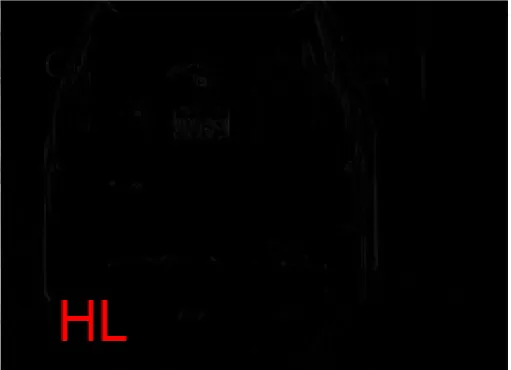
In order to locate the plate, it is necessary to inspect the car vertical edges. Many techniques are available, in-cluding Canny and Sobel edge detection algorithms, as well as morphological methods inin-cluding the Black-hat transform. However, the wavelet technique [21] [22] of using the Haar wavelet has many advantages, such as high speed, a smaller output image and image components that separate horizontal from vertical edges. The de- composition of the image using a Haar wavelet is shown in Figure 4.
In Figure 4, there are four wavelet sub-bands: LL, HL, LH, and HH. The LL represents the low frequency band. The HL, LH and HH represent the high frequency bands. The HL band shows the vertical car edges, the LH band shows the horizontal car edges, and the HH band shows the diagonal car edges. Especially, the HL band shown in Figure 5 is of principal interest in this design.
While the plate clearly stands out in Figure 5, a typical approach at this point is to apply a row-sum technique with a threshold in order to isolate the plate. The result is shown in Figure 6.
2.4. Binarization Using Otsu’s Thresholding
Since the variation in the plate region is consistent across a large windowed area, a new window based variance method shown in Figure 1 is proposed to locate plate.
Figure 3. Cropped grayscale car image.
Figure 4. Haar wavelet transform.
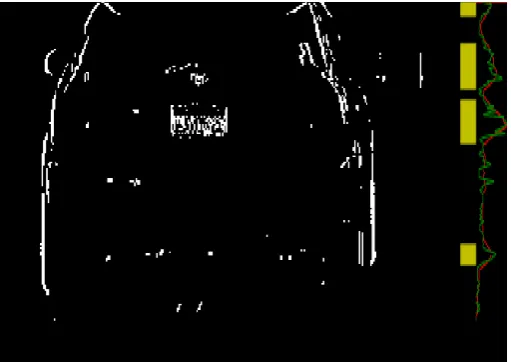
[image:4.595.187.443.517.702.2]Figure 6. Grayscale HL sub-band car image with row-sum distribu- tion and identified plate candidate regions.
Figure 7. Binarized car image with row-sum distribution.
about the same as Figure 6. However, the license plate area is filled with frequent jumps from white to black, while the other edges tend to experience less variation.
2.5. Black Top-Hat
The black top-hat method is used to reduce the impact of large, low-variation elements in the image in this work. Although the plate has a lot of high frequency variation that would likely be preserved by a top-hat filter, many of the other features like the tail lights, car edges and others would likely be removed. This step helps to reduce the chance for false positives, but also reduces the amount of white pixels in the image.
3. Conditional Windowed Variance
For the dataset tested in this work, the size of the letter containing region of the plate is approximately four times as wide as it is tall in the original image, and approximately 40 by 10 pixels in the Haar wavelet HL sub-band image. So a moving window of 40 × 10 pixels can be used based on a rule of thumb for this dataset to search for the maximum variance.
[image:5.595.187.443.306.487.2]to use the Haar wavelet to down-sample the image until the size of the plate in the image is approximately scaled to the 40 × 10 window size. If window size is smaller, the license plate characters won’t be recognized.
3.1. Border Subtraction
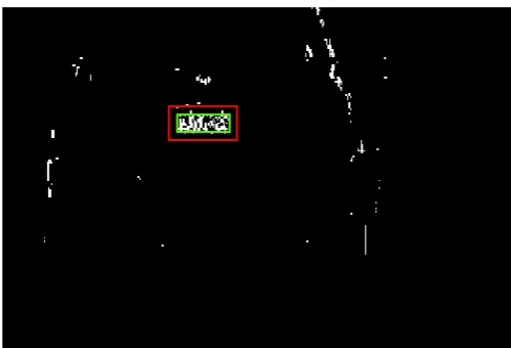
While the windowed variance is a good indication, many textures besides a license plate may also have high frequency variation that could fill a moving window. To solve this problem, consider the neighboring regions outside the moving window. In the license plate region, there is high variance within the moving window, and low variance outside the window. In other non-plate regions, the outside of the moving window may still have high frequency components due to their long vertical edges. In this work, a two pixel thick border marked in red in Figure 9 is considered.
[image:6.595.185.443.318.498.2]In Figure 9, the outside border marked in red is offset by 5 pixels in all directions from the moving variance window marked in green. It allows checking for approximately (50 × 4 + 20 × 4) pixels. Mirror symmetry is used when the bounds extend beyond the image outmost borders. A parameter called F score is defined below.
Figure 8. Car image after black top-hat processing.
[image:6.595.185.441.526.700.2]F=Variance(w) - Sum (b*b). (2)
where w represents pixel values in the window region, and b represents the pixel values in the border region.
3.2. Overlap Prevention
The result of the conditionally applied windowed variance calculation will frequently produce several rectangles with high F score values all approximately in the region of the plate. This doesn’t matter if the rectangular re- gion with the maximum variance shows the location of the plate.
However, in the gilman image dataset, there are several images with multiple plates, and a few cases where there is a false positive that actually scores higher than the actual license plate window. In these cases it is bene- ficial to evaluate more than one rectangle region result. In this design work, the top ten detected rectangles with high F scores are preserved. But if the results overlap, it will not be helpful.
The rule is that if any of the existing overlapping windows in the top 10 list has a higher F score than the new window, discard the new window. Otherwise the new window will replace all of the existing overlapping win- dows currently in the top 10. This guarantees that the list of rectangle windows in the top 10 will have the high- est F scores, but not intersect each other. The number of 10 is chosen arbitrarily for testing purpose. As seen from the results, in fact the top three windows are enough to identify the plate 98% of the time.
4. Results and Analysis
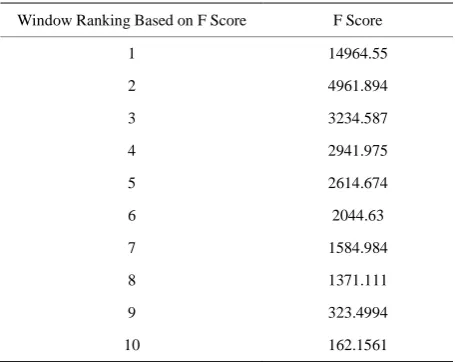
As explained above, the detected top 10 rectangle windows with highest F scores for Figure 9 are ranked ac- cording to their F scores shown in Table 1.
In Table 1, the first window has much higher F score than the other windows. Moreover, the license plate coincided with window 1.
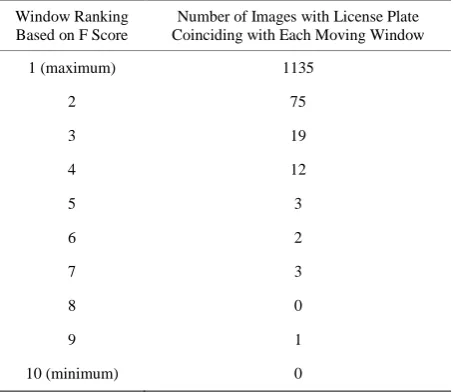
For this work, 1290 total pictures were tested. Of these, 18 pictures had no plates at all in them, so effectively there were 1272 pictures with possible plates. This design work only allowed for one “correct” plate answer for each image and there were never three or more plates in the tested images. Table 2 shows the number of times that the actual license plate coincided with a rectangle moving window. The rectangle moving window number is ranked based on its F score.
The major observations from Table 2 are listed below.
1) For 1250 of those 1272 images, or a little better than 98% of the time, the actual plate rectangle coincided with one of the top 10 detected rectangles.
2) In 1135 cases, or about 89% of the time, the rectangle with the highest F score was actually coincided with the plate region.
[image:7.595.184.412.538.719.2]3) In 75 cases, the license plates coincided with the rectangle having the second highest F score due to inter- ference from car mirrors or additional license plates existing in some images.
Table 1. Window ranking with different F scores.
Window Ranking Based on F Score F Score
1 14964.55
2 4961.894
3 3234.587
4 2941.975
5 2614.674
6 2044.63
7 1584.984
8 1371.111
9 323.4994
2 75
3 19
4 12
5 3
6 2
7 3
8 0
9 1
10 (minimum) 0
4) In 19 cases, the license plates coincided with the rectangle having the third highest F score due to interfer- ence from car mirrors or additional license plates existing in some images.
5) The top three windows with the highest F scores are enough to identify the plate 98% of the time.
Moreover, two more important results were observed through experiments with 1250 pictures shown in Table 2.
6) In about 79% cases, all the license plate letters were completely contained by the rectangle moving window without requiring additional changes of the boundaries.
7) In about 21% cases, the rectangle only partially contained the license plate characters. This is because the actual size of the window will not match the size of the letters at different distances from the camera.
In conclusion, the top 3 detected rectangle windows with highest F scores provide an excellent approximation for where the license plate should be.
5. Conclusion
In this paper, a new method for license plate detection that is especially effective at identifying the general loca- tion of a license plate in un-cropped traffic video was introduced. The top 3 detected window results accurately find the plate more than 98% of the time, and the detected highest scoring window finds the plate 90% of the time or better. All the letters in the plate were precisely contained without requiring additional higher precision methods 78% of the time. The results were scored so that candidates that are most likely to contain a plate can be inspected first.
References
[1] Xu, J.F., Li, S.F. and Yu, M.S. (2004) Car License Plate Extraction Using Color and Edge Information. Proceedings of International Conference on Machine Learning and Cybernetics, Shanghai, 26-29 August 2004, 3904-3907.
http://dx.doi.org/10.1109/ICMLC.2004.1380528
[2] Ahmadyfard, A. and Abolghasemi, V. (2008) Detecting License Plate Using Texture and Color Information. Interna- tional Symposium on Telecommunications, Tehran, 27-28 August 2008, 804-808.
http://dx.doi.org/10.1109/ISTEL.2008.4651410
[3] Yang, Q.W., Yang, C.H., Li, C.H. and Wang, H.Z. (2011) Research on License Plate Detection Based on Salient Fea- ture under Complex Background. 1 Sixth International Conference on Image and Graphics, Hefei, 12-15 August 2011, 609-615. http://dx.doi.org/10.1109/ICIG.2011.59
[image:8.595.185.412.112.308.2][5] Ghazal, M. and Hajjdiab, H. (2013) License Plate Automatic Detection and Recognition Using Level Sets and Neural Networks. 1st International Conference on Communications, Signal Processing, and Their Applications, Sharjah, 12- 14 February 2013, 1-5. http://dx.doi.org/10.1109/ICCSPA.2013.6487280
[6] Becerikli, Y., Olgac, A.V., Sen, E. and Coskun, F. (2007) Neural Network Based License Plate Recognition System.
International Joint Conference on Neural Networks, Florida, 12-17 August 2007, 3057-3061.
http://dx.doi.org/10.1109/IJCNN.2007.4371448
[7] Xia, H.D. and Liao, D.C. (2011) The Study of License Plate Character Segmentation Algorithm Based on Vertical Projection. International Conference on Consumer Electronics, Communications and Networks, Xianning, 16-18 April 2011, 4583-4586. http://dx.doi.org/10.1109/CECNET.2011.5768714
[8] Jagannathan, J., Sherajdheen, A., Deepak, R.M.V. and Krishnan, N. (2013) License Plate Character Segmentation Us- ing Horizontal and Vertical Projection with Dynamic Thresholding. International Conference on Emerging Trends in Computing, Communication and Nanotechnology, Tirunelveli, 25-26 March 2013, 700-705.
http://dx.doi.org/10.1109/ICE-CCN.2013.6528594
[9] Franc, V. and Hlavác, V. (2005) License Plate Character Segmentation Using Hidden Markov Chains. Proceedings of
27th DAGM Conference on Pattern Recognition, Vienna, 30August-2 September 2005, 385-392.
http://dx.doi.org/10.1007/11550518_48
[10] Lin, B., Fang, B. and Li, D.H. (2009) Character Recognition of License Plate Image Based on Multiple Classifiers. In- ternational Conference on Wavelet Analysis and Pattern Recognition, Baoding, 12-15 July 2009, 138-143.
http://dx.doi.org/10.1109/ICWAPR.2009.5207413
[11] Zeng, Y.C. and Chen, J.F. (2010) Adaptive Template-Matching Method for Recognition of Low-Resolution License Number. International Computer Symposium, Tainan, 16-18 December 2010, 228-233.
http://dx.doi.org/10.1109/COMPSYM.2010.5685512
[12] Miao, L.G. (2012) License Plate Character Segmentation Algorithm Based on Variable-Length Template Matching.
IEEE 11th International Conference on Signal Processing, Beijing, 21-25 October 2012, 947-951.
http://dx.doi.org/10.1109/ICoSP.2012.6491736
[13] Wazalwar, D., Oruklu, E. and Saniie, J. (2012) A Design Flow for Robust License Plate Localization and Recognition in Complex Scenes. Journal of Transportation Technologies, 2, 13-21. http://dx.doi.org/10.4236/jtts.2012.21002
[14] Zhang, H.F., Jia, W.J., He, X.J. and Wu, Q. (2006) Learning-Based License Plate Detection Using Global and Local Features. 18th International Conference on Pattern Recognition, Vol. 2, Hong Kong, 1102-1105.
http://dx.doi.org/10.1109/ICPR.2006.758
[15] Kim, K.K., Kim, K.I., Kim, J.B. and Kim, H.J. (2000) Learning-Based Approach for License Plate Recognition. Pro- ceedings of the IEEE Signal Processing Society Workshop: Neural Networking for Signal Processing X, Sydney, 11-13 December 2000, 614-623. http://dx.doi.org/10.1109/NNSP.2000.890140
[16] Suryanarayana, P.V., Mitra, S.K., Banerje, A. and Roy, A.K. (2005) A Morphology Based Approach for Car License Plate Extraction. Annual IEEE INDICON, 11-13 December 2005, 24-27.
http://dx.doi.org/10.1109/INDCON.2005.1590116
[17] Ye, Y.Y., Chen, W.M., Hu, J.D. and Zou, W.B. (2010) Research on Localization Method of Vehicle License Plate Based on Wavelet Analysis. 2nd International Conference on Networking and Digital Society, Wenzhou, 30-31 May 2010, 672-675. http://dx.doi.org/10.1109/ICNDS.2010.5479394
[18] Wu, M.K., Wei, J.S., Shih, H.C. and Ho, C.C. (2009) 2-Level-Wavelet-Based License Plate Edge Detection. Fifth In- ternational Conference on Information Assurance and Security, Xi’an, 18-20 August 2009, 385-388.
http://dx.doi.org/10.1109/IAS.2009.295
[19] Li, X.P., Lv, X.X., Wang, S.Z., Zhang, L., Li, Y.X. and Dong, H.J. (2010) Research on the Recognition Algorithm of the License Plate Character Based on the Multi-resolution Template Matching. 4th International Conference on New Trends in Information Science and Service Science, Gyeongju, 11-13 May 2010, 341-344.
[20] Dlagnekov, L. and Belongie, S. UCSD/Calit2 Car License Plate, Make and Model Database.
http://vision.ucsd.edu/car_data.html
[21] Hsieh, C.T. and Juan, Y.S. (2005) Wavelet Transform Based License Plate detection for Cluttered Scene. WSEAS Transactions on Computers, 4, 30-33.