An Efficient Transmission Scheduling and
Synchronization Algorithm for Border Node Problem
in Wireless Sensor Network
Shweta Agarwal
M.Tech in Computer Science, GWECA, Ajmer,
RTU, Kota
Varsha Jain
M.Tech in Computer Science, GWECA, Ajmer, RTU, Kota
Kuldeep Goswami
Assistant Professor, GWECA, Ajmer, RTU, KotaABSTRACT
Recent developments in wireless technology have provided rapid progress in real time wireless sensor network technology, for time critical applications such wearable health care devices weather prediction and traffic monitoring etc. the communication in wireless networks is much difficult than wired networks, because of complexity in synchronization caused by wireless environment such as non-visibility etc. hence they have greater packet loss, traffic congestion and uneven load distribution which causes specific (especially border nodes) which quickly drains the power of these nodes. To withstand with such situations this paper presents an efficient scheduling algorithm which maintain the synchronization and manages transmission schedule among the nodes thus it provides better quality of service and uniform load distribution. The presented system maintains the synchronization by taking into account the congestion situation like packets remaining in the transmitting queue in the nodes and the searching for new available nodes. Simulation results verifies the better performance of the proposed protocol.
General Terms
Transmission scheduling, Synchronization Algorithm.
Keywords
Wireless sensor network (WSN), Node Scheduling, Transmission synchronization.
1.
INTRODUCTION
Recent advances in wireless sensor networks, increases its applicability in many unconventional areas such as biomedical applications, Security systems and real time monitoring system. Now the WSN technologies are gaining applications on the continuous monitoring. A Wireless Sensor Networks (WSNs) include a group of sensors with wireless communication networks and technologies. A WSN finally composed of a collection of wireless networked low Power sensors integrated with a built-in microprocessor, a radio and a limited Amount of memory.
Generally, these sensors are placed on the monitoring environments such weather balloons, under the ground etc. to allow best reach of sensors to the various monitoring parameters without affecting the environmental condition, another application of Wireless Sensors is in monitoring the physical conditions in real time and transmit it to the collection center. WSN can be also used in various managerial fields, such as in a office for monitoring workers, staff and clients, surveying applications such as Home monitoring and,
help the disabled persons in their daily Activities. Because of such a wide application areas the standard protocols of WSN does not provide efficient performance for all systems hence some modifications are required to maintain the quality of service. Presently many different approaches on different layers of network have been already published to overcome different problems associated with specific type of application, this paper especially focuses on the problem of scheduling to reduce the network congestion and maintaining the uniform load distribution with transmission schedule management to protect border node from quickly draining their power. The congestion occurs, because of the packet loss (by collision due to increased accessing of channel by nodes) which causes the increased packet retransmission accordingly and retransmission directly affects the lifespan of the nodes which have limited battery power, which in turn reduces the total network lifespan. From the discussion it is clear that the root cause of congestion is collision which is caused by increased and continuous accessing of channel by all the nodes.
The problem get worse in the real time monitoring network where the data is generated at constant rate and needed to be transmitted without any delay. Rest of the paper is organized as that the second section provides a brief review on the relevant literature on same topic. Third section presents the basic WSN structure while fourth section explains the proposed algorithm followed by the simulation results and conclusion in fifth and sixth section respectively.
2.
LITERATURE REVIEW
transmitting still images on a multi-hop network. Their literature present results of experimentations with real sensor boards and radio modules. Finally the main sources of delays are identified assuming no flow control nor congestion control to determine the best case performance level. Optimal Scheduling in Duty-Cycled Industrial IoT (Industrial Internet of Things) Applications presented in [3], they derive optimality and bounds on the minimum number of needed active slots (impacting end-to-end delays) and the network duty-cycle (impacting lifetime) for Traffic Aware Scheduling Algorithm (TASA).Healthcare Aware Optimized Congestion Avoidance (HOCA) and control protocol is presented in [5]. HOCA uses a data centric congestion management protocol using AQM (Active Queue Managements) with respect to the inherent characteristics of these applications. HOCA avoids congestion in the first step (routing phase) using multipath and QoS (Quality of Service) aware routing. And in cases where congestion cannot be avoided, it will be mitigated via an optimized congestion control algorithm. A Cross-Layer Optimal Design is proposed by Mingwei Li et al [9], they proposed an optimized technique taking amount of limited computational power, storage capability and energy in WSN. To save the energy in WSNs and prolong the network lifetime, they design the signal control input, routing selection and capacity allocation by the optimization model based on compressed sensing (CS) framework.
3.
WIRELESS SENSOR NETWORK
Sensor networks are the used to collecting the information needed for environments observations, whether monitoring utilities, industrial, home, transportation systems and automation etc. Recent it gains the applicability in disaster management system and guerilla warfare countermeasures which require distributed networks of sensors without any supporting infrastructures (because in such applications, running wires or cabling or providing infrastructure is usually impractical) that can be deployed using, e.g. aircraft, and have self-organizing capabilities. A sensor network is required that is fast and easy to install and maintain.Wireless sensor networks satisfy these requirements. Characteristics of the wireless sensor network include: simple installation, self-identification and organization, self-diagnosis, reliability, coordination with other nodes, some processing capabilities such as DSP (Digital Signal Processing), and standard control protocols and network interfaces.
3.1
Congestion in WSN
[image:2.595.316.566.71.384.2]In WSN every node senses and generates data at a particular rate, to which other sensor nodes forward using multi-hop communication to a single sink. As the load increases above a certain limit, loss rates quickly increase (follows exponential characteristics). The losses can be due to wireless channel errors from losses caused by a lack of buffer space at a sensor node. Generally the channel losses dominate buffer drops and increase quickly with after certain load. This dramatic increase in loss rates is considered as an indication to congestion collapse. Another congestion collapse is due to traffic from nodes one hop away from the sink. It is observed that as the offered load increases, a smaller number of nodes acquire an un-proportionately large portion of bandwidth.
Fig 1: Structure of the WSN with Internet accessibility [13].
Fig 2: Effect of Traffic Load on Packet Drop Rate.
[image:2.595.314.568.407.665.2]4.
PROPOSED ALGORITHM
The working of the proposed algorithm can be described as follows.
The proposed method synchronizes the transmitting slots of each nodes on the basis of their in waiting packet queue size. In the proposed system each node which is currently transmitting provides the chance to one of the surrounding nodes on the basis of nodes queue size, by adding its id at the end of the packet.
Step 1: Let there be N number of nodes in the network. Step 2: At the starting all nodes are unknown to each other’s hence they have no information about others.
Step 3: At this stage the communication starts normally depending upon the routing method they used except that the header of the used method is modified and two additional field is added one stores the next node id and other stores the queue length of its own.
Sender
Id Normal Frame Fields
Self-
Queue-Size
Next- Node-Id
Figure shows the added fields, Self-Queue-Size and Next-Node-Id.
Step 4: since at the start the node which is currently transmitting does not have any information about the queue size of other nodes it put the “0” in the second field.
Step 5: now when other receive this frame they reads the senders id and sender’s self-queue-length and maintain a table.
Node ID Queue Length
-- --
-- --
-- --
[image:3.595.310.547.69.236.2]-- --
Table 1: at the initial stage.
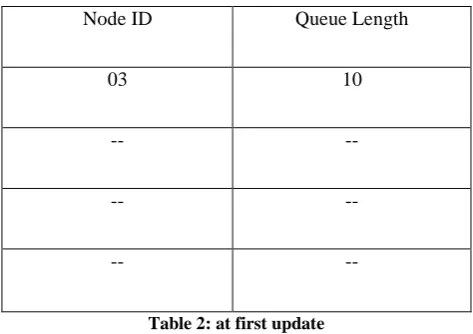
Let a frame is received with Sender Id =3, Self-Queue-Size =10, Next-Node-Id=0, then all nodes reads these field and since the second field is “0” they will simply ignore it and store the second field value in the table
Node ID Queue Length
03 10
-- --
-- --
-- --
Table 2: at first update
From here we can say that after some time the node will gain information about their neighbors.
Node ID Queue Length
03 10
07 12
08 03
[image:3.595.310.548.277.429.2]02 20
Table 3: after some time.
Step 6: after getting sufficient information the nodes can now give the chance to the node with the highest queue length to avoid buffer overflow. From the above table its 02.
Sender
Id Normal Frame Fields 20 02
Step 7: when the other users receive this frame they avoid transmission for the next time slot because the frames second field is saying that it’s the node “02” turn. This will reduce the chances of collision.
Step 8: to avoid the dead lock between two nodes the second field is left empty for 10% of frames.
5.
SIMULATION RESULTS
The proposed algorithm is tested for different scenarios and the simulated results are presented in tabular and graphical form in this section.
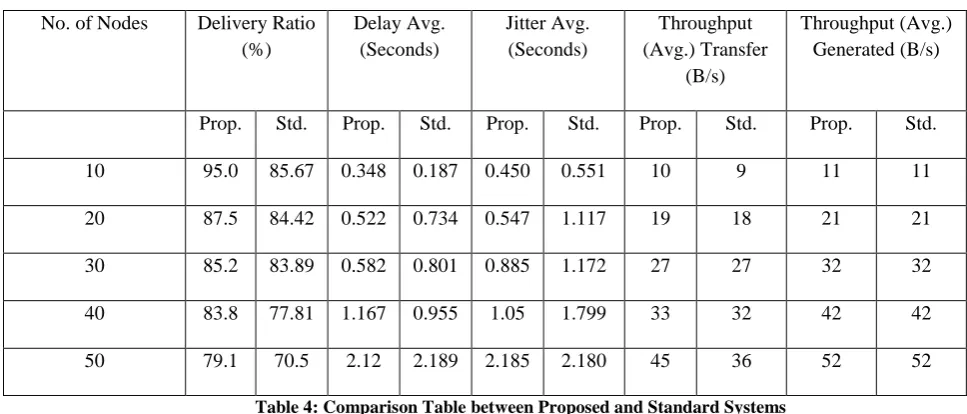
Scenario 1: Results for Different Number of Nodes Number of nodes = 10, 20, 30, 40, 50
[image:3.595.50.288.287.344.2] [image:3.595.49.287.464.607.2]No. of Nodes Delivery Ratio (%)
Delay Avg. (Seconds)
Jitter Avg. (Seconds)
Throughput (Avg.) Transfer
(B/s)
Throughput (Avg.) Generated (B/s)
Prop. Std. Prop. Std. Prop. Std. Prop. Std. Prop. Std.
10 95.0 85.67 0.348 0.187 0.450 0.551 10 9 11 11
20 87.5 84.42 0.522 0.734 0.547 1.117 19 18 21 21
30 85.2 83.89 0.582 0.801 0.885 1.172 27 27 32 32
40 83.8 77.81 1.167 0.955 1.05 1.799 33 32 42 42
[image:4.595.55.539.67.274.2]50 79.1 70.5 2.12 2.189 2.185 2.180 45 36 52 52
Table 4: Comparison Table between Proposed and Standard Systems
Fig 3: plot of the table data for number of nodes Vs. Packet Delivery Ratio.
[image:4.595.50.574.331.657.2]Fig 4: plot of the table data for number of nodes Vs. Average Delay.
Fig 5: plot of the table data for number of nodes Vs. Average Jitter.
Fig 6: plot of the table data for number of nodes Vs. Throughput.
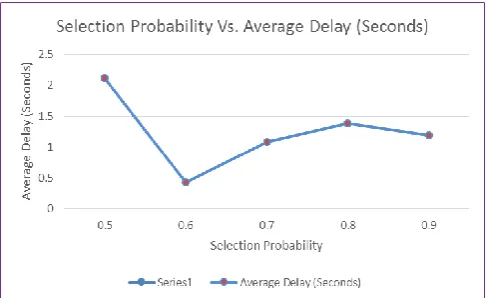
Scenario 2: Results for Different Algorithm Switching Probability = 0.5, 0.6, 0.7, 0.8, 0.9
SEL_PROB Delivery Ratio (%)
Delay Avg. (Seconds)
Jitter Avg. (Seconds)
Throughput (Avg.) Transfer
(B/s)
Throughput (Avg.) Generated (B/s)
0.5 79.1 2.12 2.185 45 52
0.6 86.33 0.432 0.437 45 52
0.7 82.5 1.08 0.537 43 52
0.8 78.41 1.383 0.540 38 52
[image:5.595.54.293.293.443.2]0.9 74.38 1.187 0.557 40 51
Table 5: Proposed Technique for different values of Algorithm Switching Probability
Fig 7: plot of the table 2 data for Selection Probability Vs. Delivery Ratio.
Fig 8: plot of the table 2 data for Selection Probability Vs. Delivery Ratio (%).
6.
CONCLUSION
This paper presents an effective algorithm for scheduling and synchronization of transmission for WSN the simulation of the presented algorithm is performed on NS2 simulator for different conditions and the results shows that the proposed algorithm out performs the standard algorithm by sufficient margin on different parameters (such as it increases the packet
delivery ratio by 20% and throughput by 25% at higher number of nodes), without affecting the jitter and delay. The simulation results also shows that traffic distributed evenly over all the nodes hence no border node power drainage occurs. The analysis also shows that the selection probability must be chosen optimally to achieve the best performance. However the development of optimal selection probability algorithm has been leaved for future work.
7.
REFERENCES
[1] Haitao Zhang, Huadong Ma, Xiang-Yang Li, Senior, Shaojie Tang “In-Network Estimation with Delay Constraints in Wireless Sensor Networks”, Parallel and Distributed Systems, IEEE Transactions on (Volume: 24, Issue: 2) Feb. 2013.
[2] Congduc Pham, Vincent Lecuire and Jean-Marie Moureaux “Performances of Multi-Hops Image Transmissions on IEEE 802.15.4 Wireless Sensor Networks for Surveillance Applications”, Wireless and Mobile Computing, Networking and Communications (WiMob), 2013 IEEE 9th International Conference on 7-9 Oct. 2013.
[3] Maria Rita Palattella, Nicola Accettura, Luigi Alfredo Grieco, Gennaro Boggia, Mischa Dohler and Thomas Engel “On Optimal Scheduling in Duty-Cycled Industrial IoT Applications using IEEE802.15.4e TSCH”, Sensors Journal, IEEE (Volume:13 , Issue: 10 ) Oct. 2013. [4] Mohammad Hossein Yaghmaee, Nazbanoo Farzaneh
Bahalgardi, Donald Adjeroh “A Prioritization Based Congestion Control Protocol for Healthcare Monitoring Application in Wireless Sensor Networks”, Wireless Personal Communications October 2013, Volume 72, Issue 4, Springer.
[5]Abbas Ali Rezaee, Mohammad Hossein Yaghmaee, Amir Masoud Rahmani and Amir Hossein Mohajerzadeh “HOCA: Healthcare Aware Optimized Congestion Avoidance and control protocol for wireless sensor networks”, Journal of Network and Computer Applications 37 (2014) 216–228, ScienceDirect. [6] Jiao Zhang, Fengyuan Ren, and Chuang Lin, Tsinghua
[image:5.595.54.298.488.637.2][7] Abbas Ali Rezaee, Mohammad Hossein, Yaghmaee Amir and Masoud Rahmani “Optimized Congestion Management Protocol for Healthcare Wireless Sensor Networks”, Wireless Personal Communications March 2014, Volume 75, Issue 1, pp 11-34, Springer.
[8] Cecile Kateretse, Ga-Won Lee, Eui-Nam Huh “A Practical Traffic Scheduling Scheme for Differentiated Services of Healthcare Systems on Wireless Sensor Networks”, Wireless Personal Communications July 2013, Volume 71, Issue 2, pp 909-927, Springer.
[9] Mingwei Li, Yuanwei Jing and Chengtie Li “A Robust and Efficient Cross-Layer Optimal Design in Wireless Sensor Networks”, Wireless Personal Communications October 2013, Volume 72, Issue 4, pp 1889-1902, Springer.
[10] F. L. LEWIS “Wireless Sensor Networks”, To appear in Smart Environments: Technologies, Protocols, and Applications ed. D.J. Cook and S.K. Das, John Wiley, New York, 2004.
[11] Jennifer Yick, Biswanath Mukherjee, Dipak Ghosal “Wireless sensor network survey”, Computer Networks Volume 52, Issue 12, 22 August 2008, Pages 2292–2330, ScienceDirect.
[12] Daniele Puccinelli and Martin Haenggi “Wireless Sensor Networks: Applications and Challenges of Ubiquitous Sensing”, IEEE CIRCUITS AND SYSTEMS MAGAZINE THIRD QUARTER 2005.
![Fig 1: Structure of the WSN with Internet accessibility [13].](https://thumb-us.123doks.com/thumbv2/123dok_us/8042182.771701/2.595.314.568.407.665/fig-structure-wsn-internet-accessibility.webp)