Analysis of Data Quality and Performance Issues in Data
Warehousing and Business Intelligence
Nikhil Debbarma
Department of Computer Science and Engineering
National Institute of Technology,Agartala, India
Gautam Nath
Department of Computer Science and Engineering
National Institute of Technology,Agartala, India
Hillol Das
Department of Computer Science and Engineering
National Institute of Technology,Agartala, India
ABSTRACT
A Data Warehouse is an integral part of those enterprises which want to have a clear business insights from customer and operational data. It includes collection of technologies aimed at enabling the knowledge worker (executive, manager, analyst) to make better and faster decisions. It is expected to present the right information in the right place at the right time with the right cost in order to support the right decision. Over the years ,the practice of Data warehousing proved that the traditional online Transaction Processing (OLTP) systems are not fully appropriate for decision support. From the survey and evaluation of the literature related to Data Warehouse and with consultation and feedback of the data warehouse practitioners working in renowned IT giants ,it has been observed that the fundamental problems arise in populating a warehouse with quality data. . This paper mainly focuses on the study of the issues that hinder the data quality and performance of the Data warehouse and some of the means that may be opted to realize a better performance with respect to accuracy and quality to meet the challenging and dynamic needs of the corporate world.
Keywords
Data Warehouse(DW), Data Profiling, OLTP , Data Quality (DQ) , ETL
1.
INTRODUCTION
The IT industry has recorded phenomenal growth over the last decade which in turn led to a proportionate growth of data volume. So efficient management of the historical and operational volume of data has become extremely important. The quality of the data arriving in the dat a warehouse is primarily based on exception . M any a times it has been observed that inspite of incorporating quality measures incorrect data are still found to prevail in the targeted data warehouse.
1.1
Impact of Erroneous Data
M any organizations these days have to contend with poor data quality which ultimately results in poor decision-making. After all, decisions are no better than the data on which they are based. Reliable, relevant, and complete data supports organizational efficiency and is a cornerstone of sound decision-making.
Poor quality data could be an obvious reason for the malfunctioning and operational inefficiency of an organization. The negative implications of poor data can be felt in terms of decreased customer satisfaction and trust ,
high running costs , poor business decision and performance, lowered employee job satisfaction and reliability (Leo et al. [1]; Kahn et al.[2]; Redman[3]).
A further survey disclosed some more negative impacts of poor data quality which includes - increase in cost due to data maintenance, data correction and re-run of jobs demanding extra resources, time and effort ; inefficient business analysis due to inconsistent reports and unavailability of timely data can result in lost business opportunities ; fines imposed for noncompliance with government regulations ; wrong shipping of products to customers; bad public relations with customers leading to lost customer(Seth[4]).
1.2
Cost of Erroneous Data
The industrial application and exploitation of huge amounts of data is playing an ever increasing role in the working of modern economy, government, and research. So any kind of anomalies and impurities in data could avert its effective utilization, disabling high performance accurate processing of the results and conclusions gained by data interpretation and analysis could lead to faulty decisions once the data warehouse is polluted with bad data. Every year, a large number of data warehousing initiatives seems to fail because of erroneous or incomplete data. A few of the summary points has been quoted below from M arsh[5] inorder to put forward the adversities of erroneous data.
“88% of all the data integration projects has been reported to have either over-run their budgets or have met a complete failure. ”
“75% organizations have identified costs stemming from dirty data.”
“33% of organizations have delayed or cancelled new IT systems because of poor data.”
“$611bn per year is lost in the US in poorly targeted mailings and staff overheads alone.”
"Business intelligence (BI) projects often fail due to dirty data, so it is imperative that BI-based business decisions are based on clean data."
1.3
Attributes of Data Quality
of data quality dimension and Singh et al.[8] has grouped a list of six primary dimensions as described below.
Completeness: It refers to the expected availability of the data. It is possible that data is not available, but it may be still considered to be complete, as it meets the expectations of the user. Every data requirement has 'mandatory' and 'optional' aspects. For example a Customer's mailing address is mandatory and it should be available but because customer’s office address is optional, it is ok if it is not available.
Consistency: Consistency of Data means that data across the enterprise should be in synch with each other and should not provide conflicting information. For examples a credit card is cancelled, and inactive, but the card billing status shows 'due'. Such kind of inconsistent data across data sets should not prevail.
Validity: Data Validity means the correctness and reasonableness of data. For example a bank account number should fall within a specific range, numeric data should be all digits, dates should have a valid month, day and year and the spelling of names should be proper.
Integrity: Data integrity verifies that data has remained unaltered in transit from creation to reception. Appropriate relationship linkages among records are very important else it might introduce unnecessary duplication throughout the systems.
Conformity: This dimension verifies whether data is expected to adhere to certain standards and also how well it’s represented in an expected format. For example date may be represented either as 'dd/mm/yyyy' format or as 'mm/dd/yyyy' format. So conformance to specific data format is essential.
Accuracy: Checks for the accurate representation of the real world values. For example the bank balance in the customer's account is the real value that the customer deserves from the Bank. Any inaccuracy in the existing data can have a worse impact on the operational and analytical applications.
1.4
Steps in Data Warehousing Process
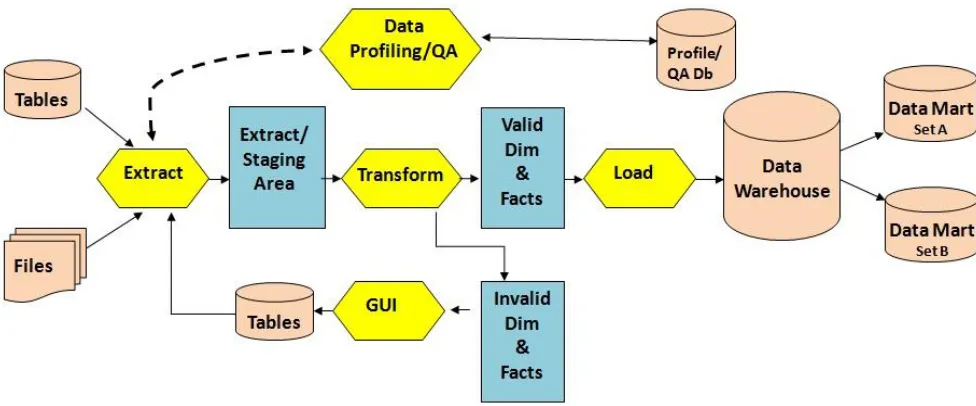
ETL comes from Data Warehousing and stands for Extract -Transform-Load. ETL covers a process of how the data are loaded from the source system to the target data warehouse. ETL is used basically to migrate data from one or more databases (of same or different types) to another centralized Data Warehouse (having standard formats for all data) and also to form Data M arts. Data mart is a subset of the Data Warehouse that is usually oriented to a specific subject. Splitting of Data Warehouse into Data M arts ensures faster access of data because of their minimal data load. The details of the steps has been covered in Kimball et al.[9] and described below with the help of figure 1.
Extract: The "Extract" task involves gathering data from external sources that needs to be brought to the required systems and databases. In a company, the data might be found in stand-alone databases or spreadsheets that aren't integrated with any master database. The data might even be hard-copy or could be data that have been purchased from a data provider. The goal of this task is to understand the format of the data, assess the overall quality of the data and to extract the data from its source so that it can be manipulated in the next task.
Transform: In the "Transform" step, a variety of software tools and even custom programming are used to manipulate the data so that it integrates with data that is already present . For example, consider a system that identifies males with an "M" and females with an "F." If the extracted data from an external source identifies males with a "1" and females with a "2," then there is a need to transform the data by converting the "1" to an "M " and the "2" to an "F" so that it matches up with the data that currently resides in the databases and systems.
[image:2.596.72.546.534.727.2]Load: After the successfully transformation of the source data it is required to physically load it into the target system or database. Before loading the data, it is required to make sure that there is a backup of the current system so that roll back or undo can be initiated in case of failure of the Load process. After loading the data, it's common to run audit reports so that there can be review of the results of the merged databases and systems to make sure the new data hasn't caused any errors or problems.
2.
RELATED WORK
2.1
Steps Susceptible to Data Quality
Proble m
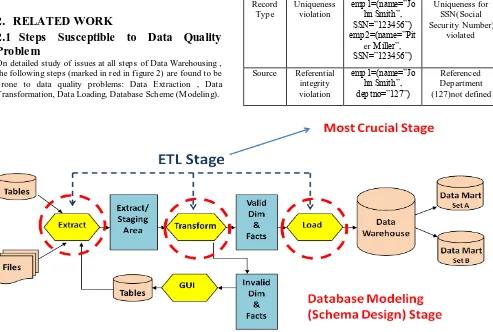
On detailed study of issues at all steps of Data Warehousing , the following steps (marked in red in figure 2) are found to be prone to data quality problems: Data Extraction , Data Transformation, Data Loading, Database Scheme (M odeling).
Data is impacted by numerous processes that bring data into the data environment, most of which affect its quality to some extent. All these phases of data warehousing are responsible for data quality in the data warehouse. In the event of data being incorrectly entered in the data warehouse, it is incumbent on the architect to find the offending ETL program and make adjustments. But occasionally, even with the best of ETL processing, a few pieces of incorrect data enter the data warehouse environment. Some ways on how should the architect handle incorrect data in the data warehouse is discussed under the section "Incorrect Data in the Data Warehouse" from Inmom[10].The residual dirty data should be reported, stating the reasons for the failure in data cleansing for the same. Data quality problems can occur in many different ways as has been elaborated under "Classification of Data Quality Issues" from Singh et al.[8]. Data Quality Issues During Extraction Phase :
(1)Heterogeneous data sources having own storage methods. (2)Imperfect Schema level definition
Table 1. Table to forecast the data issues at schema level referred from Haug et al.[6]
S cope/Problem Dirty Data Reason/Remark
Attribut e
Illegal Values
bdate=30.13.70 Values outside of domain range Record Violated
dependency
age=22,bdate=12. 02.70
age=(current date-birth date)
Record Type
Uniqueness violation
emp1=(name=”Jo hn Smith”, SSN=”123456”) emp2=(name=”Pit
er M iller”, SSN=”123456”)
Uniqueness for SSN(Social Security Number)
violated
Source Referential integrity violation
emp1=(name=”Jo hn Smith”, deptno=”127”)
Referenced Department (127)not defined
[image:3.596.58.551.73.405.2](3) Imperfect Instance data
Table 2. Table to forecast the data issues at instance level referred from Haug et al.[6]
S cope/Problem Dirty Data Reason/Rema
rk
Attribu te
M issing values
phone=9999-999999
Unavailable values during data
entry (dummy values or null) M isspellings city=”Liipzig” Usually typos,
Phonetic errors Cryptic
Values, Abbreviation
experience=”B”; occupation=”DBPro
g”
Embedded Values
name=”J.Smith 12-02-70 New York ”
M ultiple values entered in one attribute(e.g in
a free-form
field) M isfielded
Values
[image:3.596.290.556.487.764.2]Record Violated attribute dependency
city=”Redmond”, zip=77777
City and Zip code should correspond Record
Type
Word transposition
name1=”J.Smith”, name2=”Miller P.”
Usually in a free-form
field Duplicated
Records
emp1= (name=”John
Smith”,.) emp2= (name=”J.Smith”,..)
Same employee represented twice due to
some data entry errors. Contradictin
g records
emp1= (name=”John
Smith”, bdate=12.02.70)
emp1= (name=”John
Smith”, bdate=12.12.70)
The same real world entity is described by different
values.
Source Wrong references
emp1= (name=”John
Smith” ,deptno=17)
Referenced department (17) is defined
but wrong
(4)Insufficient source data analysis (5)Undocumented alterations
Data Quality Issues During Tran sformation Phase :
(1)Insufficient source data analysis (2)Undocumented alterations
(3)Sometimes the business rules applied on data sources may cause for quality problems.
(4)Unhandled null values in ETL process cause data quality problems
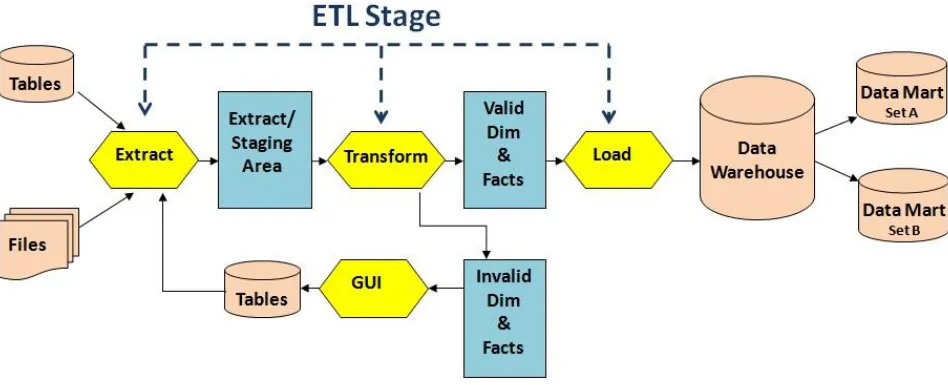
(5)Inaccurate conditional statements force the valid data to move to the invalid tables. Such records are then corrected through a GUI application and then reprocessed in the next day cycle. This process consumes much of the processing time and reduces the overall throughput of the system.
Data Quality Issues During Load Phase :
(1) Lack of periodical refreshment of integrated data cause for data quality problems
(2) Wrong mapping of data leading to data being erroneous. M isinterpreting/Wrong implementation of the slowly changing dimensions (SCD) strategy in ETL phase causes massive data quality problems.
(3) Lack of error reporting, validation, and metadata updates in ETL process cause data quality problems.
(4) Inappropriate handling of rerun strategies during ETL causes data quality problems.
Data Quality Issues During Database Modeling (Schema Design) Phase :
(1) In complete or wrong requirement analysis for schema design.
(2) Late arriving dimensions cause DQ Problems. (3) M ultivalued dimensions cause DQ problems.
(4) Late identification of slowly changing dimensions contribute to data quality problems.
2.2
Ongoing countermeasure
A survey of various techniques have been undertaken for addressing the duplicate data problem from Ahmed et al.[11], Data Cleaning as proposed in Rehm et al.[12] and Ali et al.[13] , rule-based taxonomy from Li et al.[14], Heterogenous Data Quality M ethodology (HDQM ) from Carlo et al.[15] , metamodel extension to CWM in Gomes et al.[16] ,Data Profiling in Sankar et al.[17] and DeM aio [18].Here in this paper focus has been given primarily on exploring and extending the benefits of Data Profiling.
Data Profiling : The use of analytical techniques on data for the purpose of developing a thorough knowledge of its content , structure and quality.Data profiling is the surveying of the source data landscape to gain an understanding of the condition of the data sources. It is a process of developing information about data instead of information from data. For example the range of values of unit price of products lies between 99.99 to 1499.99 and this is called information about data or Data Profiling. In most profiling efforts , this means
generating various reports with any number of metrics, statistics, and counts that reflect the quality of the source data coming in.
Collection of documentation and define the issues.
Reviewing of the data itself to measure weight/impact . through comparison with available documentation.
Identification and analysis of detail specific issues.
Review of the issues ,definitions and weights.
If issues discovered then what are those issues.
Analyse the relative importance of each issue with the help of subject matter expert and address those issues.
The above steps are repeated as a part of maintainence with periodic reviews till a satisfactory result is obtained.
The Profiler identifies and reviews the issues and impacts.The findings gives idea about the quality of data in the source.Documented reports and/or charts (as shown in Table 3 and figure 4) can also be obtained from the results database and Quality Assessment Score can be decided. B ased on the quality assessment the necessary steps can be taken for data quality improvement.
Table 3. Data Profiling output in the form of findings chart cited from DeMaio [18].
Issue Type Issues
Discovered
Possible Issues
Constants 1 59
Definition M ismatches 4 59
Filler Containing Data 1 59
Inconsistent Cases 3 59
Inconsistent Data types 15 59
Inconsistent Null Rules 6 59
Invalid Keys 1 3
Invalid Values 1 59
M iscellaneous 10 59
M issing Values 18 59
Orphans 2 2
Out of Range 3 59
Pattern Exceptions 10 59
Potential Constants 1 59
Potential Defaults 1 59
Potential Duplicates 3 59
Potential Invalids 4 59
Potential Redundant Values 21 59
Potential Unused Fields 1 59
Rule Exceptions 3 3
Unused Fields 1 59
110 1070
Raw S core 89.7%
Data profiling as referred from Oracle Documentation[19] enable the assessing of quality of the source data before the data is being used in data warehousing process or other data integration scenarios.The on going scenario of the usage of profiler is shown in figure 5 . The profiling process in many cases is only practised during the extraction phase for correcting the source level data as a corrective measure to stop
erroneous data from flowing out in the successive phases of the Data Warehousing process.
[image:5.596.323.490.111.649.2] [image:5.596.47.288.344.669.2]likely to be detected during the testing phase conducted initially but still many a times post implementation errors crop up and as a result of which lots of time ,effort and money has to be spent for fixing up data problems.
3.
PROPOSED FUTURE WORK
[image:6.596.56.544.69.272.2]Effective Profiling : In order that the data quality issue does not crop up in the subsequent phases of the data warehousing process it is necessary to introduce the profiling mechanism at all the check points wherein there can be possibilities of data quality being corrupted .So an ideal solution must devise mechanism for the application of profilers at all the phases of the data warehousing life cycle process as shown in figure 6. Although the data profiling process can slow down the performance and consume lots of effort and money but still on a long run this effort saves a lot of future effort and money wasted on the maintenance efforts and provides better decision making for the organization. The exponential growth curve as shown in figure 7 describes the growth of project
[image:6.596.317.557.323.494.2]Fig 5 : On Going S cenario of Data Profiling Usage .
Fig 7 : Projection of cost to time for addressing issues.
[image:6.596.63.554.535.734.2]cost with the progress in time and so the wise decision would be to cut down the number of issues through the extensive use of profilers or a better approach what so ever.
Physical Design : Design of improved profiling tools to obtain feedback (both quality and p erformance factors) could be planned. This would probably ensure a tradeoff between quality and performance.
Query processing and Query optimization : Selecting appropriate summary tables or views , use of optimized transformations and faster search strategies could boost up the performance.
4.
CONCLUSION
In this paper an initial focus has been made on the understanding of the data quality, its dimensions with appropriate examples and some statistics regarding the adverse impact on an organization when erroneous data gets migrated to the target data warehouse from the incoming source systems. Later a summarized analysis has been made to unearth some of the root causes leading to erroneous data and the application of profilers as a remedial measure. An effective profiling mechanism has been proposed as a scope for future work wherein researchers can draw their attention. Irrespective of other research papers in this area , this paper made a necessary attempt to provide clear understanding based on summarized diagrammatic and statistical data as referred from the work of various authors. All kinds of research activities on the subject of data quality improvement with regards to the performance critieria will certainly open new dimensions for the practitioners of Data Warehouse to build a much better performing and cost effective decision support system.
5.
ACKNOWLEDGEMENT
Thanks to Almighty Lord Krishna for everything. Also thanks goes to the Data Warehousing and Business Intelligence (DWBI) Department of Cognizant Technology Solutions India Pvt. Ltd. for the knowledge obtained as a part of industrial exposure.
6.
REFERENCES
[1] Leo, L., Pipino, L. Yang, W. L., & Wang, R. Y. (2002). Data quality assessment. Communications of the ACM , 45(4), 211-218.
[2] Kahn, B., Strong, D., & Wang, R. (2003). Information quality benchmarks: Product and service performance. Communications of the ACM , 45, 184-192.
[3] Redman, T.C. (1998). The impact of poor data quality on the typical enterprise. Communications of the ACM , 41(2), 79-82.
[4] Sanjay Seth,Senior Architect with the Business Intelligence Practice of a leading IT consulting firm, Article on "Data Quality Assessment Approach”,Page-4,http:// hosteddocs.ittoolbox.com/ ss052809.pdf
[5] Marsh, R. (2005). Drowning in dirty data? It’s time to sink or swim: A four-stage methodology for total data quality management. Database M arketing & Customer Strategy M anagement, 12(2), 105–112.
[6] Anders Haug, Frederik Zachariassen, Dennis van Liempd, The costs of poor data quality,Journal of Industrial Engineering and M anagement JIEM , 2011 – 4(2): 168-193 – Online ISSN: 2013-0953.
[7] Wang, R. Y., Storey, V. C., & Firth, C. P. (1995). A framework for analysis of data quality research. IEEE Transactions on Knowledge and Data Engineering, 7(4), 623–640.
[8] Ranjit Singh, Dr.Kawaljeet Singh (2010),"A Descriptive Classification of Causes of Data Quality Problems in DataWarehousing", Vol. 7, Issue 3, No 2, M ay 2010. [9] R. Kimball and J. Caserta, The Data Warehouse ETL
Toolkit: Practical Techniques for Extracting, Cleaning, Conforming, and Delivering Data.John Wiley & Sons, 2004.
[10] W.H.Inmom,Building The Data Warehouse 3rd Edition,Chapter 2,Page :76-77 John Wiley & Sons,2003. [11] Ahmed K. Elmagarmid, Panagiotis G. Ipeirotis and Vassilios S. Verykios“Duplicate Record Detection: A Survey” IEEE Transactions on Knowledge and Data Engineering, Vol. 19, no. 1, january 2007.
[12] Erhard Rahm , Hong Hai Do,"Data Cleaning: Problems and Current Approaches", University of Leipzig, Germany.
[13] Kamran Ali and M ubeen Ahmed Warraich, A framework to implement Data Cleaning in Enterprise Data Warehouse for Robust Data Quality, International Conference on Information and Emerging Technologies (ICIET), 2010.
[14] Li, Lin, Peng, Taoxin and Kennedy, Jessie (2010) A rule based taxonomy of dirty data. In: Proceedings of Annual International Academic Conference on Data Analysis, Data Quality and M etadata M anagement. GSTF, Singapore. ISBN 978-981-08-6308-1.
[15] Batini Carlo, Barone Daniele, Cabitza Federico and Grega Simone, A DATA QUALITY M ETHODOLOGY FOR HETEROGENEOUS DATA, International Journal of Database M anagement Systems ( IJDM S ), Vol.3, No.1, February 2011.
[16] Pedro Gomes,José Farinha and M aria José Trigueiros, A data quality metamodel extension to CWM ,Proceeding APCCM '07 Proceedings of the fourth Asia-Pacific conference on Comceptual modelling - Volume 67. [17] M aunendra Sankar Desarkar,"Data Profiling for ETL
Processes", Indian Institute of Technology, Kanpur,India. [18] Art DeM aio ,Evoke Software,VP Technical Sales Support,"Understanding Data Quality Issues : Finding Data Inaccuracies"
![Table 3. Data Profiling output in the form of findings chart cited from DeMaio [18].](https://thumb-us.123doks.com/thumbv2/123dok_us/8064918.777554/5.596.323.490.111.649/table-data-profiling-output-findings-chart-cited-demaio.webp)