© 2016, IRJET | Impact Factor value: 4.45 | ISO 9001:2008 Certified Journal | Page 1093
APPLICATION OF SWAT MODEL IN GENERATING SURFACE RUNOFF
FOR BENNIHALLA RIVER BASIN
Madhusudhan M.S
1, A. V. Shivapur
21
M.tech Student, Dept. of Water and Land Management, CPGS, VTU Belagavi, Karnataka, India
2Professor, Dept. of Water and Land Management, CPGS, VTU Belagavi, Karnataka, India
---***---Abstract -
Surface runoff is a major component of thehydrological cycle and it is a prime source to satisfy the needs of human being. Hence managing this becomes is very important and it is possible through the conservation of soil and water on a certain scale such as watershed. In India, data availability on surface runoff is very limited. Hence there is a need to estimate the surface runoff at the desired location on watershed. In order to do this, the Distributed Hydrological Model SWAT (Soil & Water Assessment Tool) is often used to estimate the surface runoff. The authors have made an attempt to demonstrate the estimation of the annual discharge values for the point selected on a river stretch using SWAT model. The performance evaluation of model is done by Regression co-efficient (R2) and Nash and Sutcliffe Efficiency
(NSE).
Key Words: Hydrologic model, SWAT, Regression co-efficient, Nash and Sutcliffe Efficiency.
1.
INTRODUCTION
Water is one of the natural resource that India receive through nature. The average annual rainfall of the country is estimated to be around 1083 mm (as per 2014 estimates). On an average, India receives annual precipitation of about 4000 km3 including snowfall. However, the distribution of
rainfall throughout the country is not same, it varies from place to place and also from time to time. It is estimated that out of the 4000 km3 water, 1869 km3 is the average annual
potential which flow in rivers available as water resource. Out of the total water resource available, only 1123 km3 is
usable. Of this 1123 km3 of available water resources, the
surface water resources is 690 km3 and the ground water
resources is of about 433 km3[1].
Most of this water resources flows through rivers and streams. At times, this useful resources turns to be disastrous when flood occurs. Bennihalla watershed in Karnataka State experiences severe floods during monsoon seasons due to the flat terrain, encroachment, sedimentation, insufficient carrying capacity of the channel, etc... The southwest monsoon sets in by June and ends by the middle of October. During this period the basin receives more than 50% of the annual rainfall and the climate is generally be humid. Bennihalla River basin is comprised of black cotton
soil (high clay content soil) which are rich in Montmorillonite which is having the property imparting high degree of expansiveness [3]. All these problems put together was posing a serious threat in the form of flooding. Hence there is a need to such floods to reduce damage caused to men and animals and also the useful property.
In order to estimate the daily discharge values in a particular reach of Bennihalla, SWAT model was used. The model is calibrated and validated using the short length of available data. The model performance is evaluated using R2 and NSE
values. Once the model is found to give satisfactory results for the selected river segment, the same can be used to generate the daily or monthly or yearly discharge data. This SWAT model helps to estimate discharge data when data are either not available or the measurements cannot be possible at the location.
2.
STUDY AREA AND DATA USED
© 2016, IRJET | Impact Factor value: 4.45 | ISO 9001:2008 Certified Journal | Page 1094
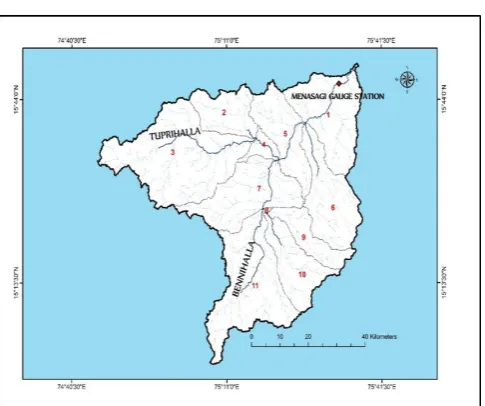
Fig -1: Bennihalla Watershed
The point considered in the present study, Menasagi village, is close to the outlet point of the watershed and it is used to generate the Monthly discharge data using SWAT model and it lies in the sub-watershed 1 out of 12 sub-watersheds (Ref. Fig.1) as delineated by SWAT. From the record of the available data with the concerned department, it has been found that only this station, Menasagi, has certain observed data and being the point nearer to outlet point, represents the entire watershed. Hence chosen for the study. The record of Menasagi station, available with Irrigation Investigation Department Dharwad, which are available for the period from 1988 to 2014 were made used for calibration and validation of the model. The observed stream data were collected from.
The DEM (Digital Elevation Model) of the study area was downloaded from Bhuvan site using CARTOSAT-1 satellite having 32m spatial resolution. Soil data was extracted from Harmonized World Soil Database for the present work for the year 2000 from FAO (Food and Agricultural Organization). Land use and land cover data were extracted using LANDSAT-7 imagery satellite for the year 2003. Precipitation data for the study area was collected from Irrigation Investigation Department, Dharwad for the period 1988 to 2014. Temperature data having resolution of 10X10 was collected from IMD (Indian Meteorological Department) for the period 1988 to 2014.
3.
SURFACE RUNOFF ESTIMATION
In order to estimate the surface runoff in SWAT model SCS curve number procedure (SCS, 1972) is used. The surface runoff may be generated on daily, monthly and yearly basis
depending on the user defined condition during SWAT run. The work flow process to generate surface runoff at different locations in a watershed is illustrated in the Fig. 2.
The SCS-CN is used to estimate runoff and is given as:
)
(
)
(
2S
I
R
I
R
Q
a day
a day
surf
Where,
Qsurf = accumulated runoff or rainfall excess (mm of H20),
Rday = rainfall depth for the day (mm of H20),
Ia = initial abstractions which includes surface storage, interception and infiltration prior to runoff,
S = retention parameter (mm of H20).
The retention parameter is defined as:
25
.
4
1000
10
CN
S
Where,
CN = Curve number for the day,
Ia = commonly approximated as 0.2*S.
Source: SWAT Theoretical Documentation, 2011[2].
[image:2.595.37.280.91.294.2] [image:2.595.303.542.491.778.2]© 2016, IRJET | Impact Factor value: 4.45 | ISO 9001:2008 Certified Journal | Page 1095 First step in setting up of SWAT model is the watershed
delineation using DEM. An interface Arc-SWAT was used in this case to prepare necessary input files to run the SWAT model. Arc-SWAT processes the Digital Elevation Model (Fig. 3) and automatically delineates the watershed and sub- watersheds, generates the stream network, outlet for a given threshold value.
Fig -3: Digital Elevation Map of Bennihalla
The meteorological data required for the SWAT model are precipitation, temperature, relative humidity, solar radiation and wind speed. Precipitation data were collected from Irrigation Investigation Department, Dharwad for the period 1988 to 2014. Temperature data was collected from IMD (Indian Meteorological Department) for the period 1988 to 2014.
The land use and land cover data are collected from LANDSAT – 7 Satellite for the year 2003. Then this data was subjected to supervised classification process. Fig. 4 illustrate the map of different land use and land cover for the study area.
Fig -4: Land Use and Land Cover Map
Soil map was obtained from the FAO (Food and Agricultural Organization) digital soil maps at 1:50000 scale. Fig. 5 illustrates the soil classes within the study area.
Fig -5: Soil Map of Bennihalla
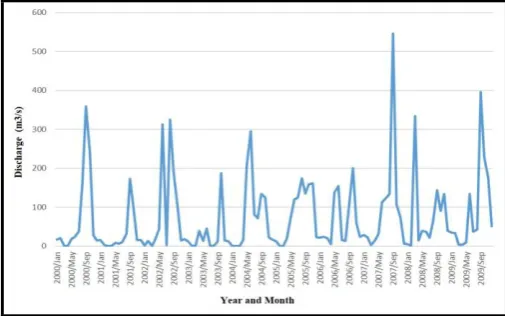
Monthly observed discharge data (1988-2014) for the Menasagi Station, located within the study area, was obtained from Irrigation Investigation department, Dharwad. These observed discharge data was used for the calibration and validation of the model. Fig. 6 represents the observed monthly discharge data of the Menasagi gauging station.
Fig -6: Observed Monthly Discharge (2000-2009)
[image:3.595.309.555.140.309.2] [image:3.595.38.281.194.365.2] [image:3.595.308.561.420.578.2] [image:3.595.39.282.538.717.2]© 2016, IRJET | Impact Factor value: 4.45 | ISO 9001:2008 Certified Journal | Page 1096
5.
RESULTS AND DISCUSSIONS
The model is used to generate discharge values at the selected point, Calibration is done for the year 2000 to 2004 period and Validation of the model for the period 2005 to 2009 period. Before calibrating the model the discharge values were under predictive as simulated peaks were lower than the observed peaks. The objective functions chosen for calibration purpose were R2 and NSE. For the first run, R2 and
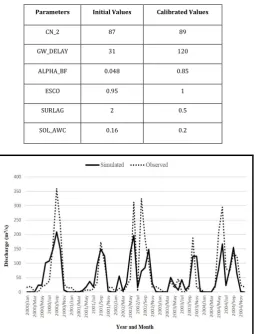
NSE were obtained as 0.561 and 0.303 respectively. The model was simulated for different scenarios by changing the various sensitive parameters (Table 1). On doing sufficient number of iteration by assigning different values for sensitive parameters the objective functions were improved as R2=0.608 and NSE=0.665. Fig.7 shows the
[image:4.595.308.562.100.281.2]relative variations of observed versus simulated flow on model calibration for the period 2000 to 2004.
Table -1: Parameters used in Calibration of the Model
Parameters Initial Values Calibrated Values
CN_2 87 89
GW_DELAY 31 120
ALPHA_BF 0.048 0.85
ESCO 0.95 1
SURLAG 2 0.5
SOL_AWC 0.16 0.2
Fig -7: Comparison between observed and simulated discharge values after calibration
Next step taken was the validation of the model, once again the model was run and the simulated results was compared with observed data from 2005 to 2009. Comparison between the observed and simulated flow is shown in Fig. 8.
Fig -7: Variation in observed and simulated discharge values on Validation
Coefficient of determination R2 and NSE were used to
assess the model performance. In general, model simulation can be judged as satisfactory if NSE > 0.50 (Moriasi et. al, 2007) [9] and typical value of R2 greater than 0.5 for stream
flows (Santhi et al., 2001; Van Liew et al., 2003)[4][5]. The low values of R2 and NSE may be due to the uncertainties
associated with the observed data and also may be due to the use of coarser resolution data which directly affects the accuracy and the model performance. Based on the result obtained, model is assumed to be valid and further analysis of model output has been made.
[image:4.595.38.294.322.657.2]The results of objective functions on calibration and validation of the SWAT model for the monthly discharge data at Menasagi gauging station is shown in the Table II.
Table -2: Parameters used in Calibration of the Model
Objective Function Calibration Validation
R2 0.608 0.617
NSE 0.665 0.658
[image:4.595.344.526.517.600.2]© 2016, IRJET | Impact Factor value: 4.45 | ISO 9001:2008 Certified Journal | Page 1097
6.
CONCLUSIONS
The method demonstrates the use of SWAT model to generate surface runoff values for any location on the watershed. The model was calibrated and validated with the observed data for Menasagi station. In the present case, two objective functions were tested to evaluate the simulated results from SWAT model. The R2 and NSE values was found to be 0.608 and 0.665 during calibration and 0.617 and 0.658 on validation respectively.
The study reveals that, SWAT model can be applied on any watersheds to generate the surface runoff values provided, calibration and validation of the model for the selected watershed is done with the observed data and the values are within the acceptable limits.
ACKNOWLEDGEMENT
Authors thank Dr. N. S. Patil, Associate Prof., and Mr. C.G. Hiremath, Assistant Prof., Dept. of WLM, CPGS, VTU, Belagavi for the help rendered during the work.
REFERENCES
[1] India’s water wealth (2011). Water Resources at a
glance report, CWC, New Delhi. Available at:
(http://www.indiawris.nrsc.gov.in/wrpinfo/index.ph p?title=India%27s_Water_Wealth). Accessed on 18th October 2015.
[2] National Disaster Management Authority, Government
of India (2015). Available at:
(http://www.ndma.gov.in/en/media-public-awareness/disaster/natural-disaster/floods.html). Accessed on 20th October 2015.
[3] Neitsch, S. L., Arnold, J. G., Kiniry, J. R. and Williams, J. R.
(2011). Soil and Water Assessment Tool Theoretical Documentation, Version 2009. Temple, Tex.: Texas Water Resources Institute Technical Report No. 406.
Available at:
(http://twri.tamu.edu/reports/2011/tr406.pdf Accessed 7 February 2015). Accessed on 27th October 2015.
[4] Basavaraj Hutti, Noor Monsoor C.M, Mahesh Bilwa L.
(2014). “Flood Hazard Zonation Mapping Using Geoinformatics Technology; Bennihalla Basin, Gadag and Dharwad District, Karnataka, India”. International Journal of Engineering Research & Technology, ISSSN: 2278-0181, Vol. 3 Issue 9, pp. 750-755.
[5] Santhi, C., Arnold, J. G., Williams, J. R., Dugas, W. A.,
Srinivasan, R. and Hauck, L. M.(2001). Validation of the SWAT model on a large river basin with point and nonpoint sources. J. American Water Resources Assoc. 37(5), pp. 1169-1188.
[6] Van Liew, M. W., T. L. Veith, D., Bosch, and Arnold,J.
G.(2007). Suitability of SWAT for the conservation effects assessment project: A comparison on USDA-ARS experimental watersheds. J. Hydrologic Eng. 12(2), pp. 173-189.
[7] Arnold J.G, Moriasi D.N, Santhi C. (2012). SWAT: Model
Use, Calibration, and Validation. American Society of Agricultural and Biological Engineers ISSN 2151-0032, Vol.55 (4), pp.1491-1508.
[8] Jaya Rami Reddy P. “A textbook of Hydrology”, Third
Edition-2011, Lakshmi publications.
[9] Spruill C.A, Workman S.R, Taraba J.L (2000). “Simulation
of Daily and monthly Stream Discharge from Small Watershed Using the SWAT Model”. ASAE, Vol. 43(6), pp. 1431-1439.
[10] Moriasi, D. N., Arnold, J. G., Van Liew, M. W., Bingner, R.
L., Harmel, R. D. and Veith, T. L. (2007). Model evaluation guidelines for systematic quantification of accuracy in watershed simulations. American Society of Agricultural and Biological Engineers 50(3), pp. 885-900.
[11] Malunjkar V.S., Shinde M.G., Ghoktekar S.S., Atre A.A.
(2015). “Estimation of Surface Runoff using SWAT Model”. IJIES, ISSN: 2319-9598, Volume-3, Issue-4, March 2015, pp. 12-15.
[12] United States Department of Agriculture (1986). Urban hydrology for small watersheds. Technical release 55 (TR-55), second edition. Natural Consrvation Service, Conservation Engineering Division.
BIOGRAPHIES
Madhusudhan M.S: He is pursuing his M.tech studies at Dept. of Water and Land Mgmt. CPGS, VTU, Belagavi. His research area includes Water resources, Disaster Management and Watershed Management.
Dr. Anand V Shivapur: He is currently working as Professor and HOD of Water and Land Management dept., Centre for PG Studies, VTU, Belagavi. He has total experience of 31 years in teaching, administration and research. He has published more than 25 research papers in National as well as International journals, 60 papers in Conf., Seminar etc. He has guided 2 PhD students and 6 scholars are pursuing research. His research areas are Watershed Mgmt., Hydrology, Use of RS and GIS for Irrigation and watershed.