THE MODERATING EFFECT OF WEB SERVICE ON THE
RELATIONSHIP BETWEEN BUSINESS ANALYTICS AND
SUPPLY CHAIN PERFORMANCE
BIJAN GANJI JAMEHSHOORAN1, AWALUDDIN. M. SHAHAROUN2, HABIBAH NOREHAN HARON 3
1,2
Ph.D Candidate – Prof., Department of Manufacturing & Industrial, Engineering, Faculty of Mechanical Engineering, (University Technology Malaysia)
3Dr., Department of Engineering, Razak School of Engineering and Advanced Technology (University
Technology Malaysia), Kuala Lumpur, Malaysia
E-mail: 1 [email protected] 2 [email protected] [email protected]
ABSTRACT
In recent years, supply chain performance measurement has received much attention from researchers and practitioners. Effective supply chain performance through supply chain antecedents such as business analytics has become a potentially valuable way of securing competitive advantage and improving supply chain performance. Many organizations have begun to recognize that supply chain management is the key to building a sustainable competitive advantage for their products or services in an increasingly crowded marketplace. Despite the fact that, determining supply chain performance through its antecedents is considered as a unique methodology, theoretical and comprehensive studies on supply chain performance through the methodology is few and far between. This study addressed the lack of the empirical studies by developing a comprehensive model to examine the effect of plan analyse, source analyse, make analyse and delivery analyse on supply chain performance considering moderating effect of WS on the relationships. A quantitative methodology using a cross-sectional survey method was used to investigate the relationship between variables. Data were collected from automotive companies in Iran. The overall response rate was 86.72%. The relationships between variables were examined using structural equation modelling (SEM) technique and partial least squares (PLS) software was used to examine the proposed hypotheses. The results revealed there is a significant and positive relationship between four areas of business analytics namely plan analyse, source analyse, make analyse and delivery analyse and supply chain performance. Moreover, the results indicated that the aforementioned relationship is moderated by WS. The study combined resource- based theory, resource dependence theories to develop a new theoretical framework to demonstrate the importance of the four areas of SCOR approach businesses analytic; in improving supply chain performance. Moreover, the study has provided a new platform to effectively improve supply chain performance.
Keywords: Supply Chain Performance (SCP),Business Analytics (BA),Supply Chain Operations Reference (SCOR) model, information system (IS), plan analyse (PA), source analyse (SA),make analyse (MA) and delivery analyse (DA).
1. INTRODUCTION:
Business analytics (BA) can be an important tool to improve the organization’s efficiency. An important area of BA use is in supply chain management (SCM) since an improvement in SCM can considerably improves performance of single companies and supply chain (SC) as a whole [1]. Although an investment in BA has been statistically proven to be beneficial, but, the organizational factors that influence the impact of BA on SCP remain unclear. [2] . Due the finite nature of
analyze (DA) on SCP regarding the moderating effect of WS on the relationships. This study addresses eight major research questions:
1) Does PA have a positive effect on SCP? 2) Does SA have a positive effect on SCP? 3) Does MA have a positive effect on SCP? 4) Does DA have a positive effect on SCP?
5) Do WS moderate the relationship between PA and SCP?
6) Do WS moderate the relationship between SA and SCP?
7) Do WS moderate the relationship between MA and SCP?
8) Do WS moderate the relationship between DA and SCP?
2. LITERATURE REVIEW
This section reviews the related literature on the effect of BA on SCP and also BA on SCP with IS moderator. It starts with an introduction about the SCOR model. The section proceeds with a review of relevant studies on BA, supply chain performance, the influence of BA on SCP, the moderating effect of IS support. It follows with a discussion about the theoretical framework and hypothesis development. Then, the sections end by formulating research propositions.
2.1 The Scor Model
The SCOR model, developed by the Supply-Chain Council, is a process reference model that serves as a diagnostic tool for supply chain management. In 1997, the Supply-Chain Council released the first version of the SCOR model. It included Plan, Make, Source, and Deliver as the stages of the supply chain in addition to metrics, best practices, and technology [3].Version 4 was the first to include the Return stage of the supply chain. Currently, Version 10.0 of the SCOR-model is the twelfth revision since the Model’s introduction in 1996. Revisions of the Model are made when it is determined by Council members that changes should be made to facilitate the use of the Model in practice. The SCOR model (version 10.0) consists of four major components:
a. Performance: Standard metrics to describe process performance and define strategic goals. b. Processes: Standard descriptions of management processes and process relationships.
c. Best Practices: Management practices that produce significant better process performance. d. People: Standard definitions for skills required to perform supply chain processes
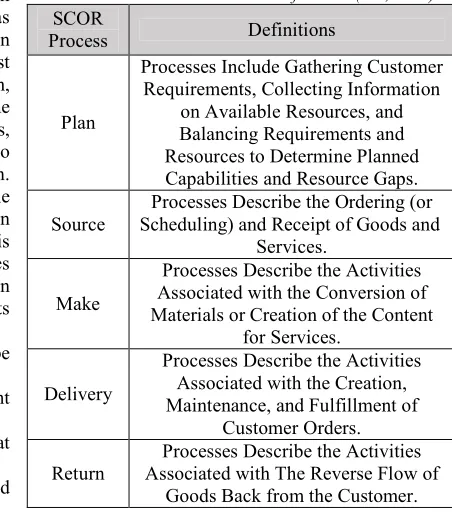
[image:2.595.286.512.482.741.2]SCOR model has been warmly greeted by industries since it was introduced [4]. This process reference model designed to facilitate communication among supply chain members (SCC, 2010). It provides a common language for communication and is used to describe a measure and evaluate the supply chain configuration. SCOR combines the concepts of the business process reengineering, benchmarking and best practices. The SCOR model is developed and aimed to the modeling and improvement supply chain of developed countries. SCOR model encompasses all the activities of suppliers, customers, material flows and all market interactions. The SCOR model consists of five basic processes, Plan (P), Source (S), Make (M), Deliver (D) and Return (R).The SCOR modeling approach starts with the assumption that any supply chain process can be represented as a combination of the processes P, S, M, D and R. The Plan process balances to best meet the demand and supply the sourcing, manufacturing and delivery requirements. SCOR model contains three levels of process details. Level 1 is the top level that deals with process types. It defines a scope of a supply chain. Level 2 is the configuration level which deals with process categories. Level 3 is the process element level and is the lowest level in the scope of SCOR model. Table 2.1 shows the SCOR model process definition at level 1.
Table 2.1. Scor Level 1 Process Definitions (Scc, 2010)
SCOR
Process Definitions
Plan
Processes Include Gathering Customer Requirements, Collecting Information
on Available Resources, and Balancing Requirements and Resources to Determine Planned Capabilities and Resource Gaps.
Source
Processes Describe the Ordering (or Scheduling) and Receipt of Goods and
Services.
Make
Processes Describe the Activities Associated with the Conversion of Materials or Creation of the Content
for Services.
Delivery
Processes Describe the Activities Associated with the Creation, Maintenance, and Fulfillment of
Customer Orders.
Return
Processes Describe the Activities Associated with The Reverse Flow of
2.2. Supply Chain Performance
In the literature different measures for SCP are suggested. For example, Stevens [5] suggests the performance measure of SC in terms of inventory level, service level, throughput efficiency, supplier performance and cost. Neely, Gregory [6] in his work suggests quality, time, flexibility and cost as a few categories of performance measures and also points out need of a generally applicable systematic approach to performance measurement. New [7] presents taxonomy for the classification of SC improvement. Different researchers have attempted to assess SCP in different ways, but most performance measures up to now are more oriented towards economic performance than to other aspects of performance such as customer satisfaction [8]. Narasimhan and Jayaram [9] use the customer responsiveness and manufacturing performance as the measure for SCP. Spekman, Kamauff [10] use cost reduction and customer satisfaction as the SC measures. Beamon [11] identifies several qualitative SCP measures: customer satisfaction, flexibility, information and material flow integration, effective risk management, and supplier performance. van Hoek [12]proposes a framework at the firm's level of integration in the SC and the strategy adopted. Beamon [13] develops a performance evaluation framework for manufacturing SCs, where resources, output and flexibility are considered necessary components for SCP. Shah and Singh [14] provide a framework for benchmarking internal SCP. The supply chain operations reference model (SCOR) developed by the Supply Chain Council [15], provides a useful framework that considers the performance requirements of member firms in a SC. The SCOR model views activities in the SC as a series of interlocking inter organizational processes with each individual organization comprising four components: plan, source, make and deliver. The SCOR model provides an indication as to how effective a firm uses resources in creating customer value. It considers the performance expectations of member firms on both input and output sides of SC activities [16].
2.3. The Influence Of Ba On Performance
The use of BA can have a profound influence on performance on operational, tactical and even strategic levels [17]. The professional press has thus quickly touted BA as an approach to achieve faster cycle times, greater flexibility and a higher
“metabolism “for processing information [18]. This applies to SC as well - monitoring and improving the performance of a SC has namely become an increasingly complex task. A complex performance management system includes many management processes such as identifying measures, defining targets, planning, communication, monitoring, reporting and feedback [19]. Properly implemented and used, BA can increase performance in each of these processes [2]. However, the positive impact of a BA investment in SCM operations should not be taken for granted. Despite major investments in SCM in the last decade, businesses are struggling to achieve a competitive advantage [20]. Companies or individual decision makers are not necessarily able to derive value from the growing amount of information [21]. A compelling and specific vision for how an organization will use information to improve their performance is needed [22]. These further increases the need to analyze in which area the impact of BA may be most beneficial. Many organizations with systems already in place to collect data and gather information find themselves in a situation where they have no roadmaps to put their vast data and information into use [23]. An improper investment in an early stage of implementing BA may hinder further development. On the other hand, successful efforts may lead to a long-term continuous increase in performance since the path dependency and irreversibility in the development make it difficult to imitate [24].
2.4. The Moderating Effect Of Is Support
investment by itself will not bring a competitive advantage [31, 32]. Thus it seems that IS will play a moderating role on the impact of BA on SC performance. The proposed moderating effects in line with the finding that IS investment influences performance through IS support for core competencies [33], in our case competencies in each of the four areas of SCOR. Obviously this shows that IS intrinsically does not necessarily bring those advantages since BA are also about culture, people's views of the value of information, exploratory and predictive models and fact-based management[34]. However, the ability to sense and interpret events about a changing business environment or customer needs require an event driven IS infrastructure for making fast and well-informed decisions and putting them into action [35]. IS namely plays an enabling role in collaboration practices and the capabilities and sophistication of the underlying IS infrastructure supports various ways of collaboration [36] both within the company and at the inter-organizational level. On the other hand, the technical uncertainty on reliability and complexity of integrating internal ISs can also be a hindering factor [36]. Nevertheless, IS may have an additional independent influence on SC performance. All organizations namely benefit from using IS to increase their cost-effectiveness. However, advanced uses of IS should be more closely aligned with an organization's strategy[37]. It is also possible to initially build the infrastructure and to then decide on when and how much additional commitment should be made to build on top of that [38, 39]; in our case, proper IS support can be developed earlier and later used to support the implementation of BA. The definition and the questions in the survey are intentionally quite broad in order to measure the (perceived) support of IS. As found by [40], the value of a technology depends upon the tasks of the user. User evaluations can therefore accurately reflect differences in the underlying systems and services provided to them. The employed technological solution (e.g. extended ERP system, web service) may vary from company to company.
2.5. The Theoretical Framework In The Study
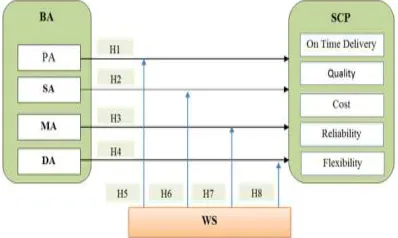
The purpose of the study is to examine the effects of PA, SA, MA and DA on SCP by considering moderating effect of WS on the aforementioned relationship. The RBT and RDT are exercised as the main theoretical framework to predict and to interpret the relationships between the constructs
[image:4.595.307.506.259.378.2]that have been proposed in the theoretical model of the study. RDT was exercised to interpret and explain how the effective use of external resources can lead to improve SCP. With emphasizing on importance and effective utilization tangible and intangible resources within the organization, the RBT was utilized to explain the relationship between BA and SCP as well as the moderating relationship. Therefore, according to this explanation, the theoretical framework of research is represented in figure 2.1 as follows:
Fig 2.1: Theoretical Framework of the study
2.6. Hypothesis Development
According to the research model, totally 4 hypotheses which need to be tested as follows: H1: PA positively influences SCP.
H2: SA positively influences SCP. H3: MA positively influences SCP. H4: DA positively influences SCP.
H5: The relationship between PA and SCP is moderated by WS.
H6: The relationship between SA and SCP is moderated by WS.
H7: The relationship between MA and SCP is moderated by WS.
H8: The relationship between DA and SCP is moderated by WS.
3. METHODOLOGY
not English, the survey tool was translated to Persian by one bilingual expert.
To ensure that the wording of this questionnaire is clear and understandable and the equivalence of the instrument is met, a pilot study will conduct prior to conducting the final survey. The pilot study is considered necessary to discover any problems in the instrument, and to determine face validity of the measures. Following the pilot study procedures, the final survey was conducted. In total, 226 questionnaires were distributed among companies active in the automotive industry across Iran. The respondents of the study were performance appraiser managers. To analyze the data, two statistical techniques were adopted. The Statistical Package for the Social Sciences (SPSS) version 21 was used to analyze the preliminary data and provide descriptive analyses about the study sample such as means, standard deviations, and frequencies. Structural Equation Modeling (SEM using smart PLS) using Confirmatory Factor Analysis (CFA) was used to test the measurement model. Structural Equation Modeling using CFA used to test the measurement model. SEM was conducted using the two steps. The first step includes the assessment of the measurement model, while the second step includes assessment of the structural model. The measurement model stage in this study conducted in two steps. This involves the assessment of the unidimensionality, followed by the assessment of reliability and validity of the underlying constructs. Reliability was investigate using both the internal consistency measures of Cronbach’s alpha, construct reliability and AVE. Validity criterion construct, including convergent, discriminant and construct validity were assessed. Once the scale is developed in stage one, the hypotheses were tested in stage two (the structural model). The moderating impact of web service (WS) on the hypothesized relationships is evaluated.
4. DATA ANALYSIS
The methodology described in the previous section provided the baseline for data gathering. In this section, the presentation of data is systematically linked to format of the self-developed questionnaire of the study. This section focuses on the analysis and interpretation of data that was collected for the study. According to De Vos [41] data analysis entails that the analyst break down data in to constitute to obtain answer to research questions and to test hypothesis. This section is divided majorly in four subsections. After, introduction
sub-section (4.1) offers the pilot study results to confirm the reliability and validity of the survey instrument. Consistent with the reliable survey instrument, sub-section (4.2) displays the reliability for Pilot study. Sub-section (4.3) is an important subdivision of the section which is categorized into two segments. Sub-Section (4.3.1) presents measurement of convergent validity and sub-section (4.3.2) exhibits measurement of discriminant validity. Section (4.4) exhibits structural model through evaluation of the structural equation model with substantive relations in framework. Section 4.5 presents the moderating effect of WS.
4.1. Pilot Study
It is well established in the literature that pilot study is an integral step towards developing a reliable instrument, to achieve the set objectives. The pilot study aimed to evaluate the important requirements during instrument purification e.g. testing questions wording, sequence, layout, familiarity with respondents, response rate, questionnaire completion time and analysis process [42]. Accordingly, after minor revisions of the instrument in pretest, a pilot-test was performed. For the piloting, selecting small sample size is in accordance to the guidelines in literature which suggested the pilot study sample size to be generally small i.e. up to 100 respondents [43] or between 10 to 30 [44]. The pilot test of the instrument was conducted by distributing 25 instruments to automakers company in Iran company, out of which 4 were excluded due to large number of missing data. Thus, response rate of the pilot study was 84%. The respondents included into pilot study were not invited to participate in the final study. This is because it may influence the later behavior of the respondents if they have already been involved in the pilot study [45].
4.2. Reliability For Pilot Study
Table 4.1: Cronbach’s Β Value Of The Instruments
Variables Number of Items Cronbach’s α
PA 11 0.952 MA 7 0.942 SA 5 0.819 DA 6 0.873 OTD 3 0.921 Quality 5 0.707 Cost 5 0.890 Reliability 3 0.902 Flexibility 4 0.726 WS 5 0.927
4.3 Measurement Model
The structural equation modelling process centers around two steps: validating the measurement model and fitting the structural model. The former is accomplished primarily through confirmatory factor analysis, while the latter is accomplished primarily through path analysis with latent variables. The measurement model specifies the rules governing how the latent variables are measured in terms of the observed variables, and it describes the measurement properties of the observed variables. That is, measurement models are concerned with the relations between observed and latent variables. Such models specify hypotheses about the relations between a set of observed variables, such as ratings or questionnaire items, and the unobserved variables or constructs they were designed to measure. The measurement model is important as it provides a test for the reliability of the observed variables employed to measure the latent variables. A measurement model that offers a poor fit to the data suggests that at least some of the observed indicator variables are unreliable, and precludes the researcher from moving to the analysis of the structural model.
4.3.1 Measurement Of Convergent Validity
The validity is the extent to which a set of measuring items correctly represents the underlying theoretical proposed concept [48]. Specially, convergent validity enlightens that the correlation between responses obtained through different methods denote same construct [49]. On the other hand, it indicates that set of items should denote one and same underlying construct that can be confirmed through their one-dimensionality [50].In the study, convergent validity was surveyed by means of widely recognized method average
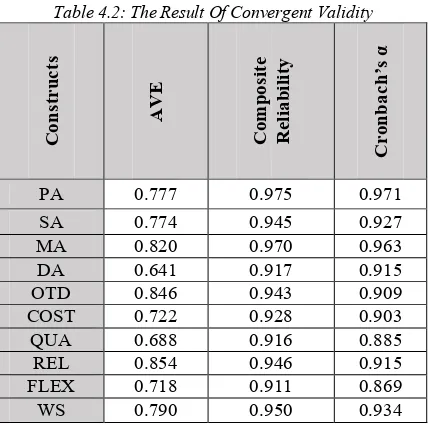
variance extracted (AVE) [48, 50, 51]. An AVE was originally recommended by Fornell and Larcker, [52] that tries to examine the amount of variance that a construct captures from its measuring items compared with the amount because of measurement error. Table 4.2 shows that AVE extracted for the each construct was higher than the required value 0.5 (50%) [52] and designate that each construct has capability to enlighten more than half of the variance to its measuring items on average.
Table 4.2: The Result Of Convergent Validity
C
o
n
st
ru
ct
s
A
V
E
C
o
m
p
o
si
te
R
el
ia
b
il
it
y
C
ro
n
b
a
c
h
’s
α
PA 0.777 0.975 0.971 SA 0.774 0.945 0.927 MA 0.820 0.970 0.963 DA 0.641 0.917 0.915 OTD 0.846 0.943 0.909 COST 0.722 0.928 0.903 QUA 0.688 0.916 0.885 REL 0.854 0.946 0.915 FLEX 0.718 0.911 0.869 WS 0.790 0.950 0.934
4.3.2 Measurement Of Discriminant Validity
[image:6.595.300.514.260.473.2]Table 4.3: The Results Of Discriminant Validity
COST DA FEL MA OTD PA QUL REL SA WS COST 0.85
DA 0.111 0.801
FLEX 0.31 0.098 0.847
MA 0.446 0.041 0.323 0.906 OTD 0.346 0.024 0.544 0.391 0.92
PA 0.468 0.039 0.414 0.548 0.52 0.881
QUL 0.606 0.169 0.254 0.534 0.399 0.453 0.829
REL 0.174 0.128 0.428 0.379 0.545 0.386 0.232 0.924 SA 0.517 0.13 0.229 0.555 0.375 0.48 0.515 0.315 0.88
WS 0.414 0.028 0.459 0.306 0.487 0.332 0.362 0.527 0.112 0.889
4.4 Structural Model Evaluation
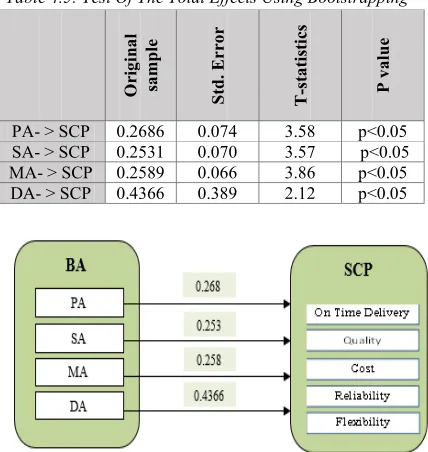
Table 4.5 shows that four path relations representing four hypotheses were significant. Graphical image of paths is presented in figure 4.1 and 4.2 .The results of boot strapping method (Table 4.5) show a p-value for each relation. All structural model relationships were significant considering a p-value = 0.05. In the model all IV’s had a significant a positive coefficients which means, companies with higher level of BA will tend to achieve a better SC performance. Among BA dimensions the highest coefficient belonged to Plan (β=0.268, p<0.05) followed by Source (β=0.253, p<0.05) and Make (β=0.258, p<0.05). Compare to the other BA components delivery had a lower influence on SC performance (β=0.436, p<0.05). It is important to note that contrary to confirmative SEM models (e.g., LISREL), explorative PLS models still do not have such global indicators that would assess the overall goodness of the model, to evaluate the goodness of fit for models. The criterion of global fitness (GoF) was calculated. The GoF is a geometric average of all communalities and R2 in the model. The GoF is an index that can be used to validate models with PLS. The R2 coefficient is 0.628, which demonstrates that the indicator of analytical businesses was able to explain 62.8% of the variability in the performance results. A value higher than the GoF> 0.5 shows that the set of structural equations is well defined and offers a good representation of the dataset and is valid. GoF of current model was 0.647 which is ready to consider 64.7 % of the reachable fitness.
GoF=
Table 4.4: Gof For The Structural Model Without Moderator
Dimension Communality R Square
[image:7.595.91.517.82.424.2]PA 0.7766 SA 0.7744 MA 0.8201 DA 0.705 SCP 0.3814 0.628 GoF 0.6478
Table 4.5: Test Of The Total Effects Using Bootstrapping
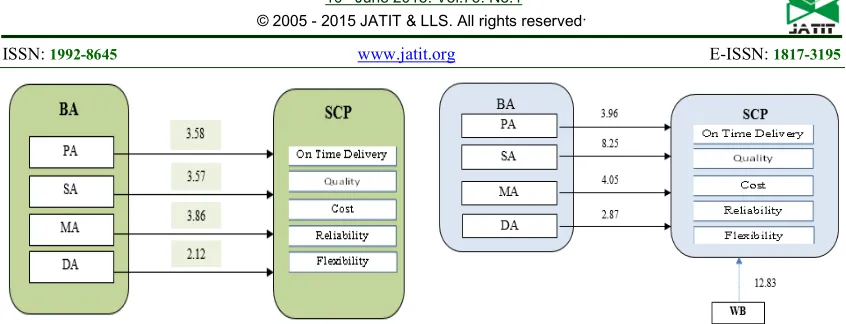
Figure 4.1: Paths Standardized Coefficient (Β) Results Of Hypothesis
O
ri
g
in
a
l
sa
m
p
le
S
td
.
E
r
ro
r
T
-s
ta
ti
st
ic
s
P
v
a
lu
e
[image:7.595.303.517.436.662.2]Figure.4.2: T- Value Of Hypothesis Results Of Original Model
4.5 Moderating Effect Of Ws
[image:8.595.87.510.88.250.2]Structural equation modeling (Partial Least Squares; PLS) was used to test the hypothetical model and evaluate the influence of the moderators over the variables. Initially the constructs of BA in the plan, source, and make and delivery areas of SCOR were considered as latent variables of the formative construct related with SCP. The R^2 is 0.628, which demonstrates that the indicators of BA were able to explain 62.8% of the variability in the SCP. Afterwards the construct of WS was added to the former model as independent and exogenous variable. The results showed a R^2 of 0.718, revealing that the BA indicators jointly with the new constructs explained 71.8% of the variability in the results of the performance of the companies in the sample. The overall results of the structural equation modeling considering the moderators are summarized in Table 4.6 and 4.7.
Figure 4-3: Paths Coefficient (Β) Of Moderating Effect WS
[image:8.595.298.516.281.376.2]Figure 4.4: T- Value Of Moderating Effect Of WS
Table 4.6: Gof For The Structural Model With Moderator
Dimension Communality R -Squared
PA 0.7766 SA 0.7744 MA 0.8201 DA 0.6814 SCP 0.3979 0.718
[image:8.595.300.514.426.579.2]WS 0.7897 GoF 0.7208
Table 4.7: Test Of The Total Effects Using Bootstrapping (With Moderator)
5. DISCUSSION AND RESULTS
Business analytics is the practice of iterative, methodical exploration of an organization’s data with emphasis on statistical analysis. BA is used by companies committed to data-driven decision making. For measuring the function of BA in SCP as a broad term a number of models are designed. Among these models SCOR is one of the most famous them that has been used extensively by scholars. SCOR has often been recognized as a systematic approach to identifying, evaluating and monitoring SCP. In the model, a balanced performance measurement system at multiple levels, covering four core SC processes (PA, SA, MA, and DA) was developed. SCOR is supposed to
O
ri
g
in
a
l
sa
m
p
le
S
td
.
E
r
ro
r
T
-s
ta
ti
st
ic
s
P
v
a
lu
e
PA - > SCP 0.1910 0.048 3.96 p<0.05
SA - > SCP 0.3280 0.039 8.25 p<0.05
MA - > SCP 0.1714 0.042 4.05 p<0.05
DA - > SCP 0.1484 0.168 2.87 p<0.05
[image:8.595.88.291.522.651.2]be the most promising model for SC strategic decision-making. It provides a common SC framework, standard terminology and metrics that can be used for evaluating, positioning and implementing SC processes. This section explains the results of testing the hypotheses related to the relationship between PA, SA, MA and DA and SCP. These linkages have aimed to answer the questions raised in the introduction as below: Does PA have a positive effect on SCP? Does SA have a positive effect on SCP? Does MA have a positive effect on SCP? Does DA have a positive effect on SCP?
Do WS moderate the relationship between PA and SCP?
Do WS moderate the relationship between SA and SCP?
Do WS moderate the relationship between MA and SCP?
Do WS moderate the relationship between DA and SCP?
The Plan processes describe the planning activities associated with operating a supply chain. Plan is gathering customer requirements, collecting information on available resources, and balancing requirements and resources to determine planned capabilities and resource gaps. In other words, the PA focuses on analyzing data to predict market trends of products and services and developing supply plans to match market demands. This is followed by identifying the actions required to correct any gaps. The goal of supply planning is to match customer demands with resources in a portable manner. A supply chain needs to consider a broad range of activities, including sourcing and production from a planning perspective.
Hypothesis H1 was presumed to examine the consequence of plan analysis on the SCP. The results of Table (4.5) have provided new empirical evidence on the relationship between PA and supply chain performance. Based on the results the relationship was positive and significant (β= 0.268, t=3.58) that suggested applying of PA with the approach of SCOR model might help the firms in automotive industry to enhance SCP.
Source is necessary for successful Plan through issuing purchase orders, scheduling deliveries, receiving shipment validation and storage, and accepting supplier invoices. The primary role of source analyzes lies in improving inbound supply chain consolidation and optimization. Broad applications include the use of an agent based procurement system with a procurement model, search, and negotiation and evaluation agents to improve supplier selection, price negotiation and
supplier evaluation and the approach for supplier selection and evolution. Hypothesis H2 was postulated to measure the consequence of SA on the SCP. Table 4.5 demonstrated the results. Based on the table the relationship was positive and significant (β= 0.253, t= 3.57) that revealed utilizing SA might have a crucial role in appraising and enhancing SCP in automotive industry by approach of supply chain operations reference (SCOR) model.
Make processes describe the activities associated with the conversion of materials or the creation of the content for services. It focuses on conversion of materials rather than production or manufacturing because make represents all types of material conversions: assembly, chemical processing, maintenance, repair, overhaul, recycling, improvement, remanufacturing, and other material conversion processes. As a general guideline: these processes are recognized by the fact that one or more item numbers go in, and one or more different item number come out of this process. Hypothesis H3 was assumed to evaluate the consequence of MAon the SCP. Table 4.5 validates the outcome of assessing the consequence of MA on SCP. Based on the results the relationship is positive and significant (β= 0.258, t= 3.86) that point to that the MA as a component of SCOR model might use as an indicator of SCP.
Deliveries processes describe receive, schedule, pick, pack and ship orders. The activities associated with the reverse flow of goods back from the customer. The delivery process includes the identification of the need for a delivery, the disposition decision making, the scheduling of the delivery, and the shipment and receipt of the returned goods. Hypothesis H4 was presumed to examine the relationship between DA and SCP. Results of the aforementioned table demonstrated that the relationship between DA and SCP is positive and significant (β= 0.436, t= 2.12) that indicated that DA enables to predict SCP.
Moreover , the results are in line with Cai, Liu [19] those who emphasized on a comprehensive and integrated approach to improving SCP. Moreover, the results is in consort with Irfan, Xu [55] those who suggest that the SCOR model enables companies to communicate, compare and learn from competitors and companies both within and outside of their industry.
The results of the hypotheses might be supported by RBT. The study by inspiration of the SCOR model applied a comprehensive, sound and integrated construct as antecedent of supply chain performance. The results from the hypothesis indicated that four components of BA derived from SCOR model have a positive and significant effect on supply chain performance. Based on the RBT having and implementing of a strategic resource will lead to competitive advantage. In the study the SCOR model is assumed as a strategic resource. SCC (2010) describes a comprehensive reportage of strategic resource, i.e. (i) redesign and optimization efficient supply chain network, (ii) alignment of supply chain team skills with strategic objectives, (iii) provide a detailed game plan for launching new businesses and products, (iv) deliver a systematic supply chain mergers that capture expected savings, (v) assisting universal fact-based decision-making, and (vi) enhanced operational control from standard core processes. Therefore, based on resource-based theory business strategy such as SCOR model could be considered as one valuable intangible asset [56] .
5.1 The Moderating Effect Of Ws
According to the theoretical model of the study, it was assumed that the relationship between BA and SCP are moderated by the WS. As results, the following hypotheses were presumed to evaluate the outcomes.
H5: The relationship between DA and SCP is moderated by WS.
H6: The relationship between MA and SCP is moderated by WS.
H7: The relationship between SA and SCP is moderated by WS.
H8: The relationship between PA and SCP is moderated byWS.
Section 4.4 presents the results after introducing WS as moderating variable. Based on table 4.6 the model achieved acceptable GoF. Table 4.7 acknowledges that the relationship between PA and SCP (β= 0.191, t=3.96), relationship between SA and SCP (β= 0.328, t= 8.25), relationship between MA and SCP (β=0.171, t=4.05) as well as
relationship between DA and SCP (β= 0.148, t= 2.87) have been moderated by WS.
5.2 IMPLICATION FOR FUTURE RESEARCH
Future research should investigate the moderating effect of enterprise resource planning on the relationship between PA, SA, MA, DAand SCP by considering different aspect of organizational performance e.g. business performance and operational performance .Moreover , future study should consider the effect of BA, supply chain integration and supply chain agility on supply SCP. In the study a quantitative approach has been applied to examine the consequences of business analytics as well as transport logistics on supply chain performance. Given that there are several benefits to mixed methods research has several benefits, to achieve more reliable results, Future studies are needed to conduct the effects of business analysis as well as transport logistics by mixed mode approach.
6. CONCLUSIONS
In this research tried to illustrate the relationships between PA, SA, MA and DA and SCP considering the moderating effect of WS on the aforementioned. Eight research hypotheses were formulated in this study. The results highlighted noteworthy relationship between the four component of BA and SCP. In general, the result revealed that companies that are having better WS infrastructure would be able to effectively use the SCOR model to evaluate SCP. Moreover, the results confirmed that the relationships positively and significantly moderated by WS.
REFRENCES:
[1] Trkman, P., et al., Process approach to supply chain integration, . Supply Chain Management - An International Journal, 2007. 12(2): p. 116-128.
[2] Trkman, P., et al., The impact of business analytics on supply chain performance. Decision Support Systems, 2010. 49: p. 318– 327.
[4] Conference on Concurrent Enterprising. 2010. [5] Vijay, K., Systemic Assessment of SCOR for Modeling Supply Chains. In Proceeding of the 38th Hawaii International Conference on System Sciences, 03/06, 87b. http://dx.doi.org/10.1109/HICSS.2005.574. 2005.
[6] Stevens, G.C., Successful supply chain management. Management Decision, 1990. 28(8): p. 25-30.
[7] Neely, A., M. Gregory, and K. Platts, Performance measurement design. International Journal of Operations and Production Management, 1995. 15(4): p. 80-116.
[8] New, S.J., A framework for analyzing supply chain improvement. International Journal of Operations and Production Management, 1996. 16(4): p. 19–34.
[9] Harland, C.M., Supply chain management: Relationships, chains and networks. British Journal of Management, 1996. 7: p. 63-80. [10] Narasimhan, R. and J. Jayaram, Causal
linkage in supply chain management: An exploratory study of North American manufacturing firms Decision Science, 1998. 29(3): p. 579–605.
[11] Spekman, R.E., J.W.J. Kamauff, and N. Myhr, An empirical investigation into supply chain management: A perspective on partnerships. Supply Chain Management, 1998. 3(2): p. 53-67.
[12] Beamon, B.M., Supply chain design and analysis: Models and methods. International Journal of Production Economics, 1998. 55(3): p. 281-294.
[13] van Hoek, R.I., Measuring the unmeasurable – Measuring and improving performance in the supply chain. Supply Chain Management, 1998. 3(4): p. 187-192.
[14] Beamon, B.M., Measuring supply chain performance. International Journal of Operations and Production Management, 1999. 19(3): p. 275–292.
[15] Shah, J. and N. Singh, Benchmarking internal supply chain performance: Development of a framework. Journal of Supply Chain Management, 2001. 37(1): p. 37-47.
[16] Stewart, G., Supply-chain operations reference model (SCOR): The first cross-industry framework for integrated supply-chain management. Logistics Information Management, 1997. 10(2): p. 62-67.
[17] Lai, C.L., W.H. Ip, and W.B. Lee, The system dynamics model for engineering services.
Managing Service Quality, 2001. 11(3): p. 191-199.
[18] Popovič, A., P.S. Coelho, and J. Jaklič, The impact of business intelligence system maturity on information quality. 2009. 14: p. 417.
[19] Brynjolfsson, E., The Four Ways IT Is Revolutionizing Innovation.MIT Sloan Management Review
[20] 2010. 51: p. 51-56.
[21] Cai, J., et al., Improving supply chain performance management: A systematic approach to analyzing iterative KPI accomplishment. Decision Support Systems, 2009. 46(2): p. 512-521.
[22] Sahay , B.S. and J. Ranjan, Real time business intelligence in supply chain analytics, Information Management & Computer Security. 2008. 16(1): p. 28-48.
[23] Petrini, M. and M. Pozzebon, Managing sustainability with the support of business intelligence: Integrating socio-environmental indicators and organisational context. The Journal of Strategic Information Systems, 2009. 18: p. 178-191.
[24] Williams, S. and N. Williams, The Profit Impact of Business Intelligence.Morgan Kaufmann,San Francisco 2007.
[25] Ranjan, J., Business justification with business intelligence The journal of information and knowledge management systems, 2008. 38(4): p. 461-475.
[26] Fink, L. and S. Neumann, Exploring the perceived business value of the flexibility enabled by information technology infrastructure. Information & Management 2009. 46: p. 90-99.
[27] Muylle, S. and A. Basu, Online support for business processes by electronic intermediaries. Decision Support Systems 2008. 5(4): p. 845.
[28] Borges, M., N. Hoppen, and F.B. Luce, Information technology impact on market orientation in e-business. Journal of Business Research, 2009. 62(9).
[29] Cadez, S. and C. Guilding, An exploratory investigation of an integrated contingency model of strategic management accounting, Accounting, Organizations and Society. 2008. 33 (7-8): p. 836-863.
[31] Bardhan, I., V. Krishnan, and S. Lin, A Model to Measure the Business Value of Information Technology: the Case of Project and Information Work, Rady School of Management. 2205.
[32] Heeley, M.B. and R. Jacobson, The recency of technological inputs and financial performance. Strategic Management Journal 2008. 29(7): p. 723–744.
[33] Carr, N., IT doesn't matter, Harvard Business Review 2003. 81(5): p. 41-49.
[34] Chae, B., H.R. Yen, and C. Sheu, Information technology and supply chain collaboration: moderating effects of existing relationships between partners. IEEE Transactions on Engineering Management 2005. 52(4): p. 440-448.
[35] Ravinchandran, T. and C. Lertwongsatien, Effect of information systems resources and capabilities on firm performance: a resource-based perspective. Journal of Management Information Systems, 2005. 21(4): p. 237– 276.
[36] Howson, C., Successful Business Intelligence: Secrets to Making BI a Killer App,McGraw-Hill Osborne Media. 2008.
[37] Schiefer, J. and A. Seufert, Management and controlling of time-sensitive business processes with sense ,computational intelligence for modelling. Control and Automation 2005: p. 77-82.
[38] Pramatari, K., Collaborative supply chain practices and evolving technological approaches, Supply Chain Management [39] An International Journal, 2007. 12(3): p. 210–
220.
[40] Fairbank, J.F., et al., Information processing design choices, strategy, and risk management performance. Journal of Management Information Systems 2006. 23(1): p. 293–319. [41] Demirkan, H., et al., Service-oriented technology and management: perspectives on research and practice for the coming decade. Electronic Commerce Research and Applications 2008. 7(4): p. 356–376.
[42] Dos Santos, B., Justifying investments in new information technologies. Management Information Systems Quarterly, 1991. 7(4): p. 71-86.
[43] Goodhue, D.L., Understanding user evaluations of information systems
[44] Science Management Decision, 1995. 41(12): p. 1827–1844.
[45] De Vos, A., et al., Research at grass roots: A primer for the caring professions. 1998: JL van Schaik Pretoria.
[46] Thabane, L., et al., A tutorial on pilot studies: the what, why and how. BMC medical research methodology, 2010. 10(1): p. 1. [47] Diamantopoulos, A. and J.A. Siguaw,
Introducing LISREL: A guide for the uninitiated. 2000: Sage.
[48] Malhotra, N.K., D.F. Birks, and E.I.S. Inc.. Marketing research: an applied approach. 2000: Financial Times, Prentice Hall.
[49] Krieken, v.R., et al., Sociology: Themes and perspectives. New South Wales: Pearson Education Australia, 2000.
[50] Peterson, R.A., A meta-analysis of Cronbach's coefficient alpha. Journal of consumer research, 1994: p. 381-391.
[51] Nunnally, J.C., Psychometric theory (2nd ed). 1978: Tata McGraw-Hill Education.
[52] Hair, J.F., et al., An assessment of the use of partial least squares structural equation modeling in marketing research. Journal of the Academy of Marketing Science, 2012. 40(3): p. 414-433.
[53] Niedergassel, B., Knowledge Sharing in Research Collaborations: Understanding the Drivers and Barriers. 2011: Springer.
[54] Henseler, J. and G. Fassott, Testing moderating effects in PLS path models: An illustration of available procedures, in Handbook of partial least squares. 2010, Springer. p. 713-735.
[55] Tabachnick, B.G. and L. Fidell, Using Multivariate Statistics: International Edition. 2012: Pearson.
[56] Fornell, C. and D.F. Larcker, Evaluating structural equation models with unobservable variables and measurement error. Journal of Marketing Research, 1981: p. 39-50.
[57] Chin, W.W., Commentary: Issues and opinion on structural equation modeling. MIS quarterly, 1998: p. vii-xvi.
[58] Khan, R., Business analytics and supply chain performance: An Empirical Perspective. International Journal of Operations and Logistics Management, 2013. 2(3): p. 43-56. [59] Irfan, D., et al., A SCOR Reference Model of
the Supply Chain Management System in an Enterprise. Int. Arab J. Inf. Technol., 2008. 5(3): p. 288-295.