1275
PROBABILITY DETECTION FOR STATISTICAL MIMO
RADAR: ALGORITHMS AND THEIR ANALYSIS
1SAMIRAN PRAMANIK, 1NIRMALENDU BIKAS SINHAAND 2CHADAN KUMAR SARKAR
1College of Engineering & Management, Kolaghat, K.T.P.P Township,
Purba Medinipur, 721171, W.B, India.
2Jadavpur University, Kolkata 700032, W.B, India
E-mail: [email protected]
ABSTRACT
Multiple-input–multiple-output (MIMO) radar is an emerging technology that has significant potential for advancing the state-of-the-art of modern radar. This is a multiple antenna radar system capable of transmitting arbitrary waveform from each antenna element. Like MIMO communications, MIMO radar offers a new paradigm for signal processing research. It’s significant potentials for fading mitigation, resolution enhancement, and interference and jamming suppression, which can result in significantly improved target detection, parameter estimation, target tracking and recognition performance. To identify a target in statistical MIMO radar system multiple antennas, not closely placed, for transmission and reception is used. This paper introduces the signal processing issued in statistical MIMO radar and coherent MIMO radar for improved target detection and recognition performance. The fundamental difference between statistical MIMO and other radar array systems is that the latter seek to maximize the coherent processing gain, while the former capitalizes on the diversity of target scattering to improve radar performance. Compared to coherent MIMO radar, statistical MIMO radar can offer better parameter identification , higher resolution which allows for much flexibility for transmit beam-pattern design and waveform optimization. This paper focuses on the application of the target spatial diversity to improve detection performance. The optimal detector in the Neyman-Pearson sense is developed and analyzed for the statistical MIMO radar in case of stationary target. The performance improvement achieved by the use of angular diversity in statistical MIMO radar is investigated. The results show that at high and low SNR values statistical MIMO radar provides great improvements of target detection performance over coherent MIMO radar. Finally, a number of numerical examples demonstrated for the effectiveness of the proposed approaches. Therefore, statistical MIMO radar can be applied to enhance radar resolution by allowing the measurement of one scatter at a time.
Keywords: MIMO, Statistical, Coherent, Radar, Probability Detection and SNR.
1. INTRODUCTION:
Standard MIMO radar [1]-[2] takes the opposite direction of the phased-array radar. The approach is to employ multiple uncorrelated waveforms that are radiated via omnidirectional transmission, in compare to phased-array radar [3], where a single probing waveform is sent via directional transmission. Inspired by several publications have advocated the concept of MIMO radar from the system implementation point of view, processing techniques for target detection and parameter estimation. Target parameters of interest in radar systems include target strength, location, and Doppler characteristics. MIMO radar systems employ multiple antennas to transmit multiple
waveforms and engage in joint processing of the received echoes from the target. MIMO radar may be configured with its antennas co-located or widely [9] distributed over an area and able to
provide independent diversity paths. Hence, we can
find two types of MIMO radar: The co-located MIMO [10], [11] radar where the transmitter and the receiver are close enough so that they share the same angle variable, i.e., coherent MIMO radar, and The uncolocated MIMO [3], [4]-[6], radar with widely separated antennas, i.e., statistical MIMO radar.
ISSN: 1992-8645 www.jatit.org E-ISSN: 1817-3195
1276 paths become independent random variables. Thus, each orthogonal waveform carries independent information about the target; spatial diversity about the target is thus created. Exploiting the independence between signals at the array elements, MIMO radar achieves improved detection performance [7], [8] and increased radar sensitivity. Full exploitation of these potentials can
result in significant improvement in target
detection, parameter estimation, target tracking and recognition performance. This is the motivation for using multiple inputs multiple output (MIMO) radar. Thus, each orthogonal waveform carries independent information about the target; spatial diversity about the target is thus created. Exploiting the independence between signals at the array elements, MIMO radar achieves improved detection performance [8] and increased radar sensitivity.
2. PERFORMANCE ANALYSIS
2.1 Coherent MIMO Radar
Coherent MIMO radar uses antenna arrays for transmitting and receiving signals. These arrays may be co-located and even transmit and receive functions can be performed by the same array or the arrays may be separated. The separation between the elements may be uniform or non-uniform. The arrays can be filled or sparse depending on the application type. But the separation is always small compared to the range extent of the target. Whatever the separation between the array elements is, the important point in coherent MIMO radar is that the array elements are close enough so that every element sees the same aspect of the target i.e. the same RCS. As a result, point target assumption is generally used in coherent MIMO radar applications.
2.1.1. Signal model
Consider a coherent MIMO radar system that has transmit and a receive array consisting of M and N elements respectively.
Then the received signal can be written as
𝑦(𝑡) =�𝐸𝑡
𝑀H𝑥(𝑡 − 𝜏) +𝑤(𝑡) … … . (1) Where, �𝐸𝑡⁄ 𝐻𝑥𝑀 (𝑡 − 𝜏) denote the discrete time baseband signal transmitted by the transmit antenna
elements where𝑥(𝑡 − 𝜏) is the input message
signal with delay time, 𝐸𝑡is the total average
transmitted energy and 𝑤(𝑡) is the noise vector.
Fig.1. Coherent MIMO Radar Configuration.
2.1.2. Probability detection
The detection problem here can be formulated as binary hypothesis testing problem as follows:
𝐻0: 𝑦�=𝑤�
𝐻1: 𝑦�=�𝐸𝑡
𝑀 𝛼�+𝑤�
�… … … (2)
Where 𝐻0 indicates absence of signal and 𝐻1 indicates presence of signal.
It is well known that the optimum solution to this hypothesis testing problem under Neyman-Pearson criterion is the Likelihood Ratio Test (LRT). The likelihood ratio test becomes,
‖𝑦�‖2⪌ 𝐻0
𝐻1 𝑇′… … … (3)
To see the performance limit of coherent MIMO
radar, the vector α become identical and coherent
integration of the received samples becomes possible before detection process. The modified binary hypothesis testing problem turns in the form,
𝐻0: 𝑦=𝑤
𝐻1: 𝑦=�𝑀𝐸𝑡
𝑡𝑀𝑁𝛼+𝑤
�… … … (4)
Where 𝒘 is now a complex number.
The probability of false alarm rate, 𝑃𝑓𝑎 can be calculated as,
𝑃𝑓𝑎=𝑃𝑟𝑜𝑏 �𝑒𝑥𝑝 �𝑀𝑁1ơ 𝑤 2�>𝑇′� =𝑒𝑥𝑝 �𝑀𝑁𝑇′ơ
𝑤
2� ….... (5)
Then 𝑃𝑑 can be written in terms of SNR and probability of false alarm rate as,
𝑃𝑑=𝑒𝑥𝑝 �(𝑆𝑁𝑅𝑙𝑛�𝑃)𝑁𝑓𝑎+ 1� �… … . (6)
Target TX
1277 So, the probability of detection does not depend on the number of transmit antennas but depends only on number of receive antennas and SNR.
2.1.3. Results:
To compare with the detection performance of Coherent MIMO Radar, the detector in (6) is implemented. 𝑃𝑓𝑎value is set to 10−6.
[image:3.612.317.520.79.267.2]If the number of receive elements is held constant at the value of 5, and the number of transmit elements is increased, the 𝑃𝑑 vs SNR curve in Fig. 2 is obtained.
Fig. 2. Probability Of Detection For Coherent MIMO Radar, Changing M
The graphics in Fig. 2 show that the detection performance does not change with increasing M. This is because the transmitted power is normalized and it does not change with the number of transmit elements, and also because the noise power and the signal power in the received signal after coherent summation increase at the same rate.
[image:3.612.94.295.237.422.2]If the number of transmit elements is held constant at the value of 5 and the number of receive elements is increased, the 𝑃𝑑vs SNR curve in Fig. 3 is obtained. We can see from the graph that as number of receiving antennas is increased the probability of detection increases, because the total received energy increases.
Fig 3: Probability Of Detection For Coherent MIMO Radar, Changing N.
2.2. Statistical MIMO radar
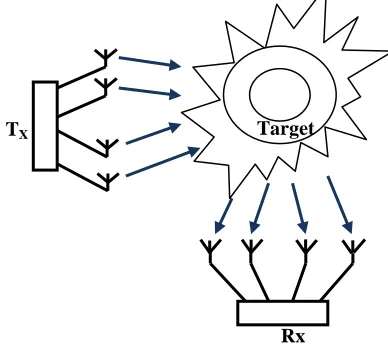
Statistical MIMO radar employs antenna arrays which are widely separated. The inter element spacing in an array is also so large that each transmit-receive pair sees a different aspect of the target and thus sees different RCS due to target’s complex shape. If the spacing between the antennas elements is wide enough, received signals from each transmit receive pair become independent. This is called spatial or angular diversity. Statistical MIMO radar focuses on this property.
2.2.1. System Model
The model of the statistical MIMO radar system is shown in Fig. 4 where transmitters and receivers be widely separated.
Fig. 4. Statistical MIMO Radar Configuration.
If the received signal is fed to a bank of matched filters each of which is matched to𝑥𝑚(𝑡), and the corresponding output is sampled at the time instant,
-20 -15 -10 -5 0 5 10 15 20 25 30
0 0.1 0.2 0.3 0.4 0.5 0.6 0.7 0.8 0.9 1
SNR(dB)
pr
obabi
li
ty
of
det
ec
ti
on
probability of detection for coherent MIMO radar
MIMO ,M=1,N=5 MIMO ,M=3,N=5 MIMO ,M=5,N=5 MIMO ,M=8,N=5 MIMO ,M=12,N=5
-20 -15 -10 -5 0 5 10 15 20
0 0.1 0.2 0.3 0.4 0.5 0.6 0.7 0.8 0.9 1
SNR(dB)
pr
obabi
li
ty
of
det
ec
ti
on
probability of detection for coherent MIMO radar
MIMO ,M=5,N=1 MIMO ,M=5,N=3 MIMO ,M=5,N=5 MIMO ,M=5,N=8 MIMO ,M=5,N=12
Rx
[image:3.612.323.517.476.654.2]ISSN: 1992-8645 www.jatit.org E-ISSN: 1817-3195
1278 then the output of the matched filter bank can be written in the vector form as
𝑦�= �𝐸𝑡
𝑀 𝛼�+𝑤� … … … (7)
Where 𝑦� is a MN × 1 complex vector whose
entries correspond to the output of the each
matched filter at every receiver,𝛼� is a MN × 1
complex vector that contains all the elements of
channel matrix (H) and 𝑤� is a MN × 1 complex
noise vector.
2.2.2. Probability detection
Statistical MIMO Radar can be formulated as binary hypothesis testing problem for H0 indicates
absence of signal and H1 indicates presence of
signal.
𝐻0: 𝑦�=𝑤�
𝐻1: 𝑦� =�𝐸𝑀 𝛼�𝑡 +𝑤��… … … (8)
It is well known that the optimum solution to this hypothesis testing problem under Neyman-Pearson criterion is the Likelihood Ratio Test (LRT) as,
𝑝(𝑦�|𝐻1,𝐶,𝐴)
𝑝(𝑦�|𝐻0,𝐶) ⪌𝐻0
𝐻1 𝑇… … … … (9)
The 𝑃𝑓𝑎 can be calculated as in terms of
threshold𝑇′,
𝑃𝑓𝑎=𝑃𝑟𝑜𝑏 �ơ𝑤 2
2 𝜒2𝑀𝑁2 >𝑇′� =𝑃𝑟𝑜𝑏 �𝜒2𝑀𝑁2 >ơ2
𝑤 2 𝑇′�
= 1− 𝑄𝜒2𝑀𝑁2 𝑒𝑥𝑝 �2
ơ𝑤2 𝑇
′�… … (10)
Where, 𝑄𝑥
2𝑀𝑁
2 represents the cumulative
distribution function of a Chi-squared random. The 𝑃𝑑 can be calculated in terms of 𝑃𝑓𝑎and SNR as,
𝑃𝑑= 1− 𝑄𝜒2𝑀𝑁2 �
1
�𝑆𝑁𝑅𝑀 + 1�𝑄𝜒2𝑀𝑁2
−1 �1
− 𝑃𝑓𝑎��… … . (11)
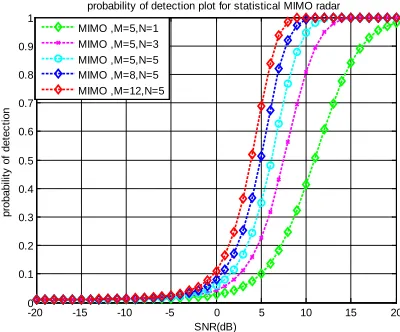
2.2.3. Results and Observation
To compare with the detection performance of statistical MIMO radar, the probability detection in
equation (11) is implemented for which𝑃𝑓𝑎value is
set to10−2.If the number of receiving elements is
held constant at the value of 5, and the number of
transmitting elements is increased, the 𝑃𝑑vs. SNR
[image:4.612.317.519.91.287.2]curve in Fig. 5 is obtained.
Fig. 5. Probability Of Detection For Statistical MIMO Radar, Changing M.
It is interesting to see that the detection performance decreases as the number of transmitting antennas increases. Because of this decrease in the detection performance; using more widely separated receiving antennas instead of increasing the number of spatially diverse transmitting antennas seems more reasonable. If the number of transmitting elements is held constant at the value of 5, and the number of
receiving elements is increased, the 𝑝𝑑vs.SNR
[image:4.612.317.517.453.619.2]curve in Fig. 6 is obtained.
Fig. 6. Probability Of Detection For Statistical MIMO Radar, Changing N.
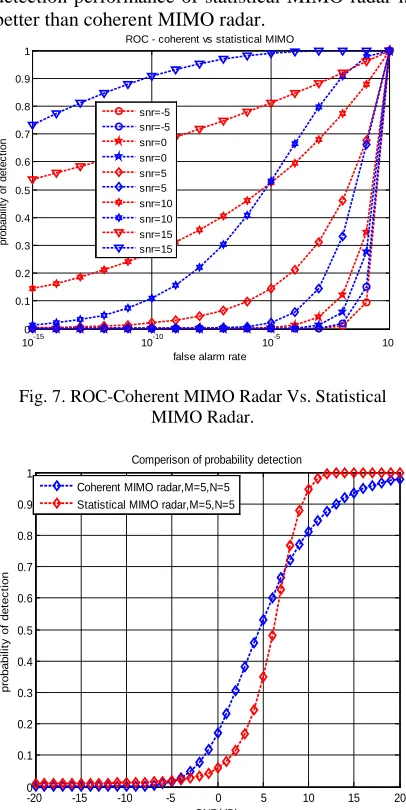
The ROC of coherent MIMO radar versus statistical MIMO radar and also comparison of probability detection of both type of MIMO radar are is given in Fig. 7 and Fig. 8 respectively. These figures are obtained using the analytical expressions given in
-10 -5 0 5 10 15 20
0 0.1 0.2 0.3 0.4 0.5 0.6 0.7 0.8 0.9 1
SNR(dB)
pr
obabi
lit
y
of
det
ec
ti
on
probability of detection for statistical MIMO radar
MIMO ,M=1,N=5 MIMO ,M=3,N=5 MIMO ,M=5,N=5 MIMO ,M=8,N=5 MIMO ,M=12,N=5
-20 -15 -10 -5 0 5 10 15 20
0 0.1 0.2 0.3 0.4 0.5 0.6 0.7 0.8 0.9 1
SNR(dB)
pr
obabi
li
ty
of
det
ec
ti
on
probability of detection plot for statistical MIMO radar
1279 Equations (6), (11) for=𝑁= 5 . In the figure the blue lines belong to statistical MIMO radar and the red lines belong to coherent MIMO radar.
The results in Fig.7 and 8 show that at high SNR values and at high detection probabilities, the detection performance of statistical MIMO radar is better than coherent MIMO radar.
[image:5.612.93.296.159.564.2]Fig. 7. ROC-Coherent MIMO Radar Vs. Statistical MIMO Radar.
Fig. 8. Comparison Of Probability Detection Of Statistical MIMO Radar Vs. Phased Array Radar.
7. CONCLUSION
In this paper, we have presented a wide variety of signal processing algorithms for statistical MIMO radar and coherent MIMO radar. A novel algorithm on the space-time adaptive processing is proposed for improving the performance of statistical MIMO radar system. Derivations of the respective optimal detectors are shown when the target and noise level are either known or unknown. The statistical MIMO radar outperforms the coherent MIMO radar
at high detection rates which enables RCS fluctuation smoothing is demonstrated. The waveform design problem with information about the target and the clutter responses are being dealt. We have provided several numerical examples which show that the statistical MIMO radar has much better performance. We have proposed an iterative algorithm for jointly designing the transmitting waveforms and the receiving filters to maximize the SNR in statistical and coherent MIMO radar and also the algorithm converge faster. We also proposed a new metric to analyze the performance of these systems. Development of an adaptive optimal energy allocation mechanism is done to get significant improvement in performance. Finally we simulated a realistic scenario to analyze the performance of the proposed system.
REFERENCES
[1] E. Fishler, A. Haimovich, R. Blum, D. Chizhik, L. Cimini, and R. Valenzuela, “MIMO Radar: An idea whose time has come”, proceedings of IEEE radar Conference, pp.71-78, April 2004. [2] N.H.Lehmann, E.Fishler, A.M.Haimovich, et
al.,“Evaluation of transmit diversity in MIMO-radar direction finding, IEEE Transactions on Signal Processing, vol.55, no.5, pp. 2215-2225, May 2007.
[3] A. Haimovich, R. Blum, and L. Cimini, “MIMO radar with widely separated antennas,” IEEE Signal Processing Magaz., vol. 25, pp. 116–129, Jan. 2008.
[4] J. Li and P. Stoica, MIMO Radar Signal Processing. New York: Wiley-IEEE Press, Oct. 2008.
[5] Yu Zhang, and Jianxin Wang , “Transmit-receive beamforming for MIMO radar”, IEEE 2nd International Conference on Signal Processing Systems (ICSPS),Dalian, vol.3, pp. v3-803 - v3-806 , (5-7) July 2010 .
[6] D. Wilcox, and M. Sellathurai, “On MIMO RadarSub-arrayTransmit Beamforming”IEEE Transactions on Signal Processing, VOL. 60, NO. 4, APRIL 2012.
[7] Murat Akçakaya, and Arye Nehorai, “MIMO Radar Sensitivity Analysis for Target Detection” IEEE Transactions on Signal Processing, VOL. 59, NO. 7, JULY 2011.
[8] Hana Godrich, and Alexander M. Haimovich, and Rick S. Blum, “Target localization accuracy gain in MIMO radar-based systems”, IEEE Transaction on Information Theory, Vol.56, No.6, pp. 2783-2803, June 2010.
10-15 10-10 10-5 10
0 0.1 0.2 0.3 0.4 0.5 0.6 0.7 0.8 0.9 1
false alarm rate
pr
obabi
lit
y
of
det
ec
ti
on
ROC - coherent vs statistical MIMO
snr=-5 snr=-5 snr=0 snr=0 snr=5 snr=5 snr=10 snr=10 snr=15 snr=15
-20 -15 -10 -5 0 5 10 15 20
0 0.1 0.2 0.3 0.4 0.5 0.6 0.7 0.8 0.9 1
SNR(dB)
pr
obabi
li
ty
of
det
ec
ti
on
Comperison of probability detection
Coherent MIMO radar,M=5,N=5
ISSN: 1992-8645 www.jatit.org E-ISSN: 1817-3195
1280 [9] J. Li and P. Stoica, “MIMO radar with
colocated antennas,” IEEE Signal Processing Magaz., vol. 24, no. 5, pp. 106–114, Sept. 2007. [10] Yang Yang and Rick S. Blum,” Phase
Synchronization for Coherent MIMO Radar: Algorithms and Their Analysis” IEEE
TRANSACTIONS ON SIGNAL
PROCESSING, VOL. 59, NO. 11, pp. 5538-5557, NOVEMBER 2011.
![Assessment of Physiological Health Status in Relations to Different Anthropometric and Cardio respiratory Measures of Head Supported Load Carrying Male Porters of Sikkim, India [Article Retracted]](data:image/gif;base64,R0lGODlhAQABAIAAAP///wAAACH5BAEAAAAALAAAAAABAAEAAAICRAEAOw==)