2019 International Conference on Computer Science, Communications and Multimedia Engineering (CSCME 2019) ISBN: 978-1-60595-650-3
Role Recognition Method Based on Network Flow Characteristics
Tao YU
1and Rui-qi YUE
21
Beijing Institute of Tracking and Telecommunications Technology, Beijing, China 2
Science and Technology on Information Systems Engineering Laboratory, National University of DT, Changsha, China
Keywords: Intranet security, Network flow, Organizational role, Random forest.
Abstract. Network user behavior analysis is very important for the security of large organizations' intranet. In order to analyze the behavior of Intranet users, it is necessary to identify the roles of Intranet users. In this paper, a role recognition method based on network flow characteristics is proposed for organizational intranet, which is a specific network space. Firstly, the interactive distribution characteristics of network flow based on information entropy are used to describe the distribution characteristics of different network nodes. Secondly, traffic characteristics are used to analyze the interaction flow between nodes. Finally, based on these feature sets, Stochastic Forest method is applied to recognize the role of intranet. Experiments on real intranet data verify the effectiveness of the proposed method.
Introduction
Private Intranet is an important basis for daily communication and operation of organizations or enterprises. Intranet attacks may cause huge financial losses and reputation damage. Therefore, data-driven Intranet security tools and analysis methods have attracted great attention in recent years. In many data, network flow is very important for intranet security monitoring. A typical Netflow data
includes source IP (srcIP), source port (srcPort), destination IP (dstIP), destination port (dstPort),
protocol, bit number and timestamp, etc. Because it is very difficult to analyze the total traffic of the network, Cisco has developed Netflow protocol [1], which collects the complete traffic data as a sample stream, so that network administrators can use Netflow and analysis tools to identify malicious behavior of users. However, the current features provided by Netflow tools are only applicable to simple statistical analysis, which is not enough to support analysis such as role recognition and discovery of new attacks.
Network role recognition is to automatically divide users, hosts and services based on network interaction into different groups, each group has different behavior patterns. Role classification has been widely studied in the field of social networks [2]. Because intranets can be regarded as some kind of social networks, some indicators or methods commonly used in the study of social networks can be applied to the analysis of intranets interaction, such as measuring the degree of importance of nodes, outcomes and so on. The basis of role classification is traffic classification, which can be divided into four categories: port-based classification, payload-based classification, statistical classification and behavior classification [3]. Although there are still some problems in Netflow, such as data packet loss due to router flooding by massive data records, it is still a very useful resource for role recognition [4].
computer science, such as intrusion detection [9], rough set theory [10] and privacy protection [11]. Compared with Xu et al., this paper focuses on role classification rather than behavioral portraits.
Characteristic Construction of Network Flow
Appropriate network flow characteristics can effectively characterize the user's behavior characteristics. Network flow features based on simple statistics contain redundant information. In order to compress information and extract more compact network flow features, this paper uses entropy to quantify the uncertainty contained in the data.
For a random variable X, its possible number of values is NX, assuming that take sampling m
times, a random distribution on X is obtained, ( )p xi m mi , xiX , in which mi denotes the
number of times xi was observed, then the Shannon entropy of X is defined as [13]:
:
log
i X i i
x
H X p x p x
(1)Formula (1) shows that the more the number of possible values of X, the more average the
probability distribution and the larger the entropy value. It is noted that the maximum number of
different values of X that may be observed in m times observations is min{N mx, } , thus the
maximum possible value of entropy is Hmax
X log min{N mx, }, i.e., 0H X
log min{N mx, }.It is known that the maximum value of H (X) is affected by m and NX. In order to measure the
uncertainty of variable X under the condition that m observations have been obtained, H (X) should be
standardized. Therefore, Shannon entropy should be replaced by Relative Uncertainty (RU), then we
have:
max log min X,
H X H X
RU X
H X N m
(2)
RU (X) takes values from 0 to 1. When RU (X) = 0, it means that the observed m values are the
same, that is, there exists a certain value xX , so that p (x) = 1. In this case, there is no uncertainty in
the observation set. Let A denotes the set of observations of X, under the condition of mNx, if and
only if A m and for any xiA, ( )p xi i m, then RU (X) = 1. That is to say, m observations are
different from each other, and the observation set shows the greatest uncertainty. At this time, RU (X)
measures the stochastic degree of X. In this case of mNx, if and only if mi m N/ x, i.e., for any
i
x A, ( ) 1p xi Nx, then RU (X) = 1. In this case, RU (X) is used to measure the uniformity of the
random distribution. In this article, m Nx.
For a dimension X (such as srcIP) and a time period T in Netflow Quaternion (srcIP, dstIP, srcPort,
dstPort), m is used to represent the number of all network flows generated in T, and the set
1 2
{ , , , n}
A a a a , n2 is used to represents the values of X dimension in these network flows, mi
denotes the number of network flows whose value is ai. Then the probability distribution on X can be
expressed as pi P aA( )i m mi / . Then RU(PA) measures the degree of randomness of dimension X
in time period T. For the network flow in time T with source IP = 𝑠𝑟𝑐𝐼𝑃, we calculate the relative
uncertainty of the other three dimensions in the network flow set (RUdstIP,RUsrcIP,RUdstPort). This
triple describes the characteristics of the interaction behavior distribution of the intranet individual
i
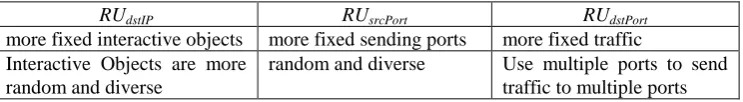
Table 1. Relationship between relative uncertainty and distribution of interaction behaviour.
RUdstIP RUsrcPort RUdstPort
more fixed interactive objects more fixed sending ports more fixed traffic Interactive Objects are more
random and diverse
random and diverse Use multiple ports to send traffic to multiple ports
In order to characterize the behavior patterns of individual Intranet in the morning, afternoon and
evening of a day, the sampling time periods are 8:00 to 12:00 (T1), 12:00 to 18:00 (T2), 18:00 to 24:00
(T3), respectively. For individuals peri with source IP = 𝑠𝑟𝑐𝐼𝑃, the relative uncertainties in three
periods are calculated as their network flows. Connection Distribution Features (CDF) is showed as:
, ,
i
per j dstIP j srcPort j dstPort
CDF T RU T RU T RU (3)
The calculation of the above-mentioned entropy only takes into account the number of interactions between nodes, but does not take into account the flow of network flows. For a network individual
i
per with source IP = 𝑠𝑟𝑐𝐼𝑃, the total network traffic in time T is defined as ,
i
per TFs
, the number ofnetflows of peri in time T is ,
i
p T
netflow ,thus the average network traffic of peri is defined as:
,,
,
i i
i
per T
per T
per T Fs Avg Fs
netflow
(4)Taking T1, T2, T3 as the three time periods of morning, afternoon and evening, the network flow
characteristics of network individual peri are recorded as follows:
1 2 3
, , , , ,
i i i i
per per T per T per T
Avg Fs Avg Fs Avg Fs Avg Fs (5)
i
per
Avg Fs describes the traffic characteristics of network individuals in one day.
Role Recognition Based on Random Forest
Random Forest [12] is used to classify unknown network individuals based on known role information and network flow characteristics. Random forest model has been widely used in many fields due to its advantages of less parameter adjustment, less over-fitting and providing importance ranking of classification features.
The specific process of role recognition of network individuals based on network flow characteristics using stochastic forest model is as follows:
(1) Establish the eigenvector model, i.e., the network flow feature set
( )
C i
F per ( ,
i
per
CDF ( ))
i
per
Avg Fs , and use (F pC( i), )ri to represent all training examples, where ri
represents the role label.
(2) Assuming that there are N samples in the training set S, N training samples are extracted from S
by using the bagging sampling method with playback as the training set Si of the ith tree, and the ith
decision tree ti is constructed based on Si.
(3) The construction method of decision tree ti: If the number of features in the network flow
feature set FC is m, the dimension features mtry are randomly selected, and the best classification
up. In the process of constructing each decision tree, mtry is a fixed value, usually
2
int(log 1)
try
m m .
(4) Repeat steps (2) and (3) until k decision trees are established to complete the construction of
random forests.
(5) Random forests are used to classify the roles of network individuals with unknown roles. The role labels are obtained by considering the classification results of all decision trees. The common
methods are voting and probability averaging. That is, when the network flow characteristics FC(pi)
of the network individual with unknown roles are obtained, the judgment of the role rp of the network
individual is as follows:
Voting, arg max 1 1 i,
i
N h c
p c i
h n
r I
N n
, (6)
Probability averaging, ,
1
1
arg max i
i
N h c
p c i i
h n r
N n
, (7)
In which, N is the total number of decision trees in random forests, I( ) is the indicative function,
,
i
h c
n is the classification result of decision trees for class C,
i
h
n is the number of leaf nodes hi.
Experimental Analysis
This paper studies the internal network environment of a unit, and the network structure is connected with the external Internet. The whole network is divided into seven sub-networks. All network data packets will pass through the central switch, and aggregate the data packets into network flows in the core switch. Seven subnets correspond to six functional departments and one server. If only personal computers are considered in each department, the set of roles R={department 1, Department 2, Department 3, Department 4, Department 5, Department 6, server}. The IP address of the server is
fixed, that is, there is only a single element in per ipi. . The IP address of the PC is dynamically
allocated, that is, there are many IP addresses in per ipi. , but only one IP address at the same time. By
collecting the data from the core switch, the network flow data generated by 661 hosts in the intranet during the 17 days from November 11 to November 27, 2016 are obtained. There are 195,037,491 data records in total, and the data size is 29.63GB.
By calculating each network flow of 𝑠𝑟𝑐𝐼𝑃, a total of 2 390 CDFs are obtained. Each CDF
corresponds to the random degree characteristics of an intranet individual's interaction behavior on a
given day. Three dimensions (RUdstIP,RUsrcIP,RUdstPort) of the CDF are scattered in three time
M o rn in g 0.2 0.4 0.8 0.6 0.2 0.4 0.8 0.6 A ft er n o o n0.0 0.0 0.2 0.4 0.8 0.6 E v en in g 0.0 Morning 0
.2 0.4 0.6 0.8
0
.0
Afternoon
0
.2 0.4 0.6 0.8
0
.0
Evening
0
.2 0.4 0.6 0.8
0
.0 1.0
1.0 M o rn in g 0.2 0.4 0.8 0.6 0.2 0.4 0.8 0.6 A ft er n o o n0.0 0.0 0.2 0.4 0.8 0.6 E v en in g 0.0 Morning 0
.2 0.4 0.6 0.8
0
.0
Afternoon
0
.2 0.4 0.6 0.8
0
.0
Evening
0
.2 0.4 0.6 0.8
0
.0 1.0
1.0 M o rn in g 0.2 0.4 0.8 0.6 0.2 0.4 0.8 0.6 A ft er n o o n0.0 0.0 0.2 0.4 0.8 0.6 E v en in g 0.0 Morning 0
.2 0.4 0.6 0.8
0
.0
Afternoon
0
.2 0.4 0.6 0.8
0
.0
Evening
0
.2 0.4 0.6 0.8
0
.0 1.0
1.0
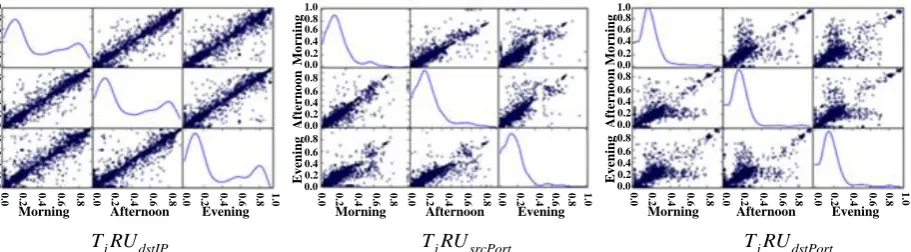
[image:5.595.76.532.73.199.2]T RUj dstIP T RUj srcPort T RUj dstPort
Figure 1. Dispersion Graph Matrix of CDF.
From Figure 1, we can see that the relative uncertainties of the three dimensions are distributed in low-value areas, which shows that most of the intranet objects studied have relatively fixed patterns of interaction behavior, and only a small number of individuals will switch or use more ports between multiple interactive objects, that is, individuals are "uncertain". In the morning, afternoon and
evening, it can be seen from the scatter graph matrix T RUj dstIP that the scatter points in the scatter
graph matrix are mainly distributed on the diagonal line, indicating that the uncertainty of most individuals in choosing interactive objects does not change with the time period; in the scatter graph
matrix T RUj srcPort and T RUj dstPort, although the overall distribution of relative uncertainties in the
three intervals are similar, but the distribution of walking points is scattered, which indicates that the uncertainty of using interactive ports varies with time.
According to the different roles and departments of Intranet individuals, we can divide the involved
intranet individuals (srcIP) into seven categories, including the intranet individuals belonging to six
different departments (represented by departments 1 to 6) and the intranet individuals belonging to server roles. Accordingly, in a total of 2390 CDFs, the number of CDFs calculated by individuals belonging to seven roles as benchmarks is shown in Table 2. In order to compare the behavior patterns of Intranet individuals of these roles, the distribution histograms of these roles on (RUdstIP,RUsrcIP,RUdstPort) are drawn, as shown in Table 3. Since most uncertainties do not change much over time, in order to compare the statistical differences among individuals with different roles, the three periods are regarded as equal sampling intervals without considering the distinction of time periods.
In terms of interactive objects, it can be seen from the distribution histogram of RUdstIP that the
other five departments are mainly distributed in the low-value areas, except for the middle-high value areas (>0.3) of the 6th departments. The results show that only 6 departments have relatively average distribution of interaction objects and have greater uncertainty. The vast majority of individuals in the
remaining 5 departments have smaller range of interaction objects and lower uncertainty. RUdstIP of
Department 1 has a maximum of 0.6 and little distribution above 0.3, which indicates that Department
1 has the lowest uncertainty in terms of interactive objects among the six Departments. RUdstIP of
Department 2 has a part of the high value range from 0.7 to 0.8, which indicates that although most individuals in Department 2 show low uncertainty in the interaction object, there are still a small
number of individuals with high uncertainty. The main distribution range of RUdstIP of servers is
some servers only go to more fixed individuals and end-to-end. Ports send reply messages, while
some servers send reply messages to different ports of different individuals at the same time. RUsrcPort
of Departments 1 and 4 are mostly concentrated in high-value areas, that is, the ports used to send messages are more uncertain, which reflects the working characteristics of these two departments
through multi-ports for a variety of services. The RUsrcPort and RUdstPort of department 6 are
concentrated in very low areas, which indicates that Department 6 has very low uncertainty in port usage, that is, the network interaction is concentrated on fewer ports, reflecting the scarcity of business types processed through intranet. The other three departments, Department 2, Department 3
and Department 5, have similar RUsrcPort and RUdstPort value distribution patterns respectively, which
indicates that they have similar behavior rules in the use of Intranet ports.
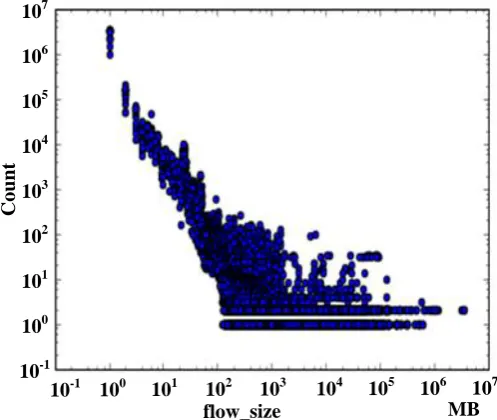
In order to analyze the size and distribution of network traffic in the whole intranet, a scatter plot of network traffic is drawn from the collected network flow data, as shown in Figure 2. Among them, the horizontal axis represents the size of network traffic, in megabytes (MB) as a unit, and the vertical axis represents the number of network traffic corresponding to the size of traffic in that period, where logarithmic coordinates are used. It can be seen that traffic distribution charts show the characteristics of heavy-tailed distribution, that is, most network traffic only transmits a small amount of traffic, and most traffic is concentrated on a small amount of data flow.
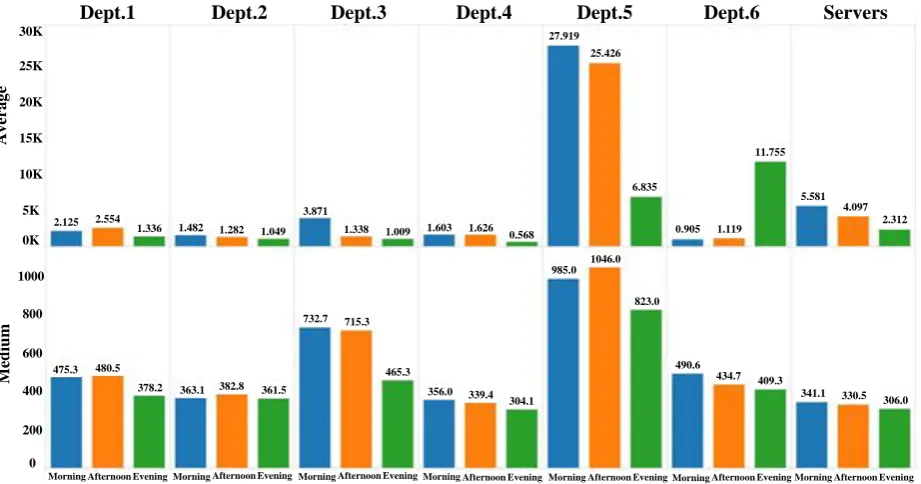
In order to compare the difference of network traffic characteristics among different roles of Intranet individuals, the average traffic is divided according to the roles of Intranet individuals, and the average and median values of each role are calculated. The results are shown in Figure 3. The bar chart above shows the average traffic of individuals with different roles in the morning, afternoon and evening, while the bar chart below shows the median. On average, Section 5 has the highest average traffic, followed by servers, while Section 6 has the highest average traffic in the evening, although the average traffic in the day is low. In addition, the average traffic in the day is significantly higher than that in the night except Department 6. From the median point of view, the average traffic of department 6 in the day is higher than that in the night. Considering the heavy tail of traffic distribution, it can be inferred that this difference is due to the significant increase of the "tail" traffic of department 6, i.e. a small number of individuals in the evening.
10-1 100 103 102 101 107 106 105 104
C
o
u
n
t
10-1 100 101 102 103 104 105 106 107
[image:6.595.172.421.488.698.2]flow_size MB
Dept.1 Dept.2 Dept.3 Dept.4 Dept.5 Dept.6 Servers
10K 5K 0K 30K 25K 20K 15K
A
v
er
a
g
e
200 0 1000
800 600 400
M
ed
iu
m
Morning Afternoon Evening Morning Afternoon Evening Morning Afternoon Evening Morning Afternoon Evening Morning Afternoon Evening Morning Afternoon Evening Morning Afternoon Evening
2.125 2.554
1.336 1.482 1.282 1.049 3.871
1.338 1.009 1.603 1.626 0.568
475.3 480.5
378.2 363.1 382.8 361.5
732.7 715.3
465.3
356.0 339.4 304.1
985.0 1046.0
823.0
490.6
434.7 409.3
341.1 330.5 306.0 27.919
25.426
6.835
0.905 1.119 11.755
5.581 4.097
[image:7.595.64.525.77.319.2]2.312
Figure 3. Average Traffic of Individuals in Different Roles Intranet.
Summary
In view of the special network environment of organizational intranet, this paper classifies the roles of different individuals in the intranet by using network flow data and constructing a network flow feature set that can describe the characteristics of interaction distribution and interaction flow. Experiments show that the network flow feature set proposed in this paper can better characterize the interaction behavior characteristics of Intranet individuals, and based on random forest, it can classify the roles according to the network flow data generated by intranet individuals, thus providing a basis for anomaly detection of network users. In the future, more effective features will be proposed to describe Netflow, and other classification methods will be explored to achieve better role recognition results.
References
[1] C. Estan, K. Keys, D. Moore and G. Varghese, “Building a better Netflow,” Conference on Applications, Technologies, Architectures, and Protocols for Computer Communication, USA, pp. 245-256, August/September 2004.
[2] S. Zhang, X. Liang and J. Qi, “A review on role identification methods in social networks,” Chinese Journal of Computers, vol. 40, pp. 649-673, 2017.
[3] N. A. Khater and R. E. Overill, “Network traffic classification techniques and challenges,” Tenth International Conference on Digital Information Management, South Korea, pp. 43-48, October 2015.
[4] N. G. Duffield and C. Lund, “Predicting resource usage and estimation accuracy in an IP flow measurement collection infrastructure,” 2003 Internet Measurement Conference, USA, pp. 179-191, October 2003.
[6] B. AsSadhan, K. Zeb, J. Al-Muhtadi and S. Alshebeili, “Anomaly detection based on LRD behavior analysis of decomposed control and data planes network traffic using SOSS and FARIMA models,” IEEE Access, vol. 5, pp. 13501-13519, 2017.
[7] Q. Dong, Q. He, H. Chai, Y. Wang and S. He, “PM-IUBC: A P2P and MongoDB based intranet user behavior control system,” Journal of Communications, vol. 10, pp. 1027-1036, 2015.
[8] K. Xu, Z. Zhang and S. Bhattacharyya, “Profiling internet backbone traffic: behavior models and applications,” Conference on Applications, Technologies, Architectures, and Protocols for Computer Communications, USA, pp. 169-180, August 2005.
[9] P. Tang and Z. Zhang, “Multi-agent DDOS attack detection based on information entropy,” Computer Science, vol. 35, pp. 292-295, 2008.
[10] J. Liang and Z. Shi, “The information entropy, rough entropy and knowledge granulation in rough set theory,” International Journal of Uncertainty, Fuzziness and Knowledge-Based Systems, vol. 12, pp. 37-46, 2008.
[11] C. Peng, H. Ding, Y. Zhu, Y. Tian and Z. Fu, “Information Entropy Models and Privacy Metrics Methods for Privacy Protection,” Journal of Software, vol. 27, pp. 1891-1903, 2016.
[12] A. Cutler, D. R. Cutler, J. R. Stevens. “Random Forests”, Machine Learning, vol. 45, No. 1, pp. 157-176, 2004.