2018 International Conference on Computer, Communication and Network Technology (CCNT 2018) ISBN: 978-1-60595-561-2
A Self-Positioning Algorithm Based on Wireless Signal's
Angle of Arrival and its Evaluation
Jie-tai WANG
1,*, Xiao-niu YANG
2,3, Zhen-xing LUO
2,3,
Zi TENG
1and Xing LING
11
Mathematics and Information Engineering College, Jiaxing University, Jiaxing, China, 314001
2
Science and Technology on Communication Information Security Control Laboratory, Jiaxing, China, 314033
336 Research Institute of CETC, Jiaxing, China, 314033
*Corresponding author
Keywords: Wireless signal, Self-positioning, AOA.
Abstract. This paper proposes an algorithm based on angle of arrival (AOA) of the wireless signal, and makes a simulation evaluation of the results of the algorithm in different scenarios. The evaluation shows that the positioning method based on the angle is effective in the positioning of multiple base stations.
Introduction
Recently, with the popularity of wireless networks and the development of pervasive computing, the topic of wireless positioning is widely concerned. As it is well known, the position of wireless terminal can be determined by a variety of ways, such as Time of Arrival (ToA), Time Difference of Arrival (TDoA), or Angle of Arrival (AoA)[1-3]. Neglecting the first two techniques that require time synchronization and the capability of high sampling rate, there exist several algorithms that allow us to estimate the AoA[4-6].
This paper focus on the evaluation of AOA positioning algorithm. For the angle of the wireless signal received by the terminal from transmitter, i.e., the angle of arrival (Angle of Arrival), this paper mainly proposes an AOA positioning algorithm based on the least square method, and analyzes the positioning effect of this algorithm.
This paper has the following background assumptions:
(i) Assume that the wireless terminal can receive all the wireless signals of the transmitters involved in positioning;
(ii) Regardless of the mounting height of the transmitters and the impact of the surrounding environment on the signal of transmitters;
(iii) Establish a coordinate system to express the position of the transmitters and the position of the terminal in the form of coordinates;
(iv) The number of transmitters is greater than or equal to 3.
Under these assumptions, this paper mainly describes the following results:
(i) The influence of the distance between the terminal position and the transmitting station on the positioning accuracy;
(ii) The effect of the error angle of the launch pad on the positioning accuracy; (iii) Impact of the number of transmitters on the positioning accuracy.
AOA Localization Algorithm Based on Least Square Method
The algorithm uses the following assumptions:
(i) assumes there are M transmitters with coordinates , , i = 1,2,3 … M, M > 2; (ii) Each transmitter provides angular measurements:
The angle with the abscissa: i ∈ − ,
(iii) The coordinates of the observation point are , It’s easy to know that:
=
, so:
− ∙ sin− − ∙ cos= 0, =
1,2,3 …
is the actual angle from transmitter to observation point, actually, only the actual measurement angle can be obtained, there is a deviation between this angle and the real angle. The maximum value of the given error angle range satisfies Gaussian distribution with zero expectation and fixed variance. Assume that the model of each transmitter is the same, so the error corresponding to the measured angle is also the same, that is, the variance of each error angle distribution is the same.
So the following equation can be deducted:
ε() = x,− x ∙ sinθ,− y,− y ∙ cosθ,
= x,− x ∙ sinθ,+ ∆θ, − y,− y ∙ cosθ,+ ∆θ,
≈ x,− x ∙ 2sinθ,+ cosθ,∙ ∆θ,3 − y,− y ∙ 2cosθ,− sinθ,∙ ∆θ,3 = 2x,− x ∙ cosθ,+ y,− y ∙ sinθ,3 ∙ ∆θ,
= r,∙ ∆θ,.
Among the equation,r,= 5x,− x+ y,− y i=1,2,3…M
Mark R = 7
r8 ⋯ 0
⋮ ⋱ ⋮ 0 ⋯ r,
<
,×,
∆θ = 7
∆θ8 ⋮ ∆θ, < ,×8
H = 7
y8∙ cosθ8− x8∙ sinθ8
⋮
y,∙ cosθ,− x,∙ sinθ,
<
,×8
G = 7
−sinθ8 cosθ8
⋮ ⋮
−sinθ, cosθ,
<
,×
ξ = xy ×8
According to the above approximate equation, the matrix approximate equation can be obtained:
ξA = GB∙ G8∙ GB∙ H
First, observe the situation where the angle error measured by terminal is positive or negative, but with the same absolute value. In the following analysis, the error angle is the maximum value of the error angle range given by the transmitter.
The area where terminal located is a square area with side length of 200 and center of (0,0). The step lengths of horizontal and vertical coordinate are set to 1.
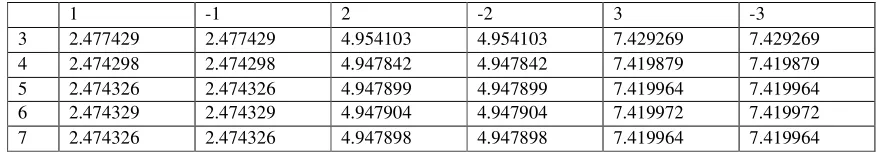
[image:2.612.85.525.512.590.2]The first row of Table 1 is the angle error, the first column of Table 1 is the number of transmitters involved in positioning, the data are the maximum positioning error in the selected area when the number of transmitters and the error angle are determined..
Table 1. Maximum positioning error in selected area with positive/negative angle error.
1 -1 2 -2 3 -3
3 2.477429 2.477429 4.954103 4.954103 7.429269 7.429269
4 2.474298 2.474298 4.947842 4.947842 7.419879 7.419879
5 2.474326 2.474326 4.947899 4.947899 7.419964 7.419964
6 2.474329 2.474329 4.947904 4.947904 7.419972 7.419972
7 2.474326 2.474326 4.947898 4.947898 7.419964 7.419964
As can be seen from the tables, when the angle error is deviated to the left or the same angle to the right, the position error resulting from the same absolute angular error is the same, so in the following analysis, this paper only considers the positive angle error.
Simulating Analysis of the Algorithm
When Number of Transmitter is the Same and the Angle Error is Fixed (2°), the Relationship between the Terminal Distance and the Positioning Error
shown in Figure 1 (the texts below the subfigure show the minimum positioning error and maximum positioning error value in this area):
Minimum Positioning Error:0.0120 Minimum Positioning Error:0.0179 Minimum Positioning Error:0.0172 Maximum Positioning Error:4.9923 Maximum Positioning Error:6.2935 Maximum Positioning Error:13.9821
(1) (2) (3)
Figure 1. Positioning error map with min/max value when lines of connecting three transmitters coming into triangle.
The range of the horizontal and vertical coordinate is 100 meters away from the triangle centroid. The text above the figure gives the coordinate point and angle error of the corresponding transmitter, and the blue line segment is the connecting line of the transmitters, X axis, Y axis represents the coordinate point of terminal, the different color indicates the different positioning error, and the relation between color and error range is indicated in the upper right corner of the figure.
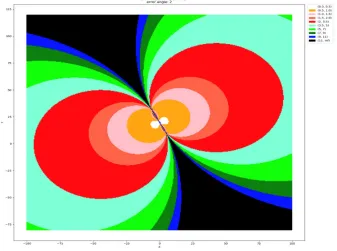
[image:3.612.137.474.419.670.2]From the figure, it can be found that the positioning effect within the triangle is the best. The farther the terminal position is from the triangle centroid, the greater the corresponding positioning error. In addition, when the two acute angles of the obtuse triangle are very small, the positioning effect will be very poor, as shown in Figure 2. Therefore, in real positioning scene, three transmitters on the same straight line should not be selected.
Figure 2. Positioning error map when lines of connecting three transmitters coming into a straight line.
horizontal and vertical coordinates of the terminal are set to 0.5. As shown in Figure 3 (text below the figure shows the minimum positioning error and maximum positioning error value in this area):
Minimum Positioning Error:0.0 Minimum Positioning Error:0.0 Minimum Positioning Error:4.2002e-16 Maximum Positioning Error:5.7734 Maximum Positioning Error:4.9601 Maximum Positioning Error:5.6430
(1) (2) (3)
Figure 3. Positioning error map with min/max value when lines of connecting four transmitters coming into quadrilateral.
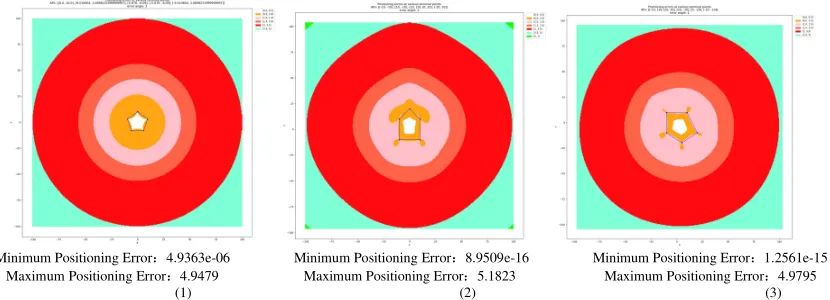
In the case of five transmitters, the effect of the algorithm is evaluated when lines connecting the five transmitters coming into a regular pentagon and an irregular pentagon. The area where terminal located is a square area with a side length of 200, and center is the centroid of the pentagon. The step lengths of the horizontal and vertical coordinates of the terminal are set to 0.5. As shown in Figure 4 (text below the subfigure shows the minimum positioning error and maximum positioning error value in this area):
Minimum Positioning Error:4.9363e-06 Minimum Positioning Error:8.9509e-16 Minimum Positioning Error:1.2561e-15 Maximum Positioning Error:4.9479 Maximum Positioning Error:5.1823 Maximum Positioning Error:4.9795
(1) (2) (3)
Figure 4. Positioning error map with min/max value when lines of connecting five transmitters coming into pentagon.
When the Number of Transmitters is the Same and the Position of the Transmitters is Unchanged (7 Transmitting Stations are Sampled Here, and the Connecting Area of the Transmitters is a Positive 7-sided Shape), the Influence of the Variation of the Angle Error on the Positioning Error
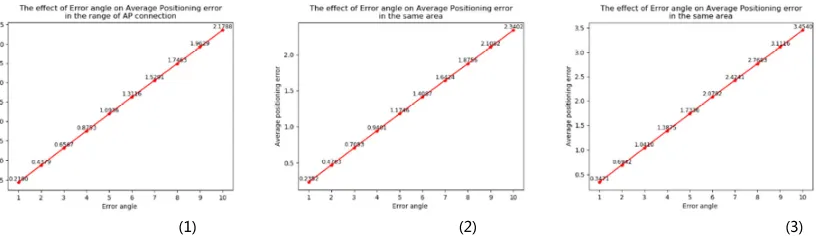
It is known that at a certain point, the positioning error increases with an increase in angle error, and has a positive correlation with angle error. As illustrated in Figure 5, the increase of angle error will have the influence on the average positioning errors inside the shapes formed by transmitters and the total positioning area. In calculating the position of different points where terminal located, the step lengths of horizontal and vertical coordinates are set to be 0.1 respectively.
[image:5.612.102.510.191.309.2](1) (2) (3)
Figure 5. relationship between the angle error with average positioning error.
In Figure 5(1), the average positioning error inside the shapes linked by transmitters is calculated. In Figure 5(2), the average positioning error of circumcircle of the points linking transmitters is calculated. Their radius of the circumcircle is 10 with (0,0) as its center.
In Figure 5(3), the average positioning error of a squared area with a side length of 40 and a centroid (0,0) is calculated.
Similarly, it can be found that with the increase of the angle error, the positioning error increases correspondingly, and still has a linear positive correlation with the increase of the angle error. It means that the error between the measurement angle and the true angle should be as small as possible.
In the Case of the Same Angle Error (2°), the Effect of the Increase in the Number of Transmitting Stations on the Positioning Error
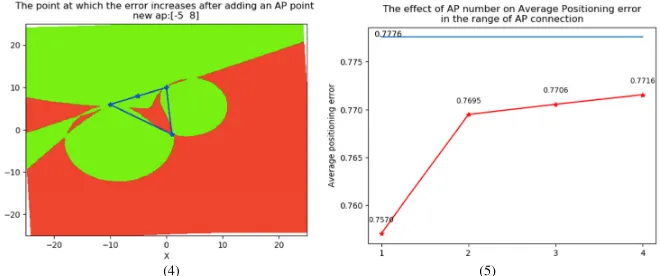
Firstly, based on the original transmitters, a new transmitter is added in the four different circumstance e.g. inside or outside the linking area of the transmitters, or near a certain transmitter, or along the line connecting two transmitters, Figure 6 shows the positioning errors of different point where terminal located under the four circumstances.
(4) (5)
Figure 6. The effect of adding one transmitter on the positioning error.
The four points on the abscissa of Figure 6(5) correspond to the four circumstances in Figure 6 (1)~(4) respectively, the blue line in Figure 6(5) refers to the average positioning error before the new transmitter is added.
Green parts of Figure 6 indicate that the positioning errors in this area are smaller than those in the area without an added transmitter. Red parts of Figure 6(1)~(4) indicate that the positioning errors in this area are larger than those in the area without an added transmitter.
It can be found that adding a transmitter can only decrease the average positioning error in the same area, but cannot tell which points terminals located will have smaller or larger positioning error. If a new transmitter is added in the centroid inside the links between the near transmitters, the corresponding average positioning error is the smallest one compared to a new transmitter added in other areas.
Summary
This Paper proposes an AOA positioning method based on least-squares method. It uses simulation analysis to evaluate the performance of the method. The analysis shows that the AOA-based positioning method performs better in the situation where three launch pads form an acute triangle. The equilateral triangle is the best, and the AOA angle measurement error is proportional to the positioning error. The increase in the number of launchers has a relatively complex effect on the positioning accuracy, and the actual use needs to be evaluated according to the situation.
Acknowledgement
This research was financially supported by the Natural Science Foundation of Zhejiang Province, China (LQ15F010008), Science and Technology Program of Jiaxing City, China (2015AY11009).
References
[1]Daniele Inserra, Andrea M. Tonello, Nicola Moret, Positioning Based on 2-D Angle of Arrival Estimation, in Proc. of IEEE 73rd Vehicular Technology Conference (VTC Spring), 2011.
[2]Thomas Lindner, Lucila Patino-Studencka, Joern Thielecke, Positioning with Angle-of-Arrival Estimation on Partially Coherent Arrays, in Proc. of European Conference on Smart Objects, Systems and Technologies, 2016.
[3]Alessio Fascista, Giovanni Ciccarese, Angelo Coluccia, Giuseppe Ricci, Angle of Arrival-Based Cooperative Positioning for Smart Vehicles, IEEE Transactions on Intelligent Transportation Systems 99(2017) 1–13.
[5]R. Roy and T. Kailath, Esprit-estimation of signal parameters via rotational invariance techniques, IEEE Transactions on Acoustics, Speech and Signal Processing, 37(1989) 984–995.