Global Roadmap for
Implementing CO
2
Utilization
November, 2016
Report distributed by the Global CO
2
Acknowledgements
We are deeply grateful to the Ministry of Economy, Trade and Industry (METI) and New Energy and Industrial Technology Development Organization (NEDO), Japan, for launching and supporting the ICEF Roadmap Project of which this is a part. NEDO commissioned CO2
Sciences to conduct this roadmap on CO2 Utilization.
TABLE OF CONTENTS
Executive Summary ... 3
I. Background and goals of the study ... 8
II. Overview of findings ... 12
III. Momentum within recommended markets ... 17
• Building materials • Chemical intermediates • Fuels • Polymers IV. CO2U market sub-category projections through 2030 ... 25
• Concrete • Carbonate aggregates • Methanol • Formic acid • Syngas • Liquid fuels • Methane • Polymers (polyols and polycarbonates) V. Life cycle assessment ... 45
VI. Recommendations for strategic actions ... 48
VII. Conclusions ... 57
Executive Summary
Background: Confronting an urgent challenge
This study presents a roadmap for commercialization potential of carbon dioxide utilization (CO2U) technologies through 2030.
A significant reduction of carbon emissions is crucial to avoiding enormous economic and environmental damages. Renewable power generation and other low- and zero-carbon technologies are an important part of the solution. Carbon negative technologies (those that reduce atmospheric CO2 concentrations) are also needed to achieve the agreed global goal of
keeping temperature increases well below a 2oC increase over pre-industrial levels. CO2U
technologies can play an important role, but have not yet received much attention nor have their potential been explored in a comprehensive fashion.
A detailed market assessment study that was completed earlier in 2016 by GCI found that CO2U
has the potential to reduce carbon emissions over 10% by 2030 (GCI’s website provides more details). One goal of this work is to create greater awareness concerning the potential for developing and deploying profitable, emissions-negative CO2U technologies on a mass scale. The study: Identifying and forecasting market opportunity
This study analyzes the current state of CO2U technology, assessing almost 180 global
technology developers on the basis of their technology feasibility, readiness, markets and momentum.
Research revealed that significant progress in CO2U has been made in the past five years
(2011-16), with many technologies shown to be scalable. Momentum is favorable for four major markets – building materials, chemical intermediates, fuels and polymers.
Within those markets, the study further identifies eight product categories to pursue, based on the maturity of their technology, market promise, and potential impact on the mitigation of carbon emissions. Those categories are:
• Building materials
o Concrete
o Carbonate aggregates
• Chemical Intermediates
o Methanol o Formic acid o Syngas
• Fuels
o Liquid fuels o Methane and
Funding and incentives are necessary for most of these products to accelerate development and achieve full-scale commercial roll out capability. This study presents a commercialization roadmap for each of the eight categories.
The roadmap was developed with three dimensions in mind: policy, technology and market. Those three dimensions greatly impact the path and speed to commercialization. The results are presented by considering the business as usual case (status quo), which is also the worst case scenario. The best case represents likely outcomes if swift strategic actions are taken to remove barriers and mitigate risks.
Strategic actions to accelerate CO2U commercialization
Best-case scenarios in the forecast would support and hasten commercialization of CO2
U-derived products across the eight identified product categories. These optimal scenarios will be driven by the implementation of strategic actions recommended in this study. They are:
Technology
• Research to improve catalysis for CO2 reduction must be funded. The needed
substantial increase in funding should come from government, corporations and private institutions.
• Research in improving electrolysis to produce hydrogen must be funded.
• Government funding is critical for exploring early stage technologies and creating future options for CO2U technologies.
Market
• Collaborations among research institutes, start-ups, governments and corporations for process integration of CO2 conversion, hydrogen generation, and carbon capture must
be funded.
• A CO2 pipeline infrastructure is critical for the deployment of CO2U technologies at scale.
This opportunity creates new business options/models and creates a new value chain critically needed to scale CO2U technologies.
Policy
• Substantial increase in government funding for R&D
• Carbon pricing, either through emissions trading or tax mechanisms.
• Tax and other incentives
• Mandates
• Government procurement
• Government support for certification and life cycle assessments.
Life cycle analysis (LCA)
The climate benefit of a CO2U product depends not only on how much CO2 the product
contains. The amount of CO2 emitted in making the product also matters. So does the amount of
CO2 emitted in making any competitive products that may be displaced. To the extent that
climate benefits are a goal of those promoting CO2U products, LCA is essential. Considerable
work is needed to standardize LCA methodologies for CO2U. The Global CO2 Initiative is
CO2U’s potential: Profitable markets and mitigated CO2 emissions
At full scale, 5 CO2U products (see below) could create a market over US $800 billion by 2030.
CO2U has the potential of utilizing 7 billion metric tons of CO2 per year by 2030 – the equivalent
of approximately 15 percent of current annual global CO2 emissions. CO2U can create new
business opportunity and simultaneously contribute to CO2 reduction. Both conclusions are
consistent with an earlier market study that the GCI commissioned concluding that CO2U can
remove over 10% of the emitted CO2 and represents an annual market opportunity of $0.8-1.1
Trillion.
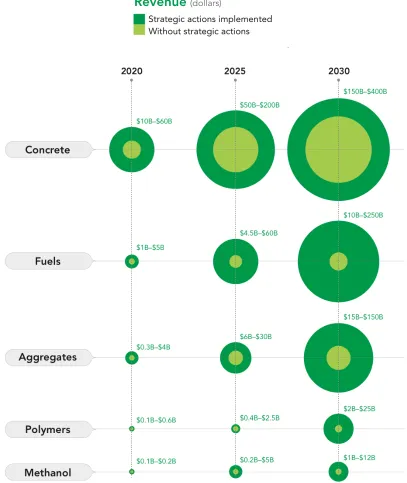
Roadmap to 2030: Market size and mitigation impact
Market size and CO2 reduction potential can be significantly impacted by taking action now.
Below are examples from five markets. For example, the market for CO2-based fuels can be
quadrupled by 2025 (from $50b to $200b), increasing the CO2 reduction by 15 fold (from 0.03b
Figure 0.2: Potential increase in market size due to implementation of strategic actions
I.
Background and goals of the study
The Grand Challenge of the Planet: Reducing carbon emissions
Over 35 GT of CO2 are emitted into the atmosphere every year, altering the Earth’s climate
system and threatening catastrophic damages in the years ahead. The implications of climate change are massive:
• Economic and political instability
• Food and clean water scarcity
• Health or survival risks for all animal species
• More volatile and extreme weather
• Loss of landmass
The United Nations’ December 2015 Paris COP21 conference – in which 195 sovereign nations, in both the developed and developing world, agreed on a framework that committed each to taking action against climate change – was judged historic on several levels.
After Paris: A new impetus for zero-carbon research
Among other covenants, the signers of the Paris accord agreed to:
• Limit global temperatures to “well below” 2o C (3.6 F) above pre-industrial levels and “endeavor to limit” them even more, to 1.5o C, between 2015 and 2030.
• Restrict the amount of greenhouse gases emitted by human activity to the levels that trees, soil and oceans can naturally absorb, beginning at some point between 2050 and 2100.
• Review each country's contribution to cutting emissions every five years, enabling them to address the urgency of the challenge.
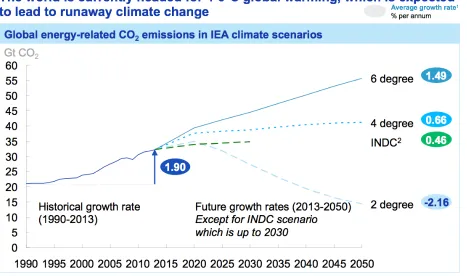
Similar conclusions have been voiced by the IEA and IPCC experts about the critical need for carbon-negative technologies. Figure 1.1 shows that continuing to deploy energy efficiency and renewable power generation will limit the increase in temperature rise but we may end up with a 4oC increase. We need to have CO2 absorbing solutions. Of course, plants are nature’s great
weapon, however, they are slow and we need solutions that can absorb CO2 at a much faster
Figure 1.1: The need for carbon-negative technologies to limit temperature increase
[image:10.612.75.542.480.651.2]
Carbon dioxide utilization (CO2U)
CO2U differs from prevalent carbon capture and storage (CCS) solutions in one basic way.
CCS captures CO2 emissions exclusively for storage, usually reinjecting them into geological
formations; the goal of CO2U is to convert CO2 into end products that in turn are
emissions-neutral or negative.
The development of CO2U technologies is being promoted for three key reasons:
• It can be used for mitigation to meet internal or external standards for CO2 emissions for
carbon dioxide producers.
• It would allow for carbon dioxide to be used as an alternative to fossil-fuel-derived feedstocks.
• It can contribute to achieving national or global aims for decreasing carbon emissions. As this report and other studies show, CO2U has been the focus of a myriad of research tracks
investigating multiple conversion processes and potential markets and end products in recent years. However, the Paris agreement and recent private and public initiatives have added new urgency and momentum to fundamental R&D efforts that will lead to more rapid commercialization of products that use CO2 conversion to reduce carbon emissions.
These initiatives include the Carbon XPRIZE, a US $20 million global competition designed to “incentivize and accelerate” CO2U solutions development, and the SCOT (Smart CO2
Technology) project, a public-private-academic collaboration community based in the European Union and the Global CO2 Initiative.
This study: Presenting a global CO2U commercialization roadmap through 2030
This is a roadmap of the global commercialization potential of carbon dioxide utilization technologies through 2030. CO2U technologies use CO2 (pure or as emitted) either unchanged
(e.g., enhanced oil recovery/EOR, carbonated drinks, supercritical CO2 solvents) or by
converting it into a value-added end product like a fuel or a chemical.
This study focuses on products derived by conversion of CO2. Identifying the most mature, economically promising and impact-mitigating applications for CO2 conversion is critical to
driving further investment and innovation in catalytic fashion. That investment will accelerate time-to-market for solutions that capture and reduce global CO2 emissions, and offer sustainable
climatological benefits.
Conversion challenges have historically created a bottleneck in the rapid development, production scaling, and commercialization of CO2U-based products. Fundamental challenges
have included:
• CO2 has been more difficult and expensive to obtain than the petroleum, coal and natural
gas sources of raw material for most chemical manufacturing. This concern has been amplified in 2015-16 by the fall in global petroleum prices.
• Converting a stable CO2 molecule to a useful chemical has generally required lots of
• It has been costly to provide the hydrogen feedstock necessary to create the desired end products.
• It’s therefore been difficult to assess the true potential (and by when) of CO2 mitigation,
and tie that to policy and funding decisions.
However, greatly increased attention to CO2 conversion by both developers and policy-makers
has produced new research, initiatives and collaborations that have the potential to address these challenges. These advances include, but aren’t limited to:
• The development of catalysts that enable new technology pathways and make conversion processes more efficient.
• Consideration of renewable energy sources (solar or wind energy) to power CO2
conversion. The reduction in the cost of renewable power generation technologies is a major parameter that is making CO2U more feasible than it was 5 years ago.
• Advances in mineralization technologies to produce building materials.
• Advances in photocatalytic reduction of CO2, which uses light directly in conversion.
This study identifies:
• Product categories and sub-categories with the most realistic deployment prospects based on policy considerations, analysis of technology and forecasts of market potential.
• Current barriers to development and potential means of overcoming them. Criteria include an assessment of conversion technology pathways and their relative impact on CO2 reduction, potential market demand and geographical/geopolitical impacts on
development and commercialization.
• Centers of activity in CO2U research and development.
• Projected timelines for deployment.
This ten-to-fifteen-year roadmap will enable decision makers and key stakeholders to make appropriate and informed funding/investment decisions regarding technology development and commercialization of CO2U technologies. Its ultimate focus is on clearly prioritized market entry.
II.
Overview of findings
Six major markets identified
We have identified and analyzed 180 global developers who are actively engaged in CO2U and,
ultimately, the development of end products.
A database of CO2U developers was compiled from multiple sources: conference proceedings,
the SCOT Project and PitchBook databases, patent searches, consortium websites, and in-house knowledge. These entities include start-ups, mid-sized companies, corporations, consortia and research institutes.
The study defined six markets or product clusters by number of active developers, conversion technology pathways, and targeted end products:
• Algae (processed separately to create biofuels or food additives)
• Building materials (for conversion to carbonates or infusion of CO2 into materials)
• Chemical intermediates (such as methanol, syngas, formic acid and malic acid)
• Fuels (mainly for methane and alcohol)
• Novel materials (such as carbon fiber)
• Polymers (e.g., polycarbonates, polyurethane and PHA)
Concentration of active developers
We found that the number of developers was especially concentrated in three of these segments:
• Chemical intermediates
• Fuels
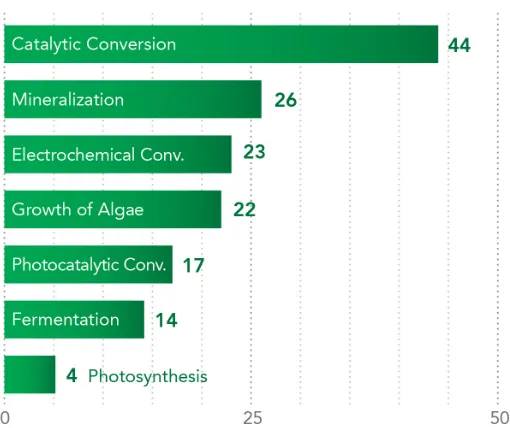
The study also identified and analyzed a wide range of technology pathways. Catalytic conversion, mineralization and electrochemical conversion are the most widely studied pathways based on number of developers (see Figure 2.2). Time-to-commercialization depends heavily on this concentration of research efforts.
Catalyst development is critical in the drive to make conversion processes more efficient; research in this field builds upon decades of work in catalysis in general. Other processes – photocatalytic, photosynthesis and algae production – focus directly on using sunlight as a low-cost energy source for conversion.
The study concurrently identified and analyzed the strengths and weaknesses of six technology pathways that are being used, or are being considered for use, in the conversion of CO2 to
commercial products: catalytic, electrochemical, fermentation, mineralization, photocatalytic and photosynthetic.
[image:14.612.175.430.355.569.2]Mineralization, catalytic conversion, and electrochemical processes have the highest number of developers and researchers, which will help propel these technologies forward.
Figure 2.2: Number of developers by CO2U technology pathway.
(Some developers serve more than one market.)
Catalytic conversion and mineralization are the most well developed pathways. Mineralization of CO2 is the only conversion technology pathway currently being used for building materials.
Catalytic conversion is widely used for production of chemical intermediates, fuels, and polymers.
Fermentation is less established as a process for CO2 conversion. Two companies at scale,
main carbon sources for their processes, respectively. At this time, photocatalytic and electrochemical conversion technologies require more development and evidence of scalability. Consortia and collaborations have been founded, notably in Europe, to fully utilize the impact of CO2U technology on CO2 mitigation. In addition, the study found a significant increase in the
number of new publications on conversion of CO2 via catalytic reduction. More than 600 papers
on this topic were published by academic and government entities on this topic in 2015, compared to about 350 two years earlier.
Maturity and momentum of each market
Armed with direct interviews with over a dozen developers as well as secondary research, the study applied a technology readiness level (TRL) scale of 1 (least) to 9 (most) to determine the relative stage of development and create a framework for expected time-to-market.
The TRL applied in this study ranges from basic and applied research, proof of concept and laboratory testing (stages 1-5), to prototyping, piloting and final development (stages 6-8), to full-scale deployment/market introduction (9).
We also applied standardized rubrics to better quantify the mitigation potential and technology fit of each market.
Four markets recommended for funding and investment
Figure 2.3. The study has identified four markets that offer the best opportunities for support and investment. The assessment is based on an analysis of active developers, first-person interviews, in-house expertise and
scientific momentum.
Another important consideration that was factored in our analysis is “permanence”. Permanence refers to the period during which CO2 is stored in a product. Products such as cement can fix
years or decades, returning CO2 to the atmosphere and minimizing the benefits of using the
CO2 in those products.
A related concept is displacement. If CO2 is used as a feedstock for liquid fuels, that can
displace the extraction of petroleum that would otherwise be used to produce those liquid fuels. (This will depend on market conditions, but in many circumstances today that is the most likely result of using CO2 as a liquid fuel feedstock.) To the extent CO2 in product creation displaces
the extraction of petroleum, there is a very high CO2 benefit because that petroleum remains
underground and is not combusted.
This study recommends further investment in four clusters or markets – building materials, chemical intermediates, fuels and polymers – based on the following summary of findings:
• Building materials
o It’s thermodynamically favorable to make carbonates and requires less energy input to achieve. This makes this market attractive for developers because the technology is more readily scalable today.
o The two main CO2U technologies used in building materials are mineralization for
carbonate aggregates and the use of CO2 to cure concrete. Key innovators
include Carbon8, Solidia Technologies and CarbonCure. Aggregates are coarse particles used in construction and can be gravel or crushed stones or other similar materials.
• Chemical intermediates
o There are many research projects underway to make conversions more efficient; for example, by developing more effective catalysts which could offer breakthroughs in conversion efficiencies.
o Niche markets have been commercialized; one example is the production in Iceland of methanol using geothermal energy. Methanol, syngas and formic acid are the most widely developed. (Please note that some developers categorize these chemicals under fuels.)
• Fuels
o Production of fuels from CO2 fits within the macro trend toward low carbon fuels.
CO2 competes with petroleum-derived feedstock, as well as bio-based
feedstocks such as sugar cane.
o Fuels represent one of the largest potential markets for CO2U technology given
the many global mandates for greener alternatives.
• Polymers
Two markets eliminated from further consideration
The study also eliminated two markets, algae and novel materials, from further consideration.
• Algae is not yet cost-effective due to high downstream processing costs. Although algae biofuel projects received over US $1 billion in funding in 2009-2010, largely for development and pilot-scale testing, investment began to dry up in 2011. The category has been hampered by intrinsic limitations in algae production and a weak (to date) business case for production at scale. Some projects remain active and some new entrants have been identified. However, a majority of players from 2011 have exited the market through bankruptcies (such as Abengoa, Independence Bio Products and A2BE Carbon Capture) or strategic pivots, while others are idle.
• Novel materials have to this point received very limited developer focus. While we strongly believe that such products can have significant impact on CO2 reduction, there
is a great uncertainty in time to market and scale. The case for CO2 to carbon fiber is a
prime example. The study identified one research effort (George Washington University) for CO2 conversion to carbon fiber, and it is at a very early-stage of development. If the
new process can make fibers at lower cost, then emissions reductions can occur in three ways:
o Use of a low-carbon-footprint carbon fiber product (assumes no change in market penetration).
o Greater use of carbon fibers in additional markets (assumes increase in market penetration rates).
o Replacement of steel by carbon fiber. This will have a significant impact on overall emissions since steel contributes 6.7% to global emissions; there would be associated benefits from reducing fuel use in transportation and freight sectors due to light-weighting.
III. Momentum within recommended markets
Eight sub-categories identified
We further segmented each recommended market to identify sub-sectors: end-product categories with the earliest and highest likelihood of commercialization and success. Differentiation was based on three major considerations:
• Concentration of developers: The study considered both the number of developers in a segment and how far along they were on the path to commercialization those developers were. Success of commercialization was linked to:
• Relatively low energy requirements for conversion technology pathway.
• Simplicity of reaction mechanisms or processes.
• Size of potential markets.
• Market Dynamics: The study also assessed the progress of individual developers towards commercialization in the 2011 to 2016 timeframe.
• It considered how many development efforts were at an early stage in 2011 and then progressed, stalled or were disbanded.
• It also considered the growth or decrease in the number of developers over this time frame.
• Outlook: It forecast how long it would take to bring technologies in each segment to scaled production, while being cost competitive with incumbent solutions.
Based on these criteria, the study identified eight promising product categories within the four markets:
• Building materials
1) Concrete
2) Carbonate aggregates
• Chemical intermediates
3) Methanol 4) Formic acid 5) Syngas
• Fuels
6) Liquid fuels 7) Methane
• Polymers
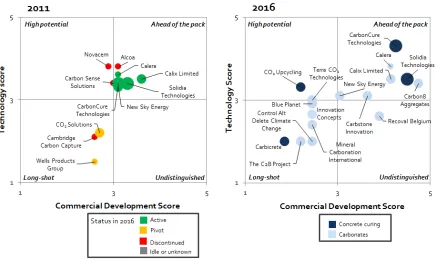
Visualizing CO2U innovation momentum, 2011-16
To gain a greater understanding of the dynamic progress among CO2U development
organizations during the past five years, we plotted their progress in technology and commercial innovation and CO2 mitigation potential using a standard weighting system.
• The technology score (vertical or Y-axis) is weighted based on (in descending order) technology value, competitive landscape, IP strength and regulatory factors.
• The commercial development score (horizontal or X-axis) is weighted based on (in descending order) TRL (technology readiness level), developer base and commercial maturity.
• The mitigation potential (bubbles) is weighted based on (in descending order) market size, ease of set-up and extent to which CO2 is used as feedstock.
We then compared the status of developer organizations in 2011 vis-à-vis 2016. Those followed from 2011 were color-coded based on their 2016 status.
• Green = Active
• Yellow = Strategic pivot
• Red = Discontinued
Building materials: Significant progress, immediate opportunity
The study found that the use of CO2U in concrete curing represents an immediate opportunity.
Moreover, with additional allocated resources, building materials can have a significant mitigation impact on CO2 emissions. The study found:
• Concentration of developers: A relative high density of developers, with many near commercialization and a relatively low number in early stage. Two significant factors drive the success of commercialization:
• Relatively little energy is required for carbonation.
• Concrete made by curing with CO2 has better performance characteristics than
traditional curing methods.
• Market Dynamics: Developers were able to move from pilot to commercialization in both the concrete and carbonate aggregates segments. Overall:
• Several early-stage entities disappeared because they were not able to develop a product beyond pilot stage.
[image:20.612.83.520.362.623.2]• Several new developers focusing on carbonation to produce aggregates have entered the market in the last five years
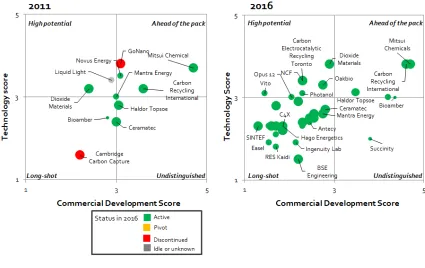
Chemical intermediates: Long-term opportunities; those with fuel applications are closest to commercialization
In general, the study found limited progress in the chemical intermediates market over the past five years due to lack of incentives and concerns about economic feasibility. Those products that can also be used as fuels or in fuel production – methanol, formic acid and syngas – offer the best opportunity. The study found:
• Concentration of developers: A low number are near commercialization, with many in early stages. The most widely developed products are CO (syngas), methanol and formic acid, for three major reasons:
• Their reduction reactions are less complicated than those for other potential end products within the chemical intermediates market.
• They can be used as chemical intermediates and as fuels or precursors to fuels.
• Governments have incentivized fuel production from CO2 to lower carbon emissions,
but this policy has not been the case for the production of chemicals.
• Market Dynamics: Very few developers moved from pilot to commercialization stage for all market segments. The number of start-ups investigating solutions for energy-efficient conversion of CO2 has increased dramatically, with most start-ups tending to focus on
[image:21.612.90.515.376.644.2]catalysis and conversions by reduction.
Drilling deeper, a further analysis of the methanol, formic acid and syngas product categories reveals:
• Concentration of developers: There are currently very few methanol developers, but two companies (Mitsui Chemical and Carbon Recycling International) have been identified with commercialized technology; in syngas and formic acid, the study identified multiple early-stage efforts focusing on conversion by catalysis.
• Market Dynamics: Across all market segments, very few developers moved from pilot to commercialization stage.
• Several startups have been formed for the three markets, indicating potential growth. Many are developing technologies for chemical production.
• The focus of most developers of syngas from CO2 is on using excess energy (e.g.,
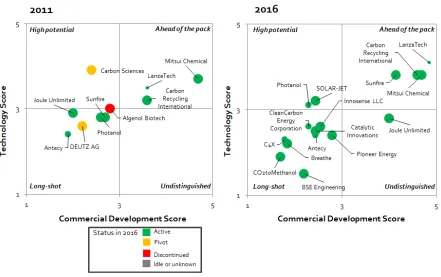
Fuels: Two sub-categories are at – or near – commercialization
Liquid fuels: Ready to produce at scale
Significant progress within the liquid fuels sub-category during the last five years shows that the technology is primed for production at scale. The study found:
• Concentration of developers: Four developers are near commercialization or have already commercialized CO2U; LanzaTech is able to produce in scale.
• LanzaTech converts carbon monoxide into ethanol, hence the low impact shown on the CO2 mitigation score.
• Methanol from CO2 is closest to production in scale.
• Market Dynamics: Development has progressed relatively quickly for liquid fuels due to available government funding for projects and mandates for renewable fuels.
• Stage of development went from pilot testing in the lab in 2011 to pilot testing at commercial scale in 2016.
• The focus of developments has been on integrating CO2 capture, renewable energy
supply, hydrogen generation and CO2 conversion in the case of methanol and on
efficient (multi-step) conversion of CO2 into fuels in the case of other liquid fuels.
[image:23.612.76.517.369.646.2]• Europe is leading because it has set targets to create a low-carbon-emission mobility economy.
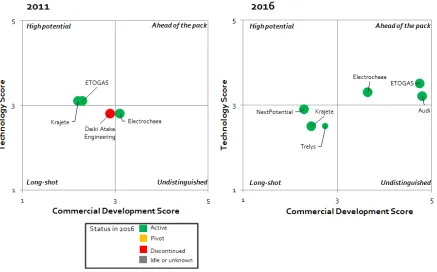
Methane: Significant technological progress
Progress has been especially pronounced in Europe because of funding support. However, the low price of natural gas poses a significant competitive challenge. Additionally needing to add 4 Hydrogen molecules while eliminating 2 Oxygen molecules makes such development extremely energy intensive.
• Concentration of developers: Three CO2U methane developers were found to be near
commercialization.
• Although the processes have been shown to be at scale, it remains to be seen if they will be cost-effective without subsidized funds.
• Market Dynamics: Development has been relatively fast for the methane sub-category compared to the others due to funding and collaborations in Europe.
• Stage of development went from pilot testing in the lab in 2011 to pilot testing at commercial scale in 2016.
• Focus of collaborations is on integrating CO2 capture, renewable energy supply,
hydrogen generation and CO2conversion into gaseous or liquid fuels.
• Europe is leading because it has set targets to create a low carbon-emission mobility economy.
[image:24.612.82.517.373.648.2]• Projects often focus on the use of overcapacity of electricity or excess heat from industrial plants.
Polymers: A dearth of incentives, and startups
The creation of polymers through CO2U is possible, but not yet economical. A limited number of
developers are investing in it, but lack of incentives is inhibiting the entry of startups. The study found:
• Concentration of developers: Several are near commercialization, but there are very few early-stage developers.
• Several companies have shown that polymers from CO2 can be produced at scale.
• Most companies have focused on polycarbonates and polyols (used to produce polyurethane). These companies were able to build on years of expertise in catalysis to commercialize their CO2U technology. This allows developers to replace
technology that uses dangerous phosgene gas.
• Some developers are corporations (e.g., Covestro and Asahi Kasei) that have used their know-how in catalysis to develop commercial pilot plants for producing polymers from CO2.
• Production capacity remains a fraction (less than one percent) of the current capacity available to develop polymers from conventional feedstocks.
[image:25.612.81.518.390.662.2]• Market Dynamics: Developers have successfully moved from lab and pilot to commercialization stage. However, the lack of new initiatives indicates that follow-up projects from those developers and competing companies will be rare – most likely due to the current relatively high cost of polymers made from CO2.
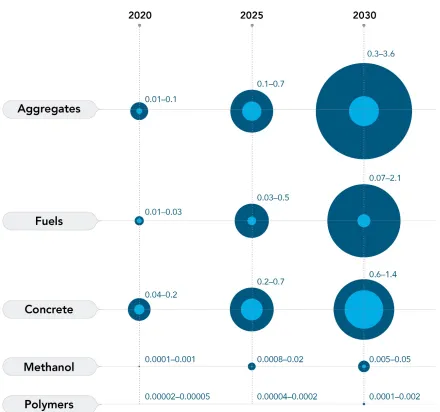
IV. CO2U market sub-category projections through 2030
Market sizing
The study estimated the 2015 market size and estimated compounded annual growth rates (CAGR) of each of the eight categories within the four markets. The findings were based on existing proprietary research and secondary information from annual reports, published market studies and industry publications. The below diagram shows the methodology used in assessing addressable markets.
The study then projected each cluster’s market penetration rate based on three scenarios:
• Best case: Strategic actions are taken that remove barriers at earliest possible opportunity.
• Optimistic: Strategic actions are taken to mitigate barriers.
• Pessimistic: Status quo is maintained.
Each category and scenario has different timelines for mitigating technology, policy and business barriers and driving market penetration. The study then estimated addressable market size by five-year milestones (2020, 2025 and 2030).
In order to go from market projections to corresponding levels of CO2 consumed by different
Building materials: concrete and carbonate aggregates
Concrete
Concrete curing using CO2 offers immediate investment opportunities, with a potential for high
ROI, while also delivering on CO2 abatement. We expect the market to grow under existing
conditions, but additional incentives could accelerate that growth by as much as five years.
• Estimated total market size in 2015: 20-30 billion metric tons. The study estimates that the total concrete market is expected to grow to approximately 40 billion metric tons by 2030, with a CAGR between 3 and 4 percent.
• Technology pathway: Curing of concrete by CO2 injection is an add-on to current
processes (heat and steam), driven by performance and cost.
• CO2U forecast and considerations: By 2030, the CO2U concrete curing market is
forecast to grow to between 6.5 billion (pessimistic), 10.5 billion (optimistic) and 16.5 billion (best case) metric tons.
• Concrete curing using CO2 is partially driven by the need to increase performance
and reduce cost.
• No changes in codes and standards are necessary.
• Concrete production is a source of high CO2 emissions. Incentives to reduce carbon
emissions are few.
• Funding was available for developers in the past, especially in the US and Canada. Several companies are in the commercialization stage.
• Concrete offers a solution for permanent CO2 storage.
[image:28.612.160.455.414.645.2]• CO2 curing would reduce water usage.
Concrete: Barriers and risks
Key barrier/risk Means to mitigate Likelihood of successful mitigation by 2030
Availability of CO2 for
curing
Capture of CO2 during
production of cement; development of a supply infrastructure.
High. If demand is proven, a comprehensive supply chain will follow. Lack of incentive for
concrete manufacturers to adopt process
Concrete manufacturers could be incentivized to reduce carbon emissions by governments.
High. Concerns about global warming will drive governments to seek solutions with an immediate impact.
Lack of developers Increase funding for “green” concrete.
Carbonate aggregates
Carbonate aggregates from CO2U have high potential to abate CO2 emissions, but they need to
become cost-competitive. The category offers an attractive long-term opportunity, if investments are made in CO2 infrastructure and the scaling up of technology.
Carbonate aggregates produced from CO2U can be used in concrete, asphalt, and construction
fill.
Conversion of CO2 into carbonates offers the potential to convert low-value materials (such as
solid wastes containing calcium oxide) into useful products. However, materials from municipal waste sites or steel plants must be transported from their point of generation to the carbonate production site, increasing the price of CO2-derived products.
• Estimated total market size 2015: 25-35 billion metric tons. The total aggregate market is expected to grow to approximately 50 billion metric tons by 2030 with a CAGR between 3 and 4 percent.
• Technology pathways: Direct carbonation; indirect carbonation.
• CO2U forecast and considerations: By 2030, the CO2U carbonate aggregates market
is forecast to grow to between 1 billion (pessimistic), 3.5 billion (optimistic) and 10.5 billion (best case) metric tons. Drivers:
• Concrete production is a source of high CO2 emissions. Currently, concrete
production via CO2U is not incentivized. If enacted, incentives would accelerate
growth.
• As noted above, concrete production is a source of high CO2 emissions. Incentives
to reduce carbon emissions are low.
• Funding was available for developers in the past, especially in the US and Canada. Several companies are in the commercialization stage.
Figure 4.2: Estimated growth of CO2U carbonate aggregates market through 2030.
Carbonate aggregates: Barriers and risks
Key barrier/risk Means to mitigate Likelihood of success mitigation by 2030
Demonstration at large scale at low-cost
Process integration of conversion to carbonates and local supply of solid waste and CO2
High, infrastructures can be set up to be cost competitive with traditional aggregates. Lack of incentives for
aggregate producers; Payback periods could be too long
Subsidize early developers of CO2 conversion to
carbonates or tax carbon emissions at cement factories
High, programs and regulations connected to COP21 will take time to be implemented. Europe is most likely the early adopter. Product will have to be
qualified by existing regulations
Expedite standardization and regulations to lower time to less than 5 years
High, regulations and standards will have been resolved by 2030.
Other barriers include access to CO2, lack of funding to move the technology past low capacity
production, and lack of cost competitiveness due to transportation costs involved with waste material to be used as feedstock.
Chemical intermediates: methanol, formic acid and syngas
Methanol
Today, methanol is largely used in chemical production as an intermediate in the production of formaldehyde, methyl tert-butyl ether, acetic acid and dimethyl ether; olefins is an emerging sector.
However, its emerging application – as a fuel blend – is potentially highly significant. The market for conversion of CO2 to methanol is driven by the demand for fuels from renewable sources.
CO2U-derived methanol offers great promise as this demand continues to grow, but investments
are necessary to drive this market to its full potential.
• Estimated total market size in 2015: 60-70 million metric tons. The total methanol market is expected to grow to approximately 190 million metric tons by 2030, with a CAGR between 7 and 9 percent. The estimate assumes that the bio feed stock market share for methanol used as a fuel is 50 percent by 2030, and the overall market share of methanol used a fuel increases from 12 percent in 2015 to 30 percent in 2030.
• Technology pathways: Catalytic hydrogenation; photocatalytic; electrochemical.
• CO2U forecast and considerations:
• By 2030, the CO2U methanol market for fuels is forecast to grow to between 4 million (pessimistic), 23 million (optimistic) and 34 million (best case) metric tons.
• CO2U methanol for use as a chemical intermediate lacks clear incentives for CO2
mitigation; no projects targeting the chemical production market currently exist. By 2030, the CO2U methanol market for chemical intermediates is forecast to grow to between 1.3 million (optimistic) and 9.3 million (best case) metric tons.
• Methanol from CO2 is currently only cost competitive in special scenarios.
• Funding for “renewable” methanol is tied to production of energy from renewable sources.
• Major hurdles for methanol via CO2U are current high production costs and low
production volumes.
• Methanol from CO2 conversion, usually produced by the electrolysis of water,
requires cheap hydrogen and demands inexpensive/renewable sources of electricity (e.g., hydrothermal in Iceland or wind in Germany).
• Policies and regulations for CO2 mitigation driven by the Paris COP21 agreement
Figure 4.3: Estimated growth of CO2U methanol (fuel) and CO2U methanol (chemical intermediate) markets
through 2030.
Methanol from CO2: Barriers and risks
Key barrier/risk Means to mitigate Likelihood of success mitigation by 2030
Access to low-cost H
2 Development of electrolysis
and access to low-cost renewable energy, i.e. process integration of renewable energy or excess energy, carbon capture and conversion to syngas
High, pilot programs are in place
Reduction of compounds besides CO
2, especially H2O
and catalyst efficiency
Catalysts promoting CO
2
production and inhibitors of side reactions; Further catalyst R&D
High, catalyst improvements are expected
Current mandates for fuels from renewable sources can be met by biofuels from bio-based feedstocks
Increase mandates, implement carbon tax or replace bio-based feedstocks
High: Mandates are likely to become more strict by 2030
Other barriers include access to a clean energy supply, relatively low energy density of methanol as compared to gasoline, creation of a CO2 capture and/or methanol infrastructure,
Formic acid
Currently, formic acid is used as a chemical intermediate in adhesives, preservatives, dimethylformamide (DMF), and other products. Because it’s more reactive than methanol, formic acid is more suitable as a chemical intermediate. Research in the reduction of CO2 to
formic acid (CH2OH) is still early-stage. Formic acid also has been proposed as a fuel source for
fuel cells. This application is still in a proof-of-concept phase.
Funding and incentives drive formic acid; potential is small as compared to other market segments. CO2 conversion to produce formic acid has high potential in theory because formic
acid is suitable as a chemical intermediate. However, demand will remain low unless specific applications are more developed.
• Estimated total market size in 2015: 500,000 to 700,000 metric tons. The total formic acid market is expected to grow to approximately 1.0 million metric tons by 2030 with a CAGR between 3 and 4 percent.
• Technology pathways: Catalytic hydrogenation; electrochemical.
• CO2U forecast and considerations: By 2030, the CO2U formic acid market is forecast
to grow to between 10k (pessimistic), 50k (optimistic) and 475k (best case) metric tons annually.
• Applications need to be developed; current demand is relatively low.
• The driver for using CO2 conversion to produce formic acid is weak, because
governments are not incentivizing creation of chemical intermediates from renewable sources.
[image:34.612.161.457.440.670.2]• Use as a fuel for fuel cells would allow for carbon-neutral transportation, if formic acid were made from renewable sources.
Formic acid from CO2: Barriers and risks
Key barrier/risk Means to mitigate Likelihood of success mitigation by 2030
More efficient conversion Research into improving catalyst selectivity and increasing catalyst life. This includes catalysts that would allow for contaminated CO
2.
High, development will take 10-15 years
Lack of funding for programs to focus on formic acid from CO
2
Set up government or private programs, especially in APAC and the US.
Incentivize collaboration between renewable energy suppliers and converters.
High, funding is available in Europe. US and APAC will follow suit if programs are successful
Lack of current demand for formic acid
Formic acid could be developed as an alternative `green’ chemical intermediate or a fuel to fuel cells
Low, demand in these fields is unlikely to be high unless there is a breakthrough in fuel cells
Formic acid from CO2 cannot compete for another 10 years, perhaps 15. CO2U formic acid is
more early stage than methanol and syngas.
Other barriers include access to a clean energy supply, creation of a CO2 capture infrastructure,
Syngas
Syngas (synthesis gas) is a versatile chemical intermediate; it is more reactive. Its uses include making liquid fuels (by Fischer-Tropsch reaction) as well as methanol itself. Syngas is also used in power generation, but this application is not considered a CO2U end product because other
methods are more efficient and lower in cost. Although it’s currently relatively small, the syngas market derived from carbon monoxide and hydrogen is growing at a healthy CAGR (8 percent). Syngas from CO2 has significant potential as it can be used as an intermediate in the production
of many chemicals and materials. Many developers are investigating CO2 conversion to syngas.
However, efforts must be incentivized to be able to compete with more conventional production methods by 2030.
• Estimated total market size in 2015: The development of syngas for power generation makes the total market size difficult to quantify because syngas is normally converted to other chemicals or used for power generation; this study estimates the current market to be 130-150 gigawatts annually. The total syngas total market is forecast to grow to approximately 500 gigawatts annually by 2030 with a CAGR of between 8 and 10 percent.
• Technology pathways: Electrochemical; catalytic hydrocarbon reformation.
• CO2U forecast and considerations: The CO2U syngas market is forecast to grow to
between 15 (pessimistic), 110 (optimistic) and 265 (best case) gigawatts by 2030.
• Syngas from CO2 conversion can be used to produce a range of chemicals and
fuels.
• Because it enables developers to produce fuels or chemical intermediates downstream, CO2U syngas production can be added on to an existing manufacturing
plant. For example, the technology can be added on by steel plants to decrease carbon emissions and generate an additional revenue stream.
[image:36.612.170.446.478.695.2]• There are currently no direct incentives for companies to use renewable sources to produce syngas; renewable alternatives include generation of syngas from biomass.
Syngas from CO2: Barriers and risks
Key barrier/risk Means to mitigate Likelihood of success mitigation by 2030
Access to low-cost hydrogen and access to a clean energy supply
Development of electrolysis and access to low-cost renewable energy, i.e. process integration of renewable energy or excess energy, carbon capture and conversion to syngas
High if excess energy of plants or renewable sources can be utilized
Lack of demonstration facilities
Increase funding for pilot programs and for scaling up production of syngas
High, Funding in Europe has focused on pilot programs Lack of incentives to reduce
carbon emissions
Tax on carbon emissions or mandate reduction of carbon emissions
Low, although Europe could be an early adopter
Other barriers include competition with syngas generated from biomass, creation of a CO2
Fuels: liquid fuels and methane
Liquid fuels
Liquid fuels include gasoline, diesel and kerosene, and additives such as methanol and formic acid. Biofuels from renewable sources such as sugar cane have been growing through funding and incentives, but fuels from CO2 conversion have a negligible market share at present.
Yet liquid fuels from CO2U have the potential to replace polluting alternatives. CO2 conversion to
liquid fuel production demands an integrated approach to developing the technology, incentivizing renewable fuels by policy, and creating an infrastructure for low-cost CO2.
• Estimated total market size in 2015: 800 billion to one trillion US gallons annually. The overall liquid fuels market is expected to exceed one trillion US gallons annually by 2030 with a CAGR of 1-2 percent.
• Technology pathways: Photocatalytic; biocatalysis; catalytic hydrogenation.
• CO2U forecast and considerations: By 2030, the CO2U liquid fuels market is expected
to grow to between 7 billion (pessimistic), 45 billion (optimistic) and 165 billion (best case) US gallons annually.
• Europe leads in funding to lower carbon emissions.
• Europe has a mandate to derive 10 percent of liquid fuels from renewable sources by 2021. Sources of energy for conversion must also be to be renewable.
• European consortia have been established comprising members of the value chain (universities, energy suppliers, CO2 suppliers, converters and users).
• Fuels from CO2 conversion target the same market as fuels from bio-based
[image:38.612.162.456.423.653.2]feedstocks.
Liquid fuels from CO2: Barriers and risks
Key barrier/risk Means to mitigate Likelihood of success mitigation by 2030
Current mandates for fuels from renewable sources can be met by biofuels from bio-based feedstocks
Increase mandates or replace bio-based feedstocks
High: Mandates are likely to become more strict by 2030
Access to renewable energy at a low price
Increase availability from energy from solar, wind and other renewable sources
High: in areas of oversupply of solar and wind energy Efficient conversion of CO
2 Technological advances in
conversion of CO
2 are
necessary to allow for different quality feedstocks to be used and to increase the yield of the conversion
High: Advances in catalysis and photocatalysis should allow for more efficient conversion
Other barriers include lack of access to a low-cost hydrogen and clean energy supply and creation of a CO2 capture infrastructure. Note that some of these are also valid for other markets
Methane
Methane is produced from resources such as shale gas, tight gas and coal beds. According to the Energy Information Administration, shale accounts today for one-half of US natural gas production, with its share expected to approach 70 percent by 2040.
Producing methane from CO2 is possible, but it remains to be seen if it can be profitable. It can
only be cost-competitive if alternatives are made more expensive through carbon taxes or by mandating methane production from renewable sources. Developers are investigating bio-methane from renewable sources to reduce CO2 emissions, and methane from CO2 conversion
will compete with these renewable sources. European consortia have been established comprising members of the value chain (universities, energy suppliers, CO2 suppliers,
converters and users).
• Estimated total market size in 2015: 3-4 trillion cubic meters annually. The overall methane market is expected to grow to 4-5 trillion cubic meters by 2030 with a CAGR between 1 and 2 percent.
• Conversion technologies: Fermentation; catalytic hydrogenation; photocatalytic.
• CO2U forecast and considerations: By 2030, the CO2U methane market is expected to
grow to between 4 billion (pessimistic), 13 billion (optimistic) and 65 billion (best case) cubic meters annually.
• Funding in Europe for the co-electrolysis of CO2 and water is ongoing, with several
countries possessing significant alternative energy sources, such as hydroelectric and wind power.
[image:40.612.161.456.440.669.2]• Shale-gas-fired technology is replacing coal-burning plants in the US, thereby reducing carbon emissions and reducing the drive in the US to reduce CO2 emissions.
Methane from CO2: Barriers and risks
Key barrier/risk Means to mitigate Likelihood of success mitigation by 2030
Requirement of process integration
Development of conversion technology and access to low-cost renewable energy, i.e. process integration of renewable energy or excess energy, carbon capture and conversion
High, pilot programs are in place
No incentive to change; gas is seen as an improvement over oil and coal in countries such as the US
Change in policy to mandate more strict requirements for CO
2 emissions or implement
carbon taxes
Low, the US is meeting its current standards
Low-cost and effective catalysts
Funding into development of more durable and selective catalysts; Development of fermentation technology
High: catalyst improvements are expected
Other barriers include low gas price of fossil derived methane, lack of access to a low-cost hydrogen and clean energy supply and creation of a CO2 capture infrastructure. Note that some
Polymers
Polyols and polycarbonates
While there are a smaller number of developers compared to the building materials, chemical intermediates and fuels categories identified in this study, several large companies with access to technical knowledge and production facilities are focusing on the production of polycarbonates and polyols from CO2. Research into other types of polymers is more
fragmented.
Polyols and polycarbonates from CO2 have been commercialized, but it remains to be seen if
the technology can compete. Reduction of the cost of CO2 and/or greater incentives to reduce
carbon emissions must be implemented to be able for CO2U polymers compete with those from
conventional feedstock.
• Estimated total market size in 2015: 8-10 million metric tons for polyols and polycarbonates. The total market for these two polymers is forecast to grow to 17 million metric tons by 2030, with an estimated CAGR of 3-5 percent. Other polymers, such as polyhydroxyalkanoates (PHA), are far from commercialization.
• Technology pathways: Epoxide copolymerization; fermentation.
• CO2U forecast and considerations: By 2030, the CO2U polymers (polyols and
polycarbonates) market is forecast to grow to between 0.4 million (pessimistic), 1.7 million (optimistic) and 6.8 million (best case) metric tons annually.
• The major contemporary driver for the development of CO2U polymers is to reduce
CO2 emissions from chemicals and materials manufacturing processes and facilities.
• Funding is available in Europe to companies exploring using CO2 as a feedstock.
[image:42.612.158.457.439.669.2]• The thermo-catalytic conversion process is not currently cost competitive.
Polymers from CO2: Barriers and risks
Key barrier/risk Means to mitigate Likelihood of success mitigation by 2030
No incentive for reduction of CO
2 emissions for polymers
and chemicals at plants
Set up mandates and regulations.
Incentivize collaboration between renewable energy suppliers and converters.
Low, although Europe could be an early adopter
Not cost competitive Improve conversion efficiency, reduce cost of feedstock and/or energy, implement carbon tax
Low, a global carbon tax is unlikely
Access to low priced CO
2 Development of capture of
CO
2 and creation of a supply
chain infrastructure
Overall drivers, barriers and constraints
While there are different market forces that influence near term and long term potential of the different market segments, we summarize the overall drivers, barriers and constraints in terms of three dimensions: policy, technology and market.
Policy
• The Paris agreement sets global goals for reducing CO2 emissions and establishes a system to support national governments in doing so. The agreement entered into force in early November 2016.
• The drive toward a carbon-neutral economy and less dependence on oil,
• In general CO2U is not a priority in government R&D strategies.
• In recent years CCS has received more attention than CO2U. That has helped drive
down costs of carbon capture, which are essential for both approaches, but the funding for utilization technologies has been limited. However CO2U is now receiving greater
attention around the world. CO2U is often called “CO2 transformation,” “CO2 usage” or
“CO2 re-use” by European policy makers and developers. Technology
• Lack of coherent funding strategies from governments to support CO2U technologies.
• Another barrier is the lack of access to facilities to scale up CO2U technologies.
• Lack of access to feedstocks – for hydrogen, CO2, and renewable energy – is an
additional barrier.
Recently, we began to see activities clustering in research centers. We believe this will critical mass to accelerate the development of early stage technologies. Appendix 1 shows examples of such activity centers.
Market
• A barrier is the lack of access to facilities to scale up CO2U technologies.
• Cost: CO2U must compete with conventional feedstock and bio-based feedstocks, which are often lower in cost.
• Access to a national CO2 infrastructure.
• Lack of process integration of renewable energy and conversion processes (no robust value chain)
Fig. 4.7 Relative influence of the dimensions on different CO2- based products
V.
Life cycle assessment
The climate benefit of a CO2U product depends not just on how much CO2 the product contains.
The amount of CO2 emitted in making the product also matters. So does the amount of CO2
emitted in making any competitive products displaced. To the extent that climate benefits are a goal of those promoting CO2U products, life cycle analysis is essential.
Understanding the full life cycle emissions impacts of CO2U technologies is especially important
for validating policy support and for guiding research. At first glance, technologies that divert one ton of CO2 into an economically valuable product would seem to reduce emissions by one ton of
CO2, but this is not the case, for several reasons.i As shown in Figure 5.1, a true understanding
of the emissions impacts of CO2U technologies must be based on rigorous life-cycle
assessment (LCA), which takes several other factors into account:
• The CO2 capture process, including any energy penalty that must be offset through
additional power generation;
• Compressing and transporting CO2 to the location of the CO2U process;
• The energy consumed in the CO2U process itself;
• The production of additional feedstocks, catalysts and other materials used in the CO2U
process; and
[image:46.612.77.536.391.579.2]• The emissions resulting from end-of-life treatment for the CO2-based product.
Figure 5.1: Emissions sources for CO2U technologies. Adapted from von der Assen, 2015.
The ISO 14000 series establishes a standard framework and general procedure for performing LCA calculations, and is widely accepted.ii However, even when using this framework, there are many other complications that occur in practice.
The first complication comes from the impact of using different CO2 sources as feedstock for a
exist, such as natural gas processing and fertilizer production.iii These sources have different energy requirements for capture (largely based on their purity) so a LCA must take this into account. It is possible to define an “environmental merit order” that ranks CO2 sources by the
environmental impacts of using them as feedstockiv. This is fine in principle, but CO2U
processes in the market will probably decide which sources to use based on capture costsv or pipeline infrastructurevi instead of environmental benefits.
A second complication is to correctly specify what comparison the LCA will be used to make. For example, comparing the emissions impacts of different possible end-uses for a specific amount of captured CO2 (such as storage, EOR, mineralization or chemical intermediate
production) is different from comparing the emissions impacts of switching from a conventional process for producing a specific product (such as aggregates or methanol) to one based on captured CO2.
Third, in all cases other than air capturevii, the production of CO2 for use as feedstock in CO2U
technologies is accompanied by co-products such as electricity, steel, cement, ammonia, etc., and the overall emissions of these processes cannot be entirely assigned to the CO2-based
product(s). The preferred method for handling this is known as “system expansion”, in which the scope of the analysis is increased to include all other relevant products.viii Unfortunately, this can get extremely unwieldy for processes that involve lots of products, and it also means that the LCA does not result in a clear emissions impact from a single CO2-based product.
The alternative method, known as “proportional allocation”, parcels out the total emissions among the various co-products, usually based on mass. However, this method sometimes leaves room for ambiguity, and different approaches to allocation have been shown to lead to significantly different LCA conclusions.ix
A fourth complication is the lack of data on some of the non-CO2 reactants, catalysts and other
parts of the full CO2U system. Tracking the emissions footprints of these items is a significant
supply-chain information challenge, and it is often impossible in practice to use complete information for a LCA study. Therefore there is a need for standard approximations or estimates to compare LCAs for multiple products on an equal basis.
Finally, it’s important to note that while the primary focus of climate policy is on CO2 emissions,
there are other environmental impacts from CO2U technologies that should be considered, such
as the acidification potential, ozone layer depletion potential, etc.
Because of these complications, LCA experts can come to very different conclusions about the overall emissions impact of the same or similar CO2U technologies. For example, a review of 16
individual studies of CO2U technologies including mineral carbonation (mineralization), chemical
production, biofuels production, and EOR found a wide range of results, whose variation is so big that it is difficult to draw conclusions about their relative emissions impact, or give guidance to policymakers.x
Unfortunately, because of limited research funding, the CO2U LCA research community is small,
gaps in the literature. These LCA studies are relatively low-cost, and should receive more funding.
As governments and industry consider increasing policy support for CO2U, ideally, they will
need to compare and harmonize their approach to LCA as it applies to policy decisions. Governments and industry should increase their focus on this topic and ensure that LCA is included in all CO2U research coordination efforts. However, given the increasing interest in
CO2U, other stakeholders may need to act sooner. The Global CO2 Initiative is planning to
convene a global expert panel in an attempt to ‘standardize’ LCA analysis for CO2U
technologies. Additionally, the X Prize Foundation is pursuing rigorous LCA for all entries in its Carbon X Prize, and will gather detailed process data, putting it in a position to contribute to standardizing LCA approaches for CO2U.
Policy and industry support for CO2U may also need to consider other key factors beyond the
environmental impacts as analyzed by LCA, such as whether the revenue from CO2U
technologies can cover the costs of feedstock CO2, and the scalability of the technology.xvi A
related challenge is the perceived trade-off between CO2U business models that maximize profit
through producing small volumes of high-value products, and those that maximize emissions reductions by producing large volumes of lower-value products.xvii
Of course, the challenges faced in applying LCA to CO2U technologies are not entirely new, as
LCA has been a key part of environmental analysis and policymaking for many years, most notably relating to biofuels and bioenergy.xviii Increasing funding for CO2U LCA could draw the