2018 International Conference on Applied Mechanics, Mathematics, Modeling and Simulation (AMMMS 2018) ISBN: 978-1-60595-589-6
Dynamic Simulation of Moving Element for Dynamic Calibration Device
of Eddy Current Sensor Based on ANSYS
Xiao HE, Xiang XU* and Sen YANG
Hongta Tobacco (Group) Co., Ltd., Yuxi653100, China
Keywords: Dynamic calibration, Moving element, Induction plate, Modal analysis, Harmonic
response analysis.
Abstract. In order to ensure that the moving element of dynamic calibration of the eddy current sensor does not resonate and the unevenness of vibration does not affect the accuracy of calibration, modal analysis and harmonic response analysis was performed within the frequency range of the dynamic calibration device of the eddy current sensor. The results show that the first order modal frequency of the moving element is 3406 Hz, which is 5 times greater than the maximum calibration frequency. The vibration unevenness of the induction plate at maximum working frequency is 0.73%, which does not enough to significantly influence on the calibration accuracy. Therefore, the design of the moving element of dynamic calibration device for the eddy current sensor meets the requirements of operation.
Introduction
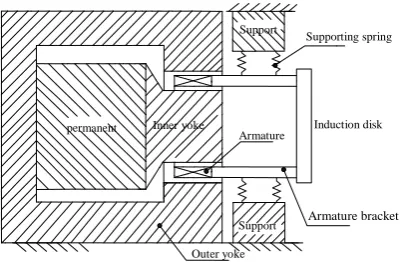
[image:1.595.189.390.526.657.2]The actuator of the dynamic calibration device of the eddy current sensor is mainly electromagnetic vibrating table, which consists of the stationary part and the movable part. The stationary part consists of a permanent magnet and an internal and external magnetic yoke, which is designed to generate a uniform air gap field between the magnetizer and the front end cover. The movable ring frame and the supporting spring of the movable part table are composed, and the schematic diagram is shown in Figure 1. The principle of electromagnetic vibration table is that the moving charge is subject to lorentz force in the magnetic field, and the conduction in the magnetic field is subject to the electromagnetic force F=BIL. When the coil in the moving coil passes with a standard sinusoidal current I=I1 sin (wt+φ), electromagnetic vibrating table in the electromagnetic force standard changes in sinusoidal law[1-2], and then drive table to do standard sinusoidal vibration.
Figure 1. Schematic diagram of electromagnetic vibration table structure.
Modal Analysis
During the dynamic calibration of electrical vortex sensor, the moving components include moving coil, moving coil frame and working table (including sense element). As for dynamic analysis of moving components, it is required to consider the heterogenerty of the sense element at the inherent
Outer yoke Support
Armature Inner yoke
permanent
magnet
magnet Armature bracket
Supporting spring
Support
frequency and vibration. The range of working frequency of moving components is 1-500 Hz, so the inherent frequency should be much higher than the upper limit working frequency.
The model analysis is one of the fundamental ways to verify the rationality of the component structural design. By means of modal analysis, verify whether the inherent frequency of the designed components can meet the requirements for application. It is required to complete establishment of the model, definition of the material attributes, unit grid division and simulation calculation, which is detailed as below.
Establishment of Model
[image:2.595.204.405.284.392.2]When stimulation with ANSYS, there are two methods to establish the model. The one is to establish 3D model with SolidWorks software, and then transform the model into IGES format and import it to ANSYS software. The other is to directly establish a 3Dmodel[3] in the classic GUI interface of ANSYS. In this chapter, as the moving components are rotating bodies, so it is easy to establish the model, classical GUI interface is preferred, as shown in Figure2.
Figure 2. 3D model of moving components.
Definition of Material and Division of Unit Grid
In ANSYS software, the material of sense element is set as 42CrMo and the material of moving coil frame is LY11, the moving coil is made of copper. The mechanical properties of materials are shown in Table 1.
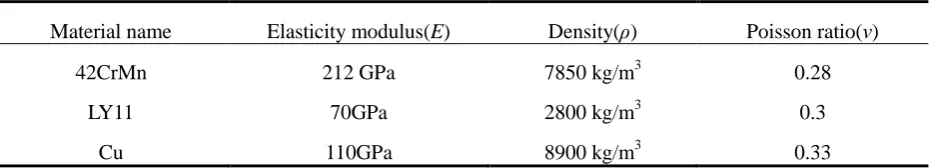
Table 1. Material properties of moving components.
Material name Elasticity modulus(E) Density(ρ) Poisson ratio(ν)
42CrMn 212 GPa 7850 kg/m3 0.28
LY11 70GPa 2800 kg/m3 0.3
Cu 110GPa 8900 kg/m3 0.33
The SOLID186 unit grid with 20 nodes is selected for sense element and sense element support. SOLID186 is a high-order 3D 20-node solid structure unit, and SOLID186 has a quadratic displacement mode which can simulate irregular grid in a better way. The unit is defined by 20 nodes, each node has three degrees of freedom of translation along the direction of xyz. The sense element's half-section model is established, and the surface unit is divided. The 3D hexahedron sense element model is obtained by rotating the quadrilateral surface unit. Meanwhile, more units are divided on the side of the length of the sense element support, thus improving the accuracy of finite element analysis and calculation . The sense element model is shown in Figure 3 after the grid is divided, then boundary conditions of all components in the model are set, and complete constraints of six degrees of freedom are imposed on matching part. Considering that the influence
Armature components
[image:2.595.67.532.533.617.2]Figure 3. Model of grid division of moving components.
Stimulation Calculation
Through the mode analysis, inherent frequency, mode vibration of the moving components can be obtained, so as to verify whether the dynamic characteristics of the moving components meet using requirements. In this chapter, extract mode frequency and vibration mode with Subspace method, and Subspace method adopts complete stiffness and mass matrix to solve with higher accuracy[4-6].
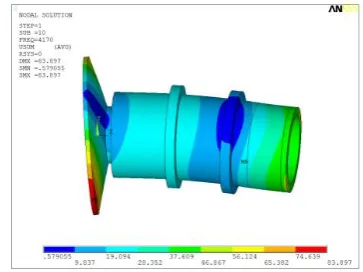
[image:3.595.81.280.412.558.2]Through mode analysis, the frequency of the first order of mode of sense element and connector model is 3406Hz, the upper limit frequency of sense element is 500Hz, and the inherent frequency of the first order of the model is more than 5 times of upper limit frequency, so it meets the requirement. Through simulation analysis, the vibration modes of moving components can be visualized at different orders of mode. Figure 4, Figure5, Figure 6 and Figure 7 show the vibration mode from the first order to the fourth order of moving components. As shown in the figure, vibration mode of moving components is inconsistent with the direction of the excited vibration, so the moving components don’t resonate within the range of working frequency.
[image:3.595.307.497.417.555.2]Figure 4. Inherent vibration mode of the first order. Figure 5. Inherent vibration mode of the second order.
[image:3.595.315.497.586.722.2] [image:3.595.78.261.588.722.2]Harmonic Response Analysis
[image:4.595.140.429.278.431.2]In the design of electrical vortex sensor sense element, with the purpose of verifying the heterogenerty of sense element meets design requirements in the process of calibration, it is required to analyze the harmonic response within the range of using frequency of sense element. When analyzing, the sinusoidal excitation signals are distributed around the coil, when the moving components are under sinusoidal excitation with working frequency concentrated around the coil, it senses displacement of all points of surface in the X direction. As vibration of all points of surface of sense element at low frequency band is almost synchronous, and the heterogenerty of vibration of each point is very small, there is little effect on the precision of dynamic calibration, so the range of frequency in the harmonic response analysis is 100-500Hz, within this frequency band, the amplitude of moving components is very small, and the effect of the supporting spring on the harmonic response analysis of moving components can be ignored. So the harmonic response analysis model of moving components is established as shown in Figure 8.
Figure 8. Harmonic response analysis model of moving components.
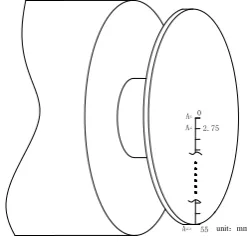
With the function of path mapping of ANSYS, in the radius direction of sense element, 23 mapping points are taken with equal interval of 2.75mm from the center of sense element to edge, the vibration amplitudes of all points on the sense element at the excitation signal frequency are obtained, and the heterogenerty of amplitude of surface of sense element is determined according to the formula of heterogenerty (1)[7-9], and mapping points on the path are shown in Figure 9.
max mid mid 100%. A A
A
(1)In the formula.Amax-maximum value of amplitude of all points of sense element; Amid-amplitude of middle point of sense element.
Figure 9. Schematic diagram of mapping points and mapping path.
A1
A23
0
55 unit:mm 2.75 A2 A 1/f Excitation signal Y - Z Excitation signal
-1/f
[image:4.595.235.359.619.741.2]frequency interval, harmonic response analysis is conducted to moving components at all frequency points, so the heterogenerty of sense element vibration under excitation of frequency. The analysis results of heterogenerty of the tested frequency points, the heterogenerty of surface of sense element increases with the increasing of excitation frequency, as shown in Figure 10.
Figure 10. Heterogenerty of all frequency points within the range of 100~500Hz.
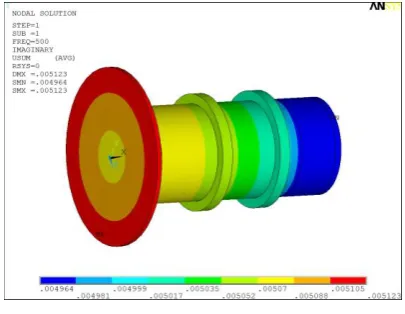
According to the variation law of vibration heterogenerty with excitation frequency, whether the heterogenerty of sense element at the highest frequency point meets the requirements is the key point for the structure of sense element to meet the heterogenerty, data of all mapping points obtained from the analysis results of harmonic response at the maximum calibration frequency of 500Hz are as shown in Figure 11. Through calculation, the heterogenerty of sense element at such frequency is about 0.73%, and its vibration shape is shown in Figure 12.
Figure 11. Schematic diagram of results of mapping points of 500Hz harmonic response analysis.
Figure12. Vibration shape of 500Hz harmonic response analysis.
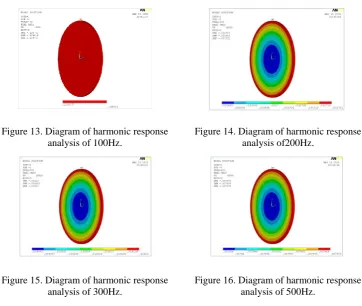
During the harmonic response analysis, as much attention is paid to the heterogenerty of surface of sense element, and the heterogenerty of the surface of sense element is observed under the whole assembly, as the heterogenerty of surface of sense element is very small to that of amplitude of all parts of the whole assembly under the sinusoidal excitation, the heterogenerty of vibration of all points of sense element cannot be intuitively reflected from the whole assembly. In order to reflect the vibration heterogenerty of the sense element surface more intuitively, other components in the model are hidden. The vibration shapes of sense elements at the frequency point of 100Hz, 200Hz, 300Hz and 400Hz are shown in Figure 13, Figure 14, Figure 15 and Figure 16. As intuitively shown in the figure, the amplitude heterogenerty of the sense element surface increases with the increase of excitation frequency.
U
n
ev
en
n
ess
(%)
Amplitude(mm
)
[image:5.595.314.517.430.587.2]Figure 13. Diagram of harmonic response analysis of 100Hz.
Figure 14. Diagram of harmonic response analysis of200Hz.
Figure 15. Diagram of harmonic response analysis of 300Hz.
Figure 16. Diagram of harmonic response analysis of 500Hz.
Summary
In this article, dynamic stimulation was achieved to moving components according to characteristics of moving to be completed by the calibration device, mode analysis and harmonic response analysis were conducted to moving components of electromagnetic vibration table with Ansys software, so as to verify that the inherent properties of moving components of electromagnetic vibration table meet the using requirements with in the 1-500HZ work frequency. meanwhile, the heterogenerty of sense element in dynamic calibration was solved, which ensured heterogenerty of surface vibration of sense element meets the design requirement within the working frequency.
Reference
[1] Wang Chunyu. Research on design theory and motion control technology of ultra-low frequency standard vibration table [D]. ZheJiang University, 2013,13-15.
[2] Jin Zidi. Study on multi-path composite frequency calibration of eddy current sensor[D].ZheJiang University, 2014, 26-28
[3] Yang Si-hui, Chen Jian-kui, Yin Zhou-ping. Machine Frame Structure Design by Natural Frequency Optimization[J]. Machinery Design & Manufacture, 2018, (10),71-73, 77
[4] Wang Ai-yu, Pan Hong-xia, Liu Hui-ling. Study on fault feature extraction of high-speed automaton [J]. Indonesian Journal of Electrical Engineering and Computer Science, 2013, 11(10): 5867-5875.
[5] Lv Ting, Shi Xiu-dong.Modal Analysis for the Frame of Crusher Based on ANSYS
[J].Machinery Design & Manufacture, 2008(11): 99-101.
[7] Lv Duan, Zeng Dong-jian. Finite element modal analysis of V8 enginecrankshaft based on ANSYS workbench[J].Machinery Design & Manufacture, 2012(8): 11-13.
[8] Zhi Chao, ong Hong, Cheet Lim Anders Brandt. Automated impact device with
non-synchronous impacts: a practical solution for modal testing during operation [J]. Journal of Zhejiang University Science A: Applied Physics & Engineering, 2018, (19), 452-460.