5224
COMPUTER AIDED SYSTEM FOR DETECTION AND
CLASSIFICATION OF BRINJAL LEAF DISEASES USING
THERMAL AND VISIBLE LIGHT IMAGES
1S. VENI, 2P.M.VISHNU PRIYA, 3G.M. AISHWARYA MALA, 4ASHWINI KAYARTAYA, 5R. ANUSHA
Department of Electronics and Communication Engineering
1Associate Professor, Amrita School of Engineering, Coimbatore, Amrita Vishwa Vidyapeetham, Amrita
University, India-641112
2,3,4,5 B.Tech ECE Students, Amrita School of Engineering, Coimbatore, Amrita Vishwa Vidyapeetham,
Amrita University, India-641112
E-mail: 1[email protected], 2[email protected], 3[email protected], 4 [email protected], 5[email protected]
ABSTRACT
Agriculture plays a significant role in the overall socio-economic fabric of India. One of the several problems it faces in the country is the decline in productivity due to the drastic increase in plant diseases. The observations for detection of such diseases can be prohibitively expensive. Hence, a system which provides a faster and more accurate solution is necessary. Thermal images have a fine potential for early detection of diseases due to the temperature variations that occur as a result of the change in transpiration rate in plant leaves. Thus an attempt is made for the combined analysis of the visible light and thermal image features for early and accurate disease detection. The proposed work aims at developing a computer aided system that uses image processing algorithms to detect and classify plant diseases from Solanum
Melongena (brinjal) leaves. The process starts with image acquisition using thermal and RGB cameras to
obtain the data set, these images are then pre-processed and the region of interest is segmented out. The colour and temperature features are extracted and are used to detect and classify the healthy and diseased leaves. For classification, Support Vector Machine (SVM) and Artificial Neural Network (ANN) are used and their performances are compared. The experimentation reveals that SVM has a better accuracy (90.9%) than that of ANN (89.1%).
Keywords: Thermal Image, Silhouette extraction, Image registration, Support Vector Machine (SVM), Artificial Neural Network (ANN)
1. INTRODUCTION
The anatomy of global agriculture has undergone a complete metamorphosis in the recent decades and hence agriculture has grown to become one of the largest economic sectors in many parts of the world. Agriculture forms the back bone of the Indian economy and nearly 59% of our population is dependent on it. The agriculture sector continues to be pivotal to the sustainable growth and development of the Indian economy. It is a known fact that Indian agriculture is under tremendous stress over the past two years due to continuous droughts. This situation has recently lead to fresh thinking on the developmental approach in the agricultural sector.
5225 constant monitoring, real-time feedback and an analysis of the outcomes for the crop yields, plant and soil health etc. This works forms the basis for such a system for automated monitoring in the agricultural fields.
Brinjal, Solanum Melongena is one of the
most widely grown vegetable crops all over the world for its purple or green pendulous fruit. India is one of the major producers of brinjal in the world with about 8.45% of the total area under vegetable cultivation occupied by brinjal. The farming system has increased its dependence on agro chemicals which has led to severe ill effects that include the diseases caused by pathogens and pests. The most common parasitic diseases that affect brinjal leaves are leaf spot disease caused by Cerocospora
melangina, Verticillium wilt due to Verticillium
dahliae, bacterial wilt due to Psuedomonas
solancearum and mosaic which is a viral disease
transmitted by aphids (Aphis gossypi and
Myzuspersicae) [1].
The growing importance of brinjal cultivation on the Indian agriculture and the escalating crop failures makes it necessary to develop an algorithm for early and accurate detection of diseases affecting the brinjal plants. It can be achieved using thermal images which have a fine potential for early detection of diseases due to the temperature variations that occur as a result of the change in transpiration rate in plant leaves which is the motivation of this work. This work proposes a method to develop suitable algorithm for the brinjal leaf disease detection and classification using combined analysis of the visible light and thermal image features for early and accurate disease detection. The major processing steps used are (i) Image acquisition using thermal and digital cameras (ii) Image registration (iii) Segmentation using edge detection (iv) Feature extraction of temperature and color and (v) Classification.
Remaining sections are organized as follows. Section 2 describes related works by various researchers. Section 2.1 highlights the proposed work flow. Sections 3, 4, 5, 6 and 7 elaborate the processing steps namely Image acquisition, Registration, Segmentation, Feature extraction and Classification respectively. Results are summarized in section 8 and conclusions are given in section 9.
2. RELATED WORKS
The leaf disease detection techniques were proposed by various researchers using contrast enhancement, histogram equalization, HSI colour transformation, noise removal filter for image preprocessing and edge detection, k means clustering and masking the green pixels for image segmentation [2-7]. Feature extraction was performed using Spatial Gray-level Dependence Matrix (SGDM), Gray-Level Co-occurrence matrix (GLCM), local colour histogram and colour coherence vector [8-11]. Different algorithms like SVM, ANN, k nearest neighbor, fuzzy logic, probabilistic neural networks and genetic algorithm are proposed for classification [1 -17]. The above mentioned methods were part of works that dealt with merely visible light image processing. But, for the early detection of diseases in leaves, it is essential to acquire the images with thermal camera which has the features such as (i) the detection of a disease at early points in time (ii) the differentiation among different diseases (iii) the separation of diseases caused by abiotic stresses and (iv) the quantification of disease severity. These parameters need to be assessed with a level higher or equivalent to the accuracy attained with standard assessment methods and with a shorter computation time.
5226 It is necessary to perform a preprocessing step of image registration to align the picture elements of both the images. S.A.Raza et. al. [4] have proposed an algorithm for registration of visible light and thermal images using silhouette extraction. The algorithm is based on a novel multi-scale method that employs the stationary wavelet transform to extract the silhouette of diseased plants in thermal images. Experimental results show that silhouettes extracted using this method can be used to register thermal and visible light images with high accuracy. The registered images are segmented to obtain the area of interest using edge detection [5]. From the area of interest the necessary temperature and color features for classification are extracted out. S.R.Dubey et. al. [8] presented a method to extract the colour, texture and shape features for classification of diseases in apples. S.N.Ghaiwat and P.Arora [9] have reviewed various classification algorithms like k-nearest neighbor, artificial and probabilistic neural networks, genetic algorithm and fuzzy logic and discussed the merits and drawbacks for each of the classifier algorithms.
From these studies, it was observed that there is a lack of research based on thermal images for leaf diseases detection and classification which is the key motivation of the proposed work. Hence, combined analysis of visible light and thermal images of brinjal leaves is addressed in the proposed work for disease detection which has not been attempted yet. This methodology starts with image acquisition to create a dataset with thermal and visible light images.
2.1 Proposed Method
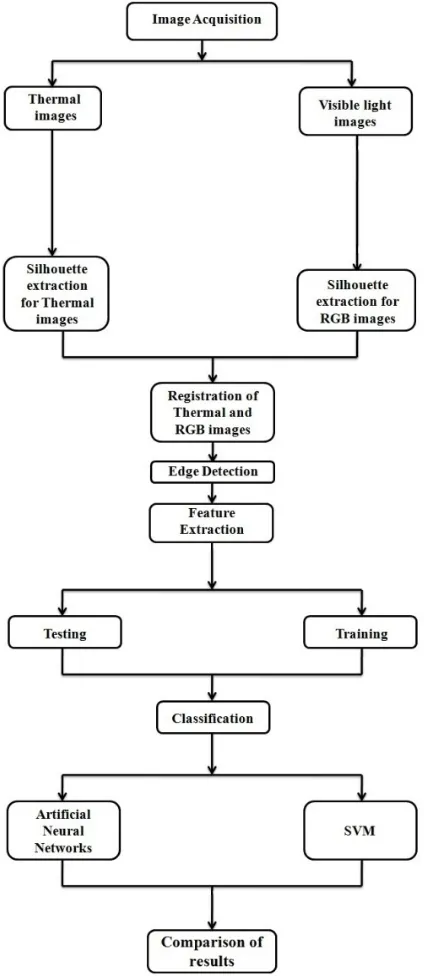
Figure 1 describes the block diagram of the proposed work. The method starts with image acquisition step using thermal and digital cameras for collection of the dataset. During data acquisition the images are acquired using different type of sensors therefore before performing the joint analysis it is necessary to register the visible light and thermal images. Edge detection is performed on the registered visible light and thermal images to segment out the area of interest for feature extraction. The region of interest that was obtained in the above process is used for extraction of various features for classification. Classification, which is the decision making fragment of this project is performed with the help of two classifiers namely, Artificial Neural Networks (ANN) and Support Vector Machines (SVM). The detailed
[image:3.612.312.524.116.605.2]description of each processing steps is given in the next sections.
Figure 1: Block Diagram of the Proposed Work
3. IMAGE ACQUISITION
5227 trained adequately. Leaf images were captured using FLIRONE, MAPIR and digital cameras.
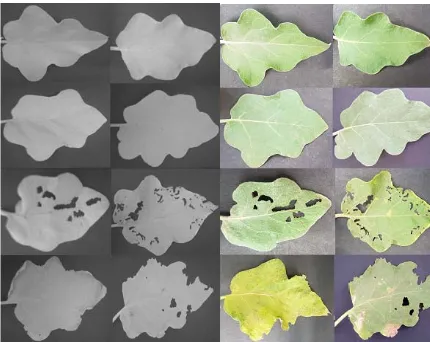
[image:4.612.90.305.299.470.2]The thermal images were acquired using FLIRONE and MAPIR cameras that capture the infrared radiations emitted by the plants. The temperature variation in the leaf aids in finding out the diseased region as they have relatively higher temperature than their healthy counterpart. The visible light images were acquired using a digital camera. Figure 2 and 3 shows few sample images of brinjal leaves acquired. A joint analysis of the visible light and thermal images has to be performed for which it is necessary to align the pixels of the images. This is done with the help of image registration which is explained in the following section.
Figure 2: Thermal Images acquired using MAPIR camera and the corresponding RGB images
Figure 3: Images acquired using FLIRONE camera 4. IMAGE REGISTRATION
During data acquisition the thermal and RGB images are captured in various resolutions and from diverse viewpoints using different type of sensors. This work mainly involves integrating the features extracted from both visible light and thermal images; hence there arises a necessity for a pre-processing step called registration before the joint analysis. Registration aligns the pixels of both the thermal and visible light images so that the same pixels in both the images correspond to the same physical location on the leaf. Common methods for registration of images are based on mutual information. While registering both the images this technique may fail as plant texture in thermal images significantly differs from the corresponding texture in RGB images. This calls for a more appropriate and accurate silhouette extraction based registration algorithm [3].
4.1 Silhouette Extraction of Thermal Images In thermal images as the thermal intensities of the background are close to that of the leaves, the edges present are weak hence instead of common gradient based edge detection methods we use a multi scale Stationary Wavelet Transform (SWT) based method. The multi-scale SWT based method begins with the decomposition of the thermal image using a Haar filter into sub-bands each being the size of the input thermal image. For each pixel location a Hessian matrix of second derivatives X, , is computed with the vertical, diagonal and horizontal coefficients at sub-band s
(scale or level of decomposition), and pixel location (i, j). The singular values of Matrix X, , are calculated by decomposing it using Singular Value Decomposition (SVD). These singular values of the Hessian matrix X, ,gives the direction of highest curvature or the curvature strength at the pixel location (i, j). Hence we take the largest of the singular values of the hessian matrix X, ,to create an edge map, Es for the image at scale s. Equations
1 and 2 are used for the computation of edge map Es.
X, ,
V, , D, ,
D, , H, , (1)
5228
E i, j max λ, , 1 , λ, , 2 (2)
Where λ, , 1 and λ, , 2 are the singular values of the Hessian matrix X, , .
It is observed that at low s values there is
high noise content in the edge map Es and the edge
detected is thin. As the value of s increases the
noise content reduces and the edge becomes thicker. Based on the above mentioned observations a multi-scale approach that uses the correlation of coefficients across scales is developed. Bs is the binary equivalent of Es obtained by the
thresholding. Bs is then multiplied point-wise with
Es-1 and the log of the product that is log (Bs*Es-1) is
thresholded to obtain the binary image at scale s-1, Bs-1.
Taking into consideration the computation complexity the method starts with s = 5. Scale s = 5
proved to provide the best trade-off between computational complexity and accuracy. The method ends with s = 3. Scale s = 3 was found to be
the finest trade-off between the weak and hazy boundary which will affect the accuracy of the edge detected. Therefore the binary image, B3 gives the
boundary of the thermal image. From the edge detected binary image the silhouette of the thermal image is obtained with the help of morphological operations.
4.2 Silhouette Extraction of Visible Light Images For visible light images, edge detection is performed by a gradient based approach. The edges in a visible light image are identified by the sudden discontinuity present in the intensity values of the pixels. The method starts with noise removal using an anisotropic diffusion filter in visible light images of the leaves. Anisotropic diffusion filters smoothens the background while preserving the edges and boundaries and keeping them sharp. The algorithm uses sobel operator to compute the gradient of the image. The resultant image is then thresholded to obtain the edge. Silhouettes of the visible light images are obtained after morphological operations on the corresponding edges obtained for the images. When compared to SWT based edge detection gradient based edge detection has a lower computational complexity and produces good results when the edge is not weak. Hence for visible light images edge detection using gradient based algorithm is more advantageous than SWT based algorithm [4].
4.3 Methods of Registration
The thermal image is considered as the reference (or static image) and its corresponding visible light image is considered as the target (or floating) image. Registration involves two steps namely Rigid and Non-Rigid Registration as explained in the following sections.
4.3.1 Rigid registration
In the rigid registration step, a similarity transformation algorithm is applied for a global transformation. Similarity transformation for a two dimensional image is given by equation (3) below,
∗ (3)
Where S is the scale factor, α is the rotation angle
along the Z-axis and tx and ty are the shifts in the
X-axis and Y-X-axis. x1 and y1 represent a point in the
floating image and x2 and y2 represent the
corresponding point in the static image. In this case, we take the centroid of the silhouette of the thermal as (x1,y1) and the centroid of the silhouette of its
corresponding visible light image as (x2,y2) to
compute the shift necessary in the pixels of the floating image [4].
4.3.2 Non rigid registration
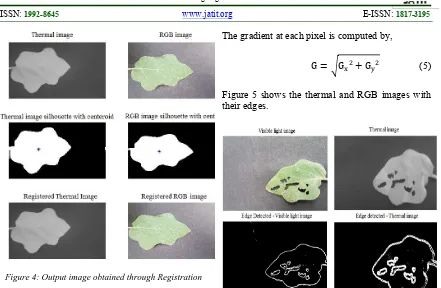
Non-rigid registration takes into account the local geometric differences between the static and the floating image. Non-rigid registration is performed using a Free-Form Deformation (FFD) model based on multi-level cubic B Spline approximation [4].FFD model works by deforming an image by manipulating an underlying mesh of control points. After non-rigid registration we obtain the registered thermal and visible light making the images appropriate for joint analysis. Figure 4 shows the silhouette extraction and registration of thermal and visible light images.
5229 Figure 4: Output image obtained through Registration
5. SEGMENTATION
Edge detection is a technique which identifies points in the image at which there exists discontinuities in the intensity values in order to find the boundaries within the image. Edge detection is performed on the registered thermal and visible light images to segment out the area of interest for feature extraction. In thermal images as the thermal intensities of the background are close to that of the leaves, the edges present are weak and hence common gradient based edge detection methods will not give satisfactory results. Hence an SWT based edge detection method is suggested for thermal images. For visible light images edge detection is simply done by computing the gradient of the image using the Sobel operator. Sobel operator uses two 3 x 3 kernels to compute the vertical and horizontal derivatives. The input image, say I, whose edge has to be detected, is convolved with the kernels to obtainG and G
G 1 02 0 12
1 0 1 ∗ I
G 10 20 10
1 2 1 ∗ I (4)
(* here represents 2-dimentional convolution)
The gradient at each pixel is computed by,
G G G (5)
[image:6.612.90.249.621.701.2]Figure 5 shows the thermal and RGB images with their edges.
Figure 5: Edge Detected Images
As mentioned earlier the region of interest is segmented out to extract the necessary features for classification. This process is explained in the next section [4].
6. FEATURE EXTRACTION
Feature extraction is one of the most important steps in image processing. Features are the information extracted from images in terms of numerical values. It involves two complimentary techniques namely local and global, for the extraction of necessary information from the region of interest of the leaf images. The local feature extraction technique deals with extraction of features at each pixel of the image, whereas Global features consider the image as a whole to generalize the entire object [3] [8].
6.1 Local Feature Extraction
As an initial step, colour space of the RGB image is converted to L*a*b. Similarly, the RGB
5230 space, L provides the luminance value, a and b
carries all the colour information. Methods and formulae used for converting RGB to (i) CMYK image (ii) L*a*b color space are given in equations
7 – 21.
6.2 Temperature Feature
Any object which has temperature above absolute zero T = 0 K, emits radiations because of the movement of atoms and molecules in it. It is possible to record these infrared radiations that are emitted by the object using the thermal cameras as mentioned earlier in image acquisition part given by the Stefen Boltzmann formula,
W=σϵ (6)
The intensity of these infrared radiations varies from pixel to pixel thus, forming an intensity plot in spatial co-ordinates. The two dimensional view of this plot gives the thermal image where, the intensity at each pixel describes the temperature feature. In that case, the temperature feature, T is derived [3].
6.3 Formulation
The R, G, B components are divided by 255 to bring the range from 0…255 to 0…1
1 1 1 (7)
The black key (K) is obtained from Red (R1), Blue (B1) and Green (G1) component
1 1, 1, 1 (8)
Cyan is obtained from Red (R1) and black (K) component obtained from the image,
Cyan, (9)
Magenta is obtained from Green (G1) and black (K) component obtained from the image,
Magenta, (10)
Yellow is obtained from Blue (B1) and black (K) component obtained from the image,
Yellow, (11)
[image:7.612.315.520.92.167.2]Figure 6 shows the cyan and yellow components of the CMYK colour space.
Figure 6: Cyan and Yellow Component of CMYK colour space
RGB to L*a*b*:
RGB to XYZ:
When R1 0.04045,
R1 . . .
Otherwise,
R1 . (12)
When G1 0.04045,
G1’ . . .
Otherwise,
G1’ . (13)
When B1 0.04045,
B1’ . . .
Otherwise,
B1’ . (14)
R1’ R1’ ∗ 100
G1’ G1’ ∗ 100
B1’ B1’ ∗ 100
X R1′ ∗ 0.4124 G1′ ∗ 0.3576 B1′∗ 0.1805
(15)
Y R1’∗ 0.2126 G1’∗ 0.7152 B1’∗ 0.0722
(16)
Z R1’∗ 0.0193 G1’∗ 0.1192 B1’∗ 0.9505
(17) XYZ to L*a*b:
X1 . Y1 Z1 . (18)
5231
X1’ X1^ 1/3
Otherwise,
X1’ 7.787 ∗ X1 (19)
When Y1 0.008856
Y1’ Y1^ 1/3
Otherwise,
Y1’ 7.787 ∗ Y1 (20)
When Z1 0.008856
Z1’ Z1^ 1/3
Otherwise,
Z1’ 7.787 ∗ Z1 (21)
L ∗ 116 ∗ Z1’ 16
a ∗ 500 ∗ x1’ y1’
b ∗ 200 ∗ y1’ z1’
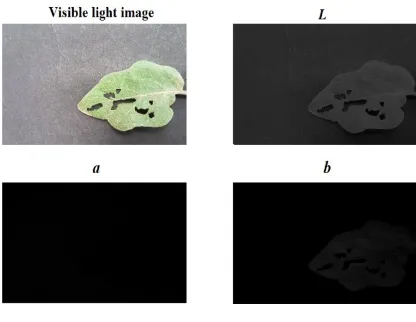
Figure 7 shows the RGB image with its L*a*b
components.
Figure 7: L*a*b Component
6.4 Global Feature Extraction
This work considers global features such as mean and standard deviation of L, a, b, C, Y & T
values of the entire image. Following features are considered namely (i) standard deviation of temperature (σT) (ii) mean value of cyan ( and
yellow components ( of the leaf (iii) standard deviation of L ( and a ( of L*a*b color
space is fed to the classifier as inputs [3]. We train the SVM and ANN classifiers using this feature set, till the required accuracy is reached. The next step is to input the test data from the dataset to the trained classifiers. The output of which should convey whether that particular leaf is diseased or not. Hence, Combination of global and local
features improves the accuracy of the recognition with the side effect of computational overheads. Table 1 below gives the values of the features extracted from a particular brinjal leaf as an example.
Table 1: Extracted Features
Mean of temperature (µT) 0.6121
Standard deviation of temperature (σT) 0.0158
Mean of cyan component (µC) 0.0898
Mean of yellow component (µY) 0.2280
Mean of L component (µL) 0.2025
Standard deviation of L component (σL) 0.0022
Mean of a component (µa) -0.0402
Standard deviation of a component (σa) 0.00047
The above features are calculated for the every image in the data set. These features are used for training the classifier to obtain optimum results for the test data. Classification, the decision making fragment of the algorithm is implemented with two classifiers namely SVM and ANN. The same is elaborated in the succeeding section.
7. CLASSIFICATION
The basic idea of the classifier is to classify the given data into a fixed number of output categories based on the training of the machine. This is done with help of machine learning algorithms. Machine learning is a method for analysis of data that automates analytical model building and designing algorithms that learn from the data iteratively. Machine learning has evolved to perform specific tasks to iterative models to train efficiently so that when they are open to new data they provide accurate results.
[image:8.612.98.306.359.520.2]5232 Artificial Neural Networks is a machine learning algorithm that is built based on the neural structure of the human brain. Problems beyond the capability of current computers can be solved by techniques like ANN that are inspired from the working of a human brain. Thus a neural network consisting of a number of hidden layers is designed based on the required inputs, target or the expected output to train the classifier [7] [14]. The uniqueness or intelligence of the network depends on the weights of the neurons. Hence for a learning neural network weights are to be adjusted to get the exact output. In that case back propagation neural network plays a significant role. Back propagation algorithm aims at minimizing the error function by following the gradient descent technique. Each layer in the network has specific weights and these are updated one by one at each iteration to reduce the error value [8] [12] [16] [18].
The classifiers are trained using the training data set that consists of both diseased and healthy leaves with their respective feature values {σT, µc, µy, σL, σa} and run with the test data to find
the accuracy and performance of the classifier. The results obtained are compared to find which of the two classifiers performs better and has greater accuracy. The results obtained from the two classifiers; SVM and ANN are compared in the next section below.
8. RESULTS
A Computer Aided system is developed for the identification of leaf diseases using ANN and SVM. The proposed method works well for the classification of diseases as “healthy “and “diseased“. The parameters mentioned in the equations 22-29 were derived from the results of the classifier and used for performance comparison of ANN and SVM.
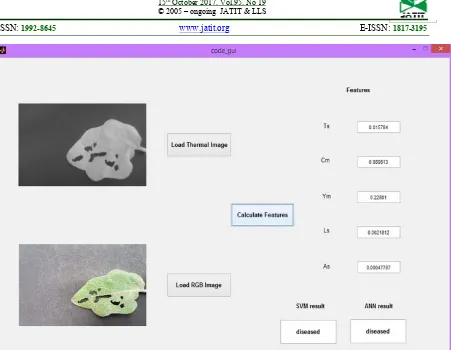
Graphical user interface (GUI) is a computer aided system that allows user interaction through graphical icons and visual indicators instead of text based user interfaces. A GUI can be created using MATLAB for any given code. The layout is designed based on the requirements and a code is generated to manage the input, output and the working of each component in the layout. In this work, the created GUI takes the brinjal leaf images as input and the calculated features are displayed along with the classification result as shown in Figure 8.
The performance of the classifiers, ANN and SVM are compared by computing various performance analysis parameters as listed below.
tp = Number of correctly classified diseased leaves tn = Number of correctly classified healthy leaves fp = Number of wrongly classified healthy leaves fn = Number of wrongly classified diseased leaves
Accuracy,
(22)
True Positive Rate (TPR),
(23)
False Positive Rate (FPR),
(24)
False Negative Rate (FNR),
(25)
True Negative Rate (TNR),
(26)
Positive Prediction Value (PPV),
(27)
False Discovery Rate (FDR),
(28)
False Omission Rate (FOR),
(29)
Negative Prediction Value (NPV),
5233
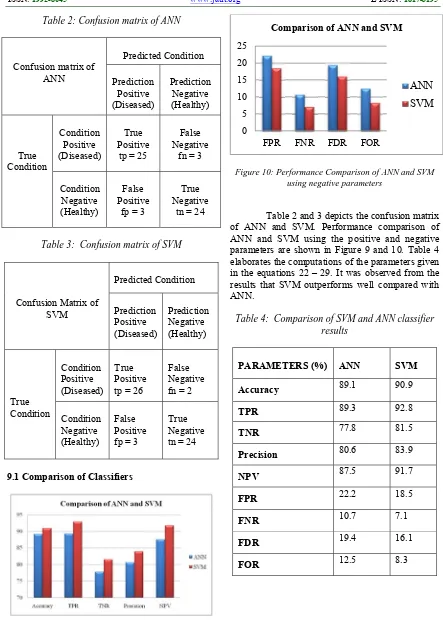
Table 2: Confusion matrix of ANN
Confusion matrix of ANN
Predicted Condition
Prediction Positive (Diseased)
Prediction Negative (Healthy)
True Condition
Condition Positive (Diseased)
True Positive
tp = 25
False Negative
fn = 3
Condition Negative (Healthy)
False Positive
fp = 3
True Negative
[image:10.612.88.533.49.288.2]tn = 24
Table 3: Confusion matrix of SVM
Confusion Matrix of SVM
Predicted Condition
Prediction Positive (Diseased)
Prediction Negative (Healthy)
True Condition
Condition Positive (Diseased)
True Positive tp = 26
False Negative fn = 2
Condition Negative (Healthy)
False Positive fp = 3
True Negative tn = 24
9.1 Comparison of Classifiers
Figure 9: Performance Comparison of ANN and SVM using positive parameters
Figure 10: Performance Comparison of ANN and SVM using negative parameters
Table 2 and 3 depicts the confusion matrix of ANN and SVM. Performance comparison of ANN and SVM using the positive and negative parameters are shown in Figure 9 and 10. Table 4 elaborates the computations of the parameters given in the equations 22 – 29. It was observed from the results that SVM outperforms well compared with ANN.
Table 4: Comparison of SVM and ANN classifier results
PARAMETERS (%) ANN SVM
Accuracy 89.1 90.9
TPR 89.3 92.8
TNR 77.8 81.5
Precision 80.6 83.9
NPV 87.5 91.7
FPR 22.2 18.5
FNR 10.7 7.1
FDR 19.4 16.1
FOR 12.5 8.3
0 5 10 15 20 25
FPR FNR FDR FOR
Comparison of ANN and SVM
[image:10.612.83.526.79.700.2]5234 9. CONCLUSIONS
A Computer Aided system was developed successfully for the identification of diseases in brinjal leaves with the joint analysis of thermal and RGB images. This work illustrates a faster and more accurate way of detecting and classifying leaf diseases in brinjal plants. Our experimental results demonstrate that by combining information from thermal and RGB images, accuracy of 90% is achieved. A comparison study of disease classification between SVM and ANN is also carried out. Here, SVM has produced a relatively higher accuracy and precision than ANN.
However, the validation for improvement in accuracy couldn’t be performed due to the lack of literature based on the joint analysis of thermal and visible light images. Nevertheless, the proposed methodology in this work was performed only with visible light images and found that the accuracy of classification reduced when compared to that of the joint analysis results. Thus use of thermal images proves to be beneficial in accurately detecting the presence of diseases to avoid crop loss and increase the yield. This work can be directly implemented on small projects like kitchen garden and research purposes with various other plants.
The proposed method can form the basis for various futuristic ideas that can make a difference in the field of agriculture. It can be improvised with the help of Multi class SVMs to classify which type of disease is present in the leaf. It can be taken a step ahead in the near future with the help of artificial intelligence that understands the environments, learns and takes decisions that have high chances of success for the desired action. AI can be used to implement constant monitoring and real time feedbacks systems which largely contribute to the large scale farming sectors.
REFERENCES:
[1] K. Lawande and J. Chavan, “Eggplant (brinjal),” Food science and technology Marcel
Dekker,New York, pp. 225–244, 1998.
[2] R. Anand, S. Veni and J. Aravinth, "An Application of image processing techniques for Detection of Diseases on Brinjal Leaves Using K-Means Clustering Method", Fifth International Conference On Recent Trends In
Information Technology, pp. 1-6, 2016.
[3] S. Raza, G. Prince, J. Clarkson and N. Rajpoot, "Automatic Detection of Diseased Tomato Plants Using Thermal and Stereo Visible Light
Images", PLOS ONE, vol. 10, no. 4, p.
e0123262, 2015.
[4] S. Raza, V. Sanchez, G. Prince, J. Clarkson and N. Rajpoot, "Registration of thermal and visible light images of diseased plants using silhouette extraction in the wavelet domain",
Pattern Recognition, vol. 48, no. 7, pp.
2119-2128, 2015.
[5] J. Sethupathy and S.Veni , "OpenCV Based Disease Identification of Mango Leaves", International Journal of Engineering
and Technology, vol. 8, no. 5, pp. 1990-1998,
2016.
[6] Yuan Tian, Chunjiang Zhao and Shenglian Lu, "SVM-based Multiple Classifier System for Recognition of Wheat Leaf Diseases",
Conference on Dependable Computing, pp.
189-193, 2010.
[7] H. Al Hiary, S. Bani Ahmad, M. Reyalat, M. Braik and Z. ALRahamneh, "Fast and Accurate Detection and Classification of Plant Diseases", International Journal of Computer
Applications, vol. 17, no. 1, pp. 31-38, 2011.
[8] S. R. Dubey and A. S. Jalal, “Apple disease classification using color, texture and shape features from images,” Signal, Image and
Video Processing, vol. 10, no. 5, pp. 819–826,
2015.
[9] S. N. Ghaiwat and P. Arora, "Detection and Classification of Plant Leaf Diseases Using Image processing Techniques: A Review", ISSN, vol. 2, no. 3, pp. 1-7, 2014.
[10]Haiguang Wang, Guanlin Li, Zhanhong Ma, Xiaolong Li, “Image Recognition of Plant Diseases Based on Back propagation Networks”, 5th International Congress on
Image and Signal Processing (CISP), 2012.
[11]G .A. Barbedo, “Digital image processing techniques for detecting, quantifying and classifying plant diseases”, Springer Plus, 2013, 2:660.
[12]P.S. Landge, S.A. Patil, D.S. Khot, O.D. Otari, U.G. Malavkar. , “Automatic Detection and Classification of Plant Disease through Image Processing”, International Journal of Advanced Research in Computer Science and
Software Engineering, vol. 3, Issue 7, ISSN:
2277 128X, 2013.
[13]S. Kumar and R. Kaur, "Plant Disease Detection using Image Processing- A Review",
International Journal of Computer
Applications, vol. 124, no. 16, pp. 6-9, 2015.
5235
ARPN Journal of Engineering and Applied
Sciences, vol. 10, no. 4, pp. 1913-1919, 2015.
[15]S.R.Dubey, A.S.Jalal,” Application of image processing in fruit and vegetable analysis: a review”, Journal Of Intelligent Systems, vol.
24, no. 4, pp. 405-424, 2015.
[16]V. Ramya and M. Anthuvan Lydia, "Leaf Disease Detection and Classification using Neural Networks", International Journal of Advanced Research in Computer and
Communication Engineering, vol. 5, no. 11,
pp. 207-210, 2016.
[17]S. Arivazhagan, R. NewlinShebiah, S. Ananthi and S. Vishnu Varthini, "Detection of unhealthy region of plant leaves and classification of plant leaf diseases using texture features", CIGR, vol. 15, no. 1, pp.
211-217, 2016.
[18]R. Pydipati, T. F. Burks and W. S. Lee, "Statistical And Neural Network Classifiers For Citrus Disease Detection Using Machine Vision", Transactions of the ASAE, vol. 48, no.
5236