ISSN: 1992-8645 www.jatit.org E-ISSN: 1817-3195
SONG STRUCTURE IDENTIFICATION OF JAVANESE
GAMELAN MUSIC BASED ON ANALYSIS OF PERIODICITY
DISTRIBUTION
1D. P. WULANDARI, 2Y. K. SUPRAPTO, 3M. H. PURNOMO
1,2,3
Institut Teknologi Sepuluh Nopember, Department of Electrical Engineering, Surabaya 60111 Indonesia
E-mail: [email protected], [email protected], [email protected]
ABSTRACT
In a song played by multiple instruments, there is distribution of periodicities that comes from different playing patterns among groups of instruments. We propose a visualization of this distribution for analyzing song structure of Javanese gamelan music. A predefined number of periodicities along with their confidence levels are obtained using comb filter resonator. The filter is applied to the auto-correlation function of overlapping analysis frames of the musical track. We cluster the distribution based on the proximity of two parameters, which are periodicity and confidence level. In this way, we assume that each cluster center represents the periodicity of a group of instruments. We observe four features of the visualization, namely the width and the average height of periodicity distribution, the pattern of dominant periodicities, and the fluctuation of the most dominant periodicity. Those features implicitly give us information regarding the strength applied to the notes, the estimated number of instruments, and the accent of song according to those features, from which we make an inference about the structure. We provide the experiment with a database of thirty Javanese gamelan songs and compare the analysis of lancaran, ladrang, and ketawang song structures. The results show that using this method, lancaran received the highest performance, which is 0.94 measure, followed by ketawang and ladrang with F-measure of 0.90 and 0.75 respectively.
Keywords: Comb Filter Resonator, Confidence Level, Periodicity Distribution, Song Structure Analysis, Javanese Gamelan Music
1.
INTRODUCTIONJavanese gamelan music is widely used as accompaniment of cultural events, like wedding ceremony, art show, and of many religious ones [1]. Each of the events has its own story plot and therefore it requires an accompaniment of different sequence of song structures. For example, in a shadow puppet show, the orchestra starts playing
simple yet dynamic structure of lancaran in the
beginning. Before the story goes to a new scene, the orchestra slows the tempo, softens the instrument playing, and prepares to move into more elaborate
songs, like those of ladrang or ketawang, giving the
audience an elegant impression. There are many kinds of song structure in Javanese gamelan music,
which are categorized as gendhing alit, gendhing
madya, and gendhing ageng [2]. This research focuses on three types of song structures which fall
into gendhing alit category, namely lancaran,
ladrang, and ketawang, since these structures are among the most frequently used ones.
Javanese gamelan music divides a song into several parts, called part A, part B, part C (if any), etc. In each part, every instrument has different playing pattern. We use the term pattern to
represent a combination of notation and
periodicities arise between notes. There are non-strict rules of determining the structure of Javanese gamelan song based on the number of lines contained in each part and the presence of particular
instruments sounds (like kenong, kethuk, and
kempul). Moreover, the players may repeat each part as many as they like depending on the situation (the flow of the story). But apart from these facts, Javanese gamelan experts are able to differentiate the song structure by recognizing the pattern as well as by feeling the rhythm.
In a Javanese gamelan ensemble there are several instrument groups. For the reason of simplicity we would like to mention three groups of
instruments as an example, which are saron,
peking, and gong. Saron group for example,
ISSN: 1992-8645 www.jatit.org E-ISSN: 1817-3195 usually played according to the notation, whereas
peking is usually played by striking each note in the
notation twice, and gong is stroke only at the end of
each line. Therefore these three groups may generate different periodicities. We visualize periodicity distribution of a song and analyze the structure implied by the pattern appears in the distribution.
The song is firstly divided into short overlapping frames. Each frame is considered as the basic unit of periodicity analysis. Periodicities of a frame are enhanced by employing a comb filter resonator [4]. We cluster the periodicities based on two parameters, the periodicity itself and the corresponding confidence level. Each cluster consists of neighboring periodicities which have relatively close confidence level. In this way, we assume the centers as a representation of periodicity of an instrument group. Clustering is carried out in order to overcome irrelevant variations that may present in a song.
This paper is organized as follows, Section I describes the background and outline the contribution of the research, Section II explains previous works related to the topic of this research, Section III proposes a new method to analyze the structure of Javanese gamelan song, Section IV shows the experimental evaluation of the proposed method, Section V presents the analysis of the experimental results, and Section VI concludes the analysis.
2.
RELATED WORKSThis research is a continuation of the previous ones regarding Javanese gamelan music transcription. A number of methods were implemented to transcribe the notation of Javanese gamelan music, such as the use of filter to extract instrument sound [5-7], and the use of onset detection method to transcribe
saron notations, [8-10]. Some other researches related to Javanese gamelan music performed instrument sound segmentation [11, 12], instrument timbre analysis [13, 14], and beat tracking [15]. Our proposed method of song structure analysis supports information retrieval and recognition of Javanese gamelan music which is an application of music transcription [16].
Many applications of musical signal processing are based on periodicity, such as in pitch tracking, beat tracking, tempo estimation, and
furthermore, in understanding rhythm. The
algorithms developed for periodicity detection are mainly built upon time-domain periodicity and frequency-domain periodicity [16]. The majority of the algorithms fall into the first approach, like [17]
and [18]. A research that studied periodicity based on spectral autocorrelation was proposed by [19] while that which based on autocorrelation of log spectrum was proposed by [20], where both applied
to speech signals.
In this research, we adopt beat period induction method using comb filter resonator [4]. But instead of selecting the most confident periodicity among hypotheses and consider it as the beat period of an analysis frame, we visualize the confidence levels of all periodicities in a track and make analysis about the song structure. In general, beat tracking algorithms consists of two stages, which are the generation of driving function from direct processing of audio signals and the detection of periodicities in these driving functions to find tempo estimates [21]. For generating driving functions we have compared several reduction functions based on spectral features and we conclude that spectral flux function is the best fit for our database [8].
Javanese gamelan instruments are mainly percussive, thus it yields more discriminative driving functions compared to those resulted from wind and bow instruments, like flute and violin. But on the other hand, defining the structure of
Javanese gamelan songs is quite tricky
theoretically. The song structure can be
distinguished by the number of lines (where a line consists of four bars) in each song part, while the song part can be differentiated from each other by observing the playing pattern of the instruments. Since each instrument group has its own pattern, thus it delivers different periodicities from the other group. This research attempts to address this problem by representing the visualization of periodicity distribution along a musical piece for rhythmic structure analysis.
3.
METHODISSN: 1992-8645 www.jatit.org E-ISSN: 1817-3195
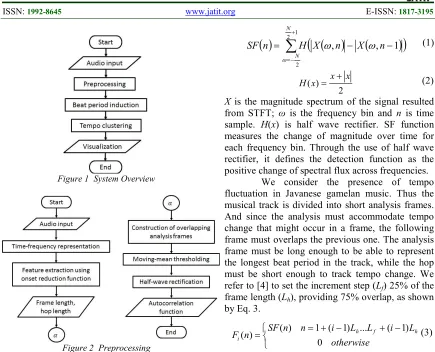
Figure 1 System Overview
Figure 2 Preprocessing
The third stage is the tempo clustering and visualization. We propose to exploit periodicity distribution to analyze the rhythmic pattern of a song. Each group of periodicities with relatively close distance in the distribution is assumed to belong to a certain instrument group. The clustering method is used to find the center of the group in order to cope with variations that exist within an
instrument group.
3.1 Preprocessing
Details on the preprocessing stage are shown in Fig.
2. The audio signals were recorded at 44100 Hz
sampling frequency and are represented in time-frequency domain using Short-time Fourier Transform (STFT). We maintain time-frequency
resolution by applying window length of 8192
samples for the Fourier Transform and hop length
of 441 samples, providing 5.4 Hz frequency
resolution and 10 ms time resolution. For feature
extraction, we use onset reduction function that has been proven to be stable with respect to frequency resolution for Javanese gamelan music [8], namely spectral flux (SF). Equation 1 and 2 show the formulation of SF function.
( )
∑
(
(
)
(
)
)
+
− =
− −
= 1 2
2
1 , ,
N
N
n X n X H n
SF
ω
ω
ω
(1)2 )
(x x x
H = + (2)
X is the magnitude spectrum of the signal resulted
from STFT; ω is the frequency bin and n is time
sample. H(x) is half wave rectifier. SF function
measures the change of magnitude over time for each frequency bin. Through the use of half wave rectifier, it defines the detection function as the positive change of spectral flux across frequencies.
We consider the presence of tempo fluctuation in Javanese gamelan music. Thus the musical track is divided into short analysis frames. And since the analysis must accommodate tempo change that might occur in a frame, the following frame must overlaps the previous one. The analysis frame must be long enough to be able to represent the longest beat period in the track, while the hop must be short enough to track tempo change. We
refer to [4] to set the increment step (Lf) 25% of the
frame length (Lh), providing 75% overlap, as shown
by Eq. 3.
= + − + −
=
otherwise
L i L L i n n SF n
Fi h f h
0
) 1 ( ... ) 1 ( 1 ) ( )
( (3)
Fi(n) is the i-th analysis frame. We apply the value
of Lh = 1024 DS and Lf = 256 DS to adapt with
Javanese gamelan music. DS stands for detection
sample, and is a unit sample of the onset detection function.
As we have mentioned in the previous section, each instrument in Javanese gamelan ensemble has its own tempo pattern. The instrument which has the longest duration between two
consecutive notes is gong, whose notations appear
at the end of a line. Since the objective of this research is to visualize the tempo cluster distribution which comes from all instruments playing in a song, then we set the length of the analysis frame to be able to present the longest beat period of instrument. A line of notation in Javanese gamelan music consists of sixteen beats, and based on our observation, the duration between two beats
is approximately 0.5 s. Thus the duration of two
gongs notes is at least 8 s. Since the resolution of 1
DS in the analysis frame is 10 ms according to
STFT settings, then the required length of the
analysis frame is at least 800 DS. We choose the
[image:3.612.88.523.70.422.2]ISSN: 1992-8645 www.jatit.org E-ISSN: 1817-3195
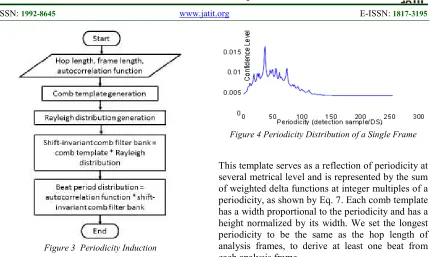
Figure 3 Periodicity Induction
From this we also set the hop length at 256 DS to reflect the period of a bar, which is one fourth of the period of a line, since a line consists of four bars.
In order to remove noisy peaks that usually appear in the onset detection signal, we apply a moving mean threshold and a half wave rectifier to the signal, as shown in eq. 4 and 5.
∑
+ − ==
2 2)
(
)
(
Q n Q n q ii
n
F
q
F
(4)))
(
)
(
(
)
(
~
n
F
n
F
H
n
F
i=
i−
i (5)Q is the length of window which is set to be 16 DS
[4]. H(x) is half wave rectifier function as
mentioned in Eq. 2. Periodicities exist in the audio signal are then enhanced using autocorrelation function described in Eq. 6.
f f L n i i i
L
l
L
l
l
n
F
n
F
l
A
f,...,
1
)
(
~
).
(
~
)
(
1=
−
−
=
∑
= (6)3.1.1 Periodicity Induction
[image:4.612.94.524.68.325.2]The autocorrelation matrix resulted from previous stage is considered as the driving function where the periodicity analysis takes place. Figure 3 shows the beat period induction based on [4]. The first step is to create a comb template.
Figure 4 Periodicity Distribution of a Single Frame
This template serves as a reflection of periodicity at several metrical level and is represented by the sum of weighted delta functions at integer multiples of a periodicity, as shown by Eq. 7. Each comb template has a width proportional to the periodicity and has a height normalized by its width. We set the longest periodicity to be the same as the hop length of analysis frames, to derive at least one beat from each analysis frame.
l
p
v
p
l
p p p vl
∑ ∑
= − − =
−
+
−
=
4 1 11
2
1
)
1
(
)
(
δ
τ
λ
(7)A Rayleigh distribution function was used as a weighting curve to approximate prior distribution of beat period hypotheses. This function has high increase for short lags while it slowly decays for longer lags after the peak. This function was selected since it prefers shorter lags to be beat periods than the longer ones.
R
(
)
e
21
,...,
L
h2 2 2
=
=
−τ
β
τ
τ
β τ (8)β is a parameter that sets the location of the peak.
Davies et al used β = 43 to represent the common
tempo of 120 bpm [4]. The product of comb
template and Rayleigh function results in a shift invariant comb filter bank, as shown in Eq. 9. Finally, this comb filter bank is used to generate beat period distribution by multiplying it with the autocorrelation functions of all analysis frames. This means that we take the dot product of the autocorrelation function of each analysis frame with each beat period hypotheses, as described in eq. 10. The output matrix represents the beat period distribution of all analysis frames.
)
(
)
(
)
,
(
l
R
l
ISSN: 1992-8645 www.jatit.org E-ISSN: 1817-3195
Figure 5 Tempo Clustering And Visualization
∑
==
f L ll
C
l
A
Y
1)
,
(
)
(
)
[image:5.612.312.529.248.463.2](
τ
τ
(10)Figure 4 depicts an example of beat period distribution of the first analysis frame of a Javanese gamelan song in database. The main difference between this paper and that of Davies et al is on the point of view on this beat period distribution. In their paper, they chose the lag which corresponds to the highest confidence level as the beat period of that particular analysis frame, which is around 40
DS in the example. They consider this chosen lag as
the beat period which is strongly contained in the song, or in another words, it is contained in all instrument notations. While in this research, we use all beat period distributions instead of choosing the most confident one. We consider that each beat period that has non-zero value of confidence level is contained in the song frame and belongs to any of the instrument notations. The following sub section describes the utilization of beat period distribution for visualization.
3.2 Clustering and Visualization
During playing musical instruments or singing a song, humans are naturally unable to follow the exact tempo repetitively. It is like when we record a person’s speech of the same utterance for several times, and we compare all the results, then we will end up by having many variations in the signals. There will always be tempo bias when humans play music as well. Some neighboring beat periods may represent variations to the reference value. Therefore we propose to use clustering algorithm to overcome this problem. We use fuzzy clustering algorithm which is capable of defining membership function for all data to each cluster based on C-Mean objective function [22]. The flow of this stage is depicted in Fig. 5. Fuzzy C-Means (FCM)
clustering algorithm is based on the minimization of fuzzy c-means functional as denoted in Eq. 11.
∑∑
= =−
=
c i N k B i k mik
z
v
V
U
Z
J
1 1 2)
(
)
,
;
(
µ
(11)Z is data, B is fuzzy subset, U is fuzzy partition
matrix which contains values of the i-th
membership function of B of Z. c is the number of
cluster, and N is the number of data. V is a vector of
cluster centers that is to be determined,.
[
]
ni
c
v
v
v
v
V
=
1,
2,...,
,
∈
ℜ
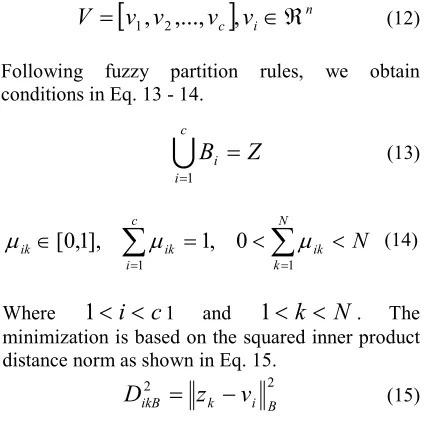
(12)Following fuzzy partition rules, we obtain conditions in Eq. 13 - 14.
U
c i iZ
B
1 ==
(13)
∑
∑
= =<
<
=
∈
N k ik c i ik ikN
1 10
,
1
],
1
,
0
[
µ
µ
µ
(14)Where
1
<
i
<
c
1 and1
<
k
<
N
. Theminimization is based on the squared inner product distance norm as shown in Eq. 15.
2 2
B i k
ikB
z
v
D
=
−
(15)The minimum point of fuzzy objective function can be obtained by taking the first derivative of Eq. 16
by setting the derivative with respect to U, V , λ to
zero.
∑ ∑
∑∑
= = = =
−
+
=
N k c i ik k c i N k ikB m ikD
V
U
Z
J
1 1 1 1 21
)
,
,
;
(
µ
λ
µ
λ
(16)That is when these following conditions are met.
∑
= −
=
c i m jkB ikB ikD
D
1 ) 1 ( 21
[image:5.612.333.522.531.584.2]ISSN: 1992-8645 www.jatit.org E-ISSN: 1817-3195
∑
∑
= =
=
Nk m ik N
k
k m ik
i
z
v
1 1
µ
µ
(18)
The cluster center vi is determined by
taking a weighted mean of data that belongs to
cluster i, using the membership degrees of data to
the cluster as the weights. The membership degree may vary from zero to one, providing a soft clustering, where each datum may have probability to belong to more than one cluster. The algorithm was used to cluster the confidence level of beat period hypotheses. The clustering is performed in two dimension space, where the first axis is the beat period and the second axis is the confidence level. We assume that there is no outlier since the data are of time series.
4.
EXPERIMENTSDataset containing thirty Javanese gamelan songs is provided for experiments. It consists of three song
structures categorized as gendhing alit in Javanese
gamelan music, which are lancaran, ladrang, and
ketawang. The songs contain multiple instrument sounds, including singer voices. There are three experiments carried out in this research. The first experiment aimed to compare two settings of analysis frame length and hop length. Figure 6 shows the results. The second experiment investigates the suitable number of periodicity cluster to represent instrument groups, and it is depicted in Fig. 7. While Fig. 8 – 10 show the results of the third experiment, which is the analysis of song structure of Javanese gamelan music contained in dataset.
We conducted first experiment with two different parameter settings, which are analysis frame length and hop length. First, we adopted the
setting of [4], using 512 DS analysis frame and 128
DS hop length. We compare the results with those
of our setting which is based on the characteristic of Javanese gamelan music. We have mentioned in previous section, that in order to adjust the frame length to the beat period of gong, we need to set it to the length of a line in Javanese gamelan music,
that is 1024 DS approximately. Since a line in
Javanese gamelan music consists of four bars, we also set the beat period hypotheses to be up to 256
DS.
(a) Side view of periodicity distribution
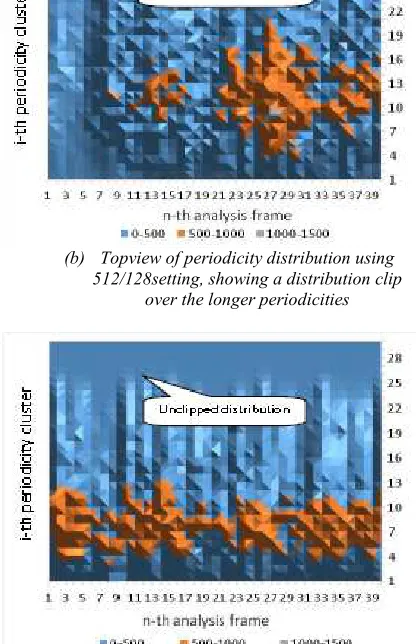
(b) Topview of periodicity distribution using
512/128setting, showing a distribution clip over the longer periodicities
[image:6.612.312.520.300.622.2](c) Top view of periodicity distribution using 1024/256 setting, showing unclipped distribution
ISSN: 1992-8645 www.jatit.org E-ISSN: 1817-3195
(a) Visualization with 10 Periodicity Clusters
[image:7.612.90.298.70.400.2](b) Visualization with30 Periodicity Clusters
Figure 7 Comparisons on the Number of Clusters
And in order to derive at least one beat per frame, the number of beat period hypotheses must be equal with the hop length. The upper graph in Fig 6 represents periodicity distribution using 512/128 setting while the lower one represents periodicity distribution using 1024/256 setting. Using the first setting, the long periodicities (the upper part of distribution) seems to get clipped. While using the
second setting, the distribution shows all
periodicities contained in each frame and it is indicated by the zero value of confidence levels in the upper part of the graph.
Figure 6(a) shows visualization of periodicity distribution along the track observed from side view. Figure 6(b) and fig. 6(c) observe periodicity distribution of the song from top view in order to compare the distribution using general
setting (512/128) and customized setting
(1024/256). The lower side of the graph represents faster periodicity while the upper side represents longer periodicity. Using the first setting, we obtain larger number of analysis frames and for the reason of clarity; we present the first half of the frames in the graph. From both graphs we conclude that the general setting is not suitable for Javanese gamelan music since it caused distribution clip that does not
allow periodicities larger than 128 DS to appear,
which actually present in Javanese gamelan music. Therefore we used the customized setting to visualize periodicity distributions in the following experiments. The clip no longer appears when we enlarged the frame length and hop length according to our previous calculation.
The clustering process is conducted to address too many periodicity variations caused by humans while playing the instruments. But on the other side, the less number of clusters we determine, the more information loss we get. The second reason of clustering is to represent the periodicity of an instrument group through the center of each cluster. Upon deciding the optimum number of periodicity cluster, we consider the number of instrument groups that may present in an orchestra. In total, there are about ten instrument groups in a complete gamelan set [23]. Each group can be divided into two or three small groups, so a complete set may have almost thirty instrument groups. Figure 7 depicts a comparison between visualization with 10 clusters and that with 30
clusters. Figure 7(a) represents periodicity
distribution with more information loss compared to that of Fig. 7(b). This can be seen from the pattern of dominant periodicities which are marked
by orange, grey and yellow colors. Figure 7 has
detailed shape of these colors which may help analyzing the pattern of periodicity in a song. Therefore, we chose to set the number of cluster to be thirty, so that each cluster may consists of 8-9 periodicity variations from the total of 256 periodicity hypotheses.
The third experiment was carried out on a dataset of thirty Javanese gamelan songs, that consists of three types of song structure, which are
lancaran, ladrang, and ketawang. Figure 8 - 10 show representatives of each song structure in dataset. There are four features of interest that we would present from the visualization, which are the width of distribution, the average height of distribution, the pattern of dominant periodicities, and the value of tempo (periodicity with highest level of confidence) and its fluctuation along the track. The following section explains each of the features and how it can be used to analyze the structure of a Javanese gamelan song, as well as discusses the analysis of the experiment results.
5.
DISCUSSIONEach of Javanese gamelan song structure has typical characteristic that can be seen from the
ISSN: 1992-8645 www.jatit.org E-ISSN: 1817-3195 their positions in a notation [2, 23]. Unfortunately,
detecting the sounds of these instruments is very difficult due to low signal amplitude compared to those of other instruments. Nevertheless, gamelan experts and practitioners are able to recognize the song structure and distinguish it from the other ones by listening to the song, without having the notation. Therefore we propose to present a visualization of periodicity distribution and to exploit some of its features as a mean of analysis of Javanese gamelan song structures.
For analysis purpose, we tested the normality of the visualization of periodicity distributions of all songs in our database. Based on the central limit theorem, as the number of sample drawn from a population is getting large, while the variance of the sample distribution is finite, the distribution of the average of the random sample
will be approaching normal [24]. We used Lilliefors
for normality test, which is suitable for condition where the parameters of hypothesized distribution are not completely known [25]. The null hypothesis is that the periodicity distribution of all frames is a
normal distribution. The result is a logical value h,
which can be 0 that accept the null hypothesis, or it
can be 1 that rejects the null hypothesis, at 5% significance level. The results proof that all songs have non normal distribution, as indicated by four variables, test result, h = 1; p-value, p = 0; and the value of test statistics is greater than that of critical value. There is high non linearity in the signals which makes the analysis much more complex and therefore we propose a visualization approach for song structure analysis of Javanese gamelan music.
Analyzing the song structure of Javanese gamelan music based on periodicity distribution, brings us back to the above-mentioned features that present in the visualization. The first feature is the width of distribution. The term width refers to the periodicity clusters which have significant value. We take an average value of confidence level for each cluster along the track. The significance of the value of each cluster is determined by a threshold. The clusters whose values are below the threshold are considered as insignificant.
The width of a distribution is the number of significant clusters. The threshold is calculated by following Eq. 19.
(a) Periodicity Distribution of Kebo Giro
[image:8.612.91.513.390.712.2]ISSN: 1992-8645 www.jatit.org E-ISSN: 1817-3195
∑∑
= =
=
Tt S
s
s
t
Y
TS
1 1)
,
(
α
φ
(19)Y (t,s) is the periodicity distribution, where t is periodicity cluster, s is analysis frame, 0 < α < 1. Wider distribution means the song contains more various periodicity contents. Since different instrument generates different periodicity, wider distribution represents more number of instruments than that of the narrower one. Songs which fall into
lancaran structure have vibrant and flowing rhythm. This dynamic impression is built by the involvement of many instruments and by the relatively fast and flat tempo. That is why songs of this structure are usually put at the opening of events or ceremonies. By figuring out the width of periodicity distribution, we may expect to which structure the song has a closer relation with.
The second feature is the average height of periodicity distribution. This feature depends on the magnitude of time-frequency representation of audio signal. It is affected by the number of instruments and the playing style, both of which contribute to the loudness of sound. Louder sound may imply higher passion and therefore songs with
louder sound may relate to lancaran structure. The
height of confidence level in the visualization is shown in the legend of each graph.
Dominant periodicities are marked by different colors in the visualization, which are orange, grey and yellow colors. We categorize the pattern of dominant periodicities into sparse or dense, and short or long. Please note that this is the only feature that is not numerically quantized, but is visually perceived.
The last feature is based on the value of tempo and its fluctuation along the track. We will present two graphs for this feature, one that shows the fluctuation of tempo value, and one that shows the fluctuation of tempo loudness that is represented by the confidence level. From these two graphs, we analyze the change of the most confident periodicity cluster that may indicate song part transition and furthermore, may imply the rhythmic pattern of the song.
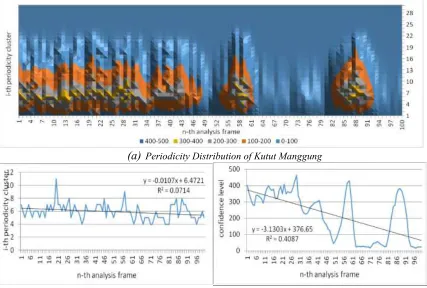
We present in Fig. 8 - Fig. 10 three periodicity distributions of Javanese gamelan songs,
each of which represents lancaran, ladrang, and
ketawang song structures respectively. Each periodicity distribution is supported by two charts showing the fluctuation of the most dominant periodicity (also known as tempo), and the fluctuation of tempo loudness along the track. In
(a)
Periodicity Distribution of Kutut Manggung [image:9.612.90.517.416.704.2]ISSN: 1992-8645 www.jatit.org E-ISSN: 1817-3195 each chart we compare the fluctuation with a
regression line to show the trend and we also put the equation of the line. From all analysis frames in a song, we only present one hundred consecutive analysis frames whose periodicity distribution represents the rhythmic structure of the song for the reason of clarity.
Figure 8 depicts an example of lancaran
song structure, which is Kebo Giro. Based on
calculation using Eq. 21, we obtained distribution
width of 23 clusters. While the other lancaran
songs in dataset may have distribution width in the range of 22-24 clusters. The average height of distribution is 242, while the maximum height is almost 2000 (Fig. 8(c)). Dominant periodicities are dense in the first twenty analysis frames, but they are getting sparser afterwards, as shown in Fig. 8(a). By observing Fig. 8(b) we could notice that the tempo fluctuates from 4 to 12 but it maintains constant trend (increasing with small gradient of 0.004), while the loudness of tempo is decreasing (Fig. 8(c)). We could conclude that the playing style was strong at the beginning but then it was getting softer to the end, producing more sparse distribution and lower confidence level of tempo. However, this condition does not indicate song part transisition
and it is supported by the fact that Kebo Giro is in
the type of lancaran nibani. Lancaran nibani in this
case, maintains the rhythmic pattern until the end of the song since it usually consists of one song part (part A) which is played repetitively.
Ladrang song structure has relatively narrower periodicity distribution in each analysis frame, as shown in Fig. 9 with distribution width of 21 clusters. Figure 9(a) is a visualization of
periodicity distribution of Kutut Manggung, whose
average height of distribution is 69.6. We could see from the distribution that the values of width and
average height of ladrang example are less than
those of lancaran example. We may conclude from
these facts that the number of instruments played in the first structure is less than that in the second structure. This supports softer impression that arises
from ladrang songs generally [3]. Dominant
periodicities are dense but are not continuous along the song. The discontinuity of the pattern indicates song part transitions, while the density of dominant periodicities indicates the density of notation pattern, where note appears at almost every beat in the song [2].
(a) Periodicity Distribution of Ibu Pertiwi
[image:10.612.90.512.400.708.2]ISSN: 1992-8645 www.jatit.org E-ISSN: 1817-3195
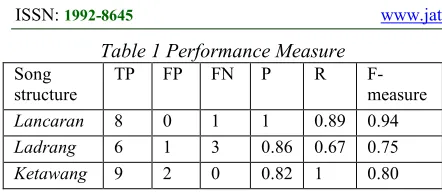
Table 1 Performance Measure
Song structure
TP FP FN P R
F-measure
Lancaran 8 0 1 1 0.89 0.94
Ladrang 6 1 3 0.86 0.67 0.75
Ketawang 9 2 0 0.82 1 0.80
Song transitions are also depicted by the drops of tempo loudness in Fig. 9(c). The trend of tempo fluctuation decreases as shown by negative gradient of linear equation in Fig. 9(b). This means that tempo gets faster to the end (shorter periodicity implies faster tempo).
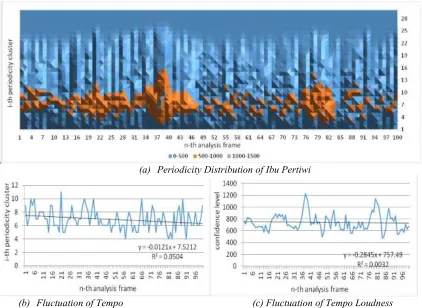
An example of ketawang song structure is
represented in Fig. 10, which is Ibu Pertiwi. The
periodicity distribution is 23 cluster width and has an average height of 194.7. Compared to the
abovementioned structures, ketawang has relatively
similar variation of periodicity contents as
lancaran, which is implied by the same distribution
width. But ketawang has softer playing style than
that of lancaran, as shown by smaller value of
average height of distribution. Visually, we can observe from Fig. 10(a) that dominant periodocities (marked by orange color) are dense during the first 50 frames, but they become sparse during the rest frames. This change of pattern indicates song part transitions, although the appearance is not as clear
as that of ladrang. The trend line of tempo
fluctuation is decreasing, as depicted by Fig. 10(b), showing that tempo gets faster to the end of the song. While the loudness of tempo shows a constant trend (Fig. 10(c)), with two big peaks indicating song part transitions.
Performance is measured for each type of song structure. The evaluation is based on the value of precision (P) and recall (R) which is called F −
measure, as explained by eq. 22 - 24.
FP
TP
TP
P
+
=
(20)
FN
TP
TP
R
+
=
(21)
R
P
PR
measure
F
+
=
−
2
(22)
TP or true positive represents correctly identified
song structure, FP or false positive represents
incorrectly identified song structure, and FN or true
negative represents incorrectly rejected song structure. Thus, precision represents how good the identification is. And recall represents how good is the features of periodicity distribution. Table 1 shows the overall results. The best performance is
obtained by lancaran with F −measure of 0.94. It is
followed by ketawang and ladrang with F −
measure of 0.90 and 0.75 respectively. The highest
precision value is obtained by lancaran, while the
highest recall value is obtained by ketawang. From
these results we may conclude that this method is
most confident to identify lancaran song structure,
but on the other side this method is most sensitive
to identify ketawang song structure. These results
are supported by the fact that the features of
periodicity distribution belong to lancaran are more
discriminative than those of other song structures.
6.
CONCLUSIONSWe have presented a method of analyzing song structure of Javanese gamelan music based on visualization of periodicity distribution. The existence of non-linearity in the audio signals has been proofed using Lilliefors test of normality. Therefore we propose to utilize some visual features in tempo distribution to make inferences regarding the song structure of Javanese gamelan music. We conclude that there are features of periodicity distribution from which we may use to distinguish the structure of a Javanese gamelan song. Although the analysis in this research is mainly qualitative and visually perceived, these results are useful for our future research. We may implement a classification of Javanese gamelan song structure based on these features, using one of machine learning techniques. We also note that in order to obtain convergent results, we need to improve our data selection, for example the quality of recording. We found that there are data which are quite noisy, and the analysis on the periodicity distributions of these data is misleading. The other important rule is to make sure that the songs are of classical type. This will guarantee that we obtain clear and discriminative rhythmic patterns.
REFERENCES:
[1] Wardono, Soewondo, Teori Karawitan Jawa.
Madiun, Indonesia: Warga (1984).
[2] Palgunadi, B. Karawitan Jawi, Bandung,
Indonesia: Penerbit ITB (2002).
[3] Supanggah, R. Bothekan Karawitan II: Garap,
Solo, Indonesia: ISI Press Surakarta (2009).
[4] Davies, M. E. P., Plumbley, M. D.,
”Context-dependent beat tracking of musical audio”,
ISSN: 1992-8645 www.jatit.org E-ISSN: 1817-3195
[5] Suprapto, Y. K., Wulandari, D. P., and
Tjahyanto, A., ”Saron music transcription
using LPF-cross correlation”, Journal of
Theoretical and Applied Information Technology, 32, 71-79 (2011).
[6] Suprapto, Y. K., Hariadi, M., and Purnomo, M.
H., ”Traditional Music Sound Extraction Based on Spectral Density Model using Adaptive Cross-correlation for Automatic
Transcription”, IAENG International Journal
of Computer Science, 38, 1-8 (2011).
[7] Suprapto, Y. K. ”Spectral Density Based on
Phase Shifting for Music Notation.” Jurnal
Ilmiah Kursor, 6, 139-146 (2012).
[8] Wulandari, D. P., Tjahyanto, A., and Suprapto,
Y. K., ”Gamelan Music Onset Detection based
on Spectral Features”. Telkomnika, 11, 107118
(2013).
[9] Wulandari, D.P., Suprapto, Y.K., and
Purnomo, M.H., Gamelan music onset
detection using Elman Network, IEEE International Conference on Computational Intelligence for Measurement Systems and Applications (CIMSA), 9196 (2012).
[10]Wulandari, D. P., Suprapto, Y. K., and
Tjahyanto, A., Saron transcription based on
time-frequency analysis of onset detection using Short-time Fourier Transform, Proceedings of International Conference and Workshop on Basic and Applied Sciences (ICOWOBAS), (2011).
[11]Suprapto, Y. K., Purnomo, M. H.,
and Hariadi, M., ”Segmentation of Identical and Simultaneously Played Traditional Music
Instruments using Adaptive”, IPTEK The
Journal of Technology and Science, 20, 8892 (2009).
[12]Wintarti, A., Suprapto, Y. K., and Wirawan,
”Independence test of gamelan instrument signal in time domain and frequency domain”.
Jurnal Ilmiah Kursor, 7, 47-54 (2013).
[13]Tjahyanto, A., Suprapto, Y. K., and
Wulandari, D. P., ”Spectral-based Features
Ranking for Gamelan Instruments
Identification using Filter Techniques”.
Telkomnika, 11, 95-106 (2013).
[14]Tjahyanto, A., Suprapto, Y. K., Purnomo, M.
H., and Wulandari, D. P., FFT-based features
selection for Javanese music note and instrument identification using support vector machines, IEEE International Conference on
Computer Science and Automation
Engineering (CSAE), 439-443 (2012).
[15]Wulandari, D. P., Tjahyanto, A., Suprapto, Y.
K., Sudarma, M., Beat-tracking of Javanese
Gamelan Musical Audio based on Comb Filter Resonator, Seminar on Intelligent Technology and Its Applications (SITIA), (2014).
[16]Klapuri, A., Davy, M., Signal Processing
Methods for Music Transcription, Springer, (2006).
[17]Talkin, D., ”A robust algorithm for pitch
tracking”, Speech Coding and Synthesis,
Amsterdam: Elsevier Academic Press, 495-517 (1995).
[18]de Cheveign´e, A., Kawahara, H., ”YIN, a
fundamental frequency estimator for speech
and music”, Journal of the Acoustical Society
of America, 111, 1917-1930 (2002).
[19]Lahat, M., Niederjohn, R., and Krubsack, D.,
”A spectral autocorrelation method for measurement of the fundamental frequency of
noise-corrupted speech.” IEEE Transactions
on Acoustics, Speech and Signal Processing, 35, 741-750 (1987).
[20]Kunieda, N., Shimamura, T., and Suzuki, J.,
Robust method of measurement of fundamental frequency by ACLOS: autocorrelation of log spectrum, IEEE International Conference on
Acoustics, Speech, and Signal Processing, 1,
232-235 (1996).
[21]McKinney, M. F., Moelants, D., Davies, M. E.
P., Klapuri, A., ”Evaluation of audio beat
tracking and music tempo extraction
algorithms.” Journal of New Music Research,
36, 1-16 (2007).
[22]Bezdek, J. C., Ehrlich, R., Full, W., ”FCM:
The fuzzy c-means clustering algorithm.”
Computers & Geosciences, 10, 191-203 (1984).
[23]Sumarsam. Gamelan: cultural interaction and
ISSN: 1992-8645 www.jatit.org E-ISSN: 1817-3195
[24]DeGroot, M.H., Schervish, M.J., Probability
and statistics, Boston: Pearson Education Inc., 893 (2012).
[25]Razali, N. M., Wah, Y. B., and Sciences, M.,
”Power comparisons of Shapiro-Wilk,
Kolmogorov-Smirnov, Lilliefors and
Anderson-Darling tests”, Journal of Statistical