Developing a Scale for Perceptions of Competency in
Teaching Quality
Guntay Tasci
1,*, Burcu Atar
21Department of Elementary Education, Erzincan University, Turkey 2Department of Educational Sciences, Hacettepe University, Turkey
Copyright©2016 by authors, all rights reserved. Authors agree that this article remains permanently open access under the terms of the Creative Commons Attribution License 4.0 International License
Abstract
The purpose of this study was to develop a measurement instrument for determining pre-service teachers’ perceptions of competency in providing quality teaching. The initial phase of the instrument was consisted of 54 items that were composed based on theory and literature. The initial form was applied to 232 pre-service teachers. An exploratory factor analysis (EFA) was conducted on the data obtained from those students. The results of EFA showed that the scale has 5-factor construct with 30 items. In order to obtain evidence of construct validity for 5-factor scale, a confirmatory factor analysis (CFA) was conducted for the data collected from another group of 617 pre-service teachers. Regarding the fit indices and the modification indices obtained from the CFA, the final form was constructed. Cronbach’s alpha and McDonald’s omega reliability coefficients were calculated as approximately 0.931 and 0.953, respectively in the final form with 22 items. Based on the findings, it can be concluded that the scale developed is capable of exhibiting pre-service teachers’ perceptions of self-competency in providing quality teaching in a valid and reliable manner.Keywords
Pre-service Teacher, Perception ofCompetency in Teaching Quality, Scale Development
1. Introduction
Teaching is understood as learning and teaching situations, planned by teachers in accordance with certain goals in temporal integrity, and is considered as the whole of didactic activities orientated to learning and education in the framework of an institution’s special condition [1]. Based on this definition, the concept of teaching quality is employed in a broad sense of the totality of teaching properties influential in the pre-set normative objectives [2, 3]. On viewing the definitions and research traditions of teaching quality, it is found that the acceptable and indispensable basic factors of teaching are teachers, teaching process (lessons), and
learners. Setting out from this fact, research on teaching quality makes efforts to reveal the properties of good teaching by considering constantly the changing scientific focus. In accordance with our purposes, a great number of isolated variables described in meta-analysis studies in research into teaching quality were brought together, and attempts were made to determine and to describe the properties of high quality teaching [4, 5]. While the principles established through these efforts were initially discussed independently - that is to say, discussed as general teaching quality; now it is emphasized that the domain-specific combinations of properties related to teaching quality as well as the complicated interactions of teaching quality with specific variables should also be considered [1, 4]. In this context, criteria were set and described for teaching quality by Brophy [5], and Helmke [1, 6], Meyer [7], Seidel and Schavelson [8].
Helmke [6] stresses that positive learning environments develop positive attitudes towards learning and facilitate the process of learning. It is thought that supportive learning atmosphere - which is considered as the affective side of teacher - student relations - has great importance in students’ adjustment, readiness, motivation, interests and in self-reliance. Structuring the length of teaching time is understood as the didactic design of teaching, whereas cognitive structuring is understood as setting up associations between new knowledge and prior knowledge, and thus forming a well regulated cognitive structure in learners. Helmke sees recommendations which facilitate directed learning as the criteria for didactic structuring. Didactic structuring or division of teaching, and ordering it in this sense requires carefully planned lessons. Another criterion for quality is known as content clarity. To attain such clarity, it is recommended that the pieces of content be summarized by using pictures, graphs and examples, that various forms of representation be employed in combination, and that explanation made be varied. Teaching methods and techniques, which are also seen as the use of diverse forms of representation, contribute to the clarity of content [6, 7]. The activation of cognition, and rehearsal, on the other hand, are important quality criterion in teaching. They are important in the process of practicing through exercises, in the process of re-learning, and in the process of acquiring knowledge. As a result, they also play important roles in teaching. In general, it is regarded that exercises and revisions contribute to developing our skills at least partially.
This study aims to develop a tool for measuring the perceptions of competency in teaching quality. Therefore “the perceptions of competency in teaching quality” was operationally described. This description was thought as pre-service teachers’ perception of competency in meeting the teaching quality standards in teaching that were listed in Table 1 and explained in the introduction part. The tool of measurement is based on the fundamental quality criterion evaluated and integrated with relevant literature, and on the quality criterion framework. The scale aims to determine pre-service teachers’ perceptions of their own competency in attaining the criteria for quality teaching in the teaching process.
2. Methods
2.1. Instrument
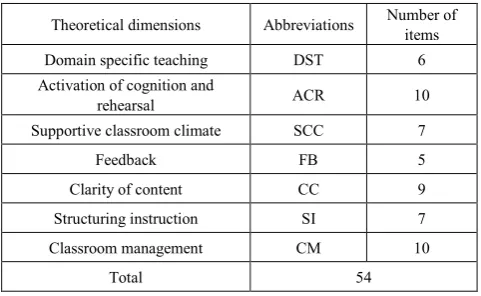
Initially, a theoretical framework was constructed based on the literature in writing the items for the measurement tool to be developed in order to measure our operational definition of the perceptions of competency in teaching quality. Internationally accepted criteria for teaching quality were determined and described at this stage [1, 5, 7, 8]. Next, enough number of items were written for each dimension determined in the scale. The number of items for each theoretical dimension is shown in Table 1. Two experts, one
[image:2.595.312.553.185.333.2]of whom was a measurement and evaluation specialist holding a Ph. D. degree and the other of whom was an educator were asked for expert opinions in relation to the suitability and adequacy of the written items according to the dimensions identified. Thus, the content validity of the items written was achieved by obtaining expert opinions beside receiving support from the literature.
Table 1. The number of items for theoretical dimensions
Theoretical dimensions Abbreviations Number of items Domain specific teaching DST 6 Activation of cognition and
rehearsal ACR 10
Supportive classroom climate SCC 7
Feedback FB 5
Clarity of content CC 9 Structuring instruction SI 7 Classroom management CM 10
Total 54
In addition to expert opinions, a language expert was also asked to analyze the items in terms of grammar. It was pointed out by experts that the number of 54 items formed in this way was too many and that some of the items were similar in meaning. Also in consequence of statistical work performed, it was concluded to reduce the number of 54 items, and thus a 5-pointed Likert type (ranging between I absolutely disagree and I absolutely agree) trial scale was formed. The items in the form were presented as a common item premise for ease of reading. Statements of competency written for differing components of teaching quality were presented in the pattern:
“I consider myself competent in the skill of ………”, and it was aimed to measure pre-service teachers’ perceptions of differing criteria for teaching quality. The form contained an introductory part, a questionnaire part for demographic properties, and the scale items. At the beginning of the items, a short explanation was offered stating that each item should be read and answered in the pattern given.
2.2. Sample
Data were collected from a total of 849 pre-service teachers so as to test the construct validity of the 54-item trial scale. At the first stage of data collection, data were collected from a group of 232 pre-service teachers for exploratory factor analysis (EFA) whereas data were collected from 617 pre-service teachers through Confirmatory factor analysis (CFA) at the second stage so as to confirm the factor structure determined through EFA.
2.2.1. Sample I
departments and universities of study. It is evident from the Table that the study group includes pre-service teachers of two differing grade levels and from two different Universities. Approximately 67% of the participants (156 pre-service teachers) were female while 32% of them (75 pre-service teachers) were male.
Table 2. Demographic Properties of Participants in Study I
f % f %
Grade
levels Departments
1st year 36 16 Elementary school teaching 103 44 2nd year 34 15 Science teaching 97 42 3rd year 94 41 Biology teaching 31 13 Final year
(4th or 5th
year) 64 28 Universities
Erzincan University 201 87 Hacettepe University 30 13
2.2.2. Sample II
617 pre-service teachers were reached for CFA. Approximately 74% of the pre-service teachers (458 pre-service teachers) were female, whereas 24% of them (149 teacher candidates) were female. Descriptive information concerning the group of pre-service teachers is shown in Table 3.
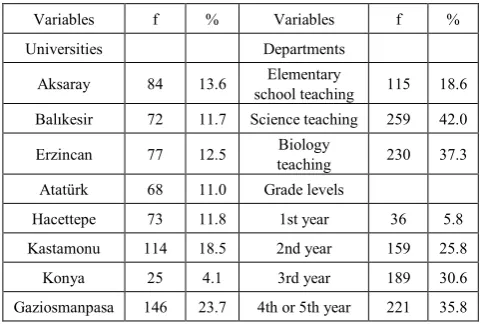
Table 3. Demographic Properties of Participants in Study II Variables f % Variables f % Universities Departments
Aksaray 84 13.6 school teaching Elementary 115 18.6
Balıkesir 72 11.7 Science teaching 259 42.0 Erzincan 77 12.5 teaching Biology 230 37.3
Atatürk 68 11.0 Grade levels
Hacettepe 73 11.8 1st year 36 5.8 Kastamonu 114 18.5 2nd year 159 25.8
Konya 25 4.1 3rd year 189 30.6 Gaziosmanpasa 146 23.7 4th or 5th year 221 35.8
As is clear from Table 3, teacher candidates were chosen from eight different state universities. Elementary school teaching, science teaching, and biology teaching
departments of eight universities located in different geographical regions in Turkey were chosen for our purposes. It is clear from the Table that the majority of the participants are the second, third and fourth year students of the universities. Accordingly, almost a quarter of the participants are male, and three thirds are female students.
2.3. Data Analyses
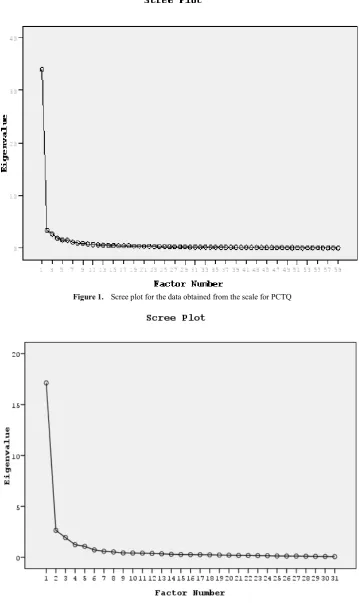
The data obtained by applying the initial form of the scale to sample one was analyzed with exploratory factor analysis using SPSS 19 program using unweighted least square estimation method and promax rotation. Firstly, the scree plot formed by taking eigenvalue as 1 was examined, and the potential number of factors was determined. Analyses conducted for factors of differing numbers were evaluated, and the number of factors in which items were in the best combination meaningfully was decided on. At this stage, reliability was estimated during Cronbach’s Alpha coefficients, which is called internal consistency method for reliability for the overall scale and for the factors of the scale. In order to confirm the factor structure determined through EFA, CFA was performed on the second sample, and thus the factor structure of the scale was tested. The convergent and discriminant validities of the scale obtained were by calculating AVE values and their square roots. Construct reliability (McDonald’s Omega), which fitted the data set for congeneric measurements and which was calculated with the standardized path coefficients of items and with error terms, and Cronbach’s Alpha coefficients to represent internal consistency were calculated.
3. Results
3.1. Study I
[image:3.595.61.293.169.340.2] [image:3.595.57.298.437.599.2]Figure 1. Scree plot for the data obtained from the scale for PCTQ
Figure 2. Scree Plot Derived from the Scale for Perceptions of Teaching Quality
Although the results for exploratory factor analysis indicated a single dimensional structure, the scale was composed of different components. Cronbach’s Alpha
reliability coefficient α for this state of the scale was found to
[image:4.595.122.483.87.384.2]items in a manner so as to preserve the theoretical structure of the scale. Thus, 24 items with the lowest factor loading, which were similar in meaning and which formed more than one factor loading above .30 were removed from the scale. In this way, it was aimed to form an effective instrument by selecting and including the items which were short enough to apply and which were suitable in terms of discriminating power and reliability. After that, the repeated scree plot for exploratory factor analysis is shown in Figure 2.
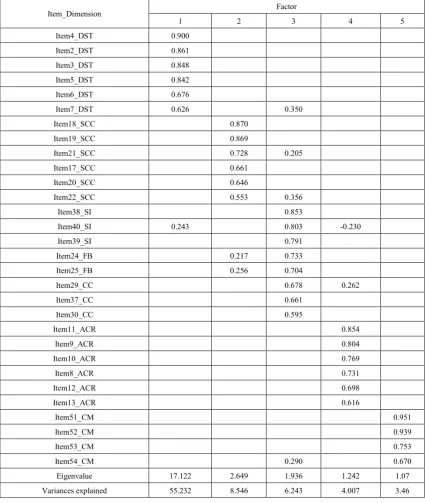
It is clear from the figure that the scree plot continues in the horizontal trend beginning with factor 5. On examining this closely in Table 4, it is found that a 5-factor structure with eigenvalue bigger than one is formed. These factors emerging explain approximately 73% of the total variance. While factor one alone explains 54% of the total variance, all the other factors explain the proportion ranging between 3% and 8%. The factor loadings of the items for factors formed through Promax rotation are also shown in Table 4.
Table 4. Factor Loadings
Item_Dimension Factor
1 2 3 4 5
Item4_DST 0.900 Item2_DST 0.861 Item3_DST 0.848 Item5_DST 0.842 Item6_DST 0.676
Item7_DST 0.626 0.350
Item18_SCC 0.870
Item19_SCC 0.869
Item21_SCC 0.728 0.205
Item17_SCC 0.661
Item20_SCC 0.646
Item22_SCC 0.553 0.356
Item38_SI 0.853
Item40_SI 0.243 0.803 -0.230
Item39_SI 0.791
Item24_FB 0.217 0.733
Item25_FB 0.256 0.704
Item29_CC 0.678 0.262
Item37_CC 0.661
Item30_CC 0.595
Item11_ACR 0.854
Item9_ACR 0.804
Item10_ACR 0.769
Item8_ACR 0.731
Item12_ACR 0.698
Item13_ACR 0.616
Item51_CM 0.951
Item52_CM 0.939
Item53_CM 0.753
Item54_CM 0.290 0.670
[image:5.595.92.518.217.721.2]A close examination of the factor loadings makes it clear that the factor loadings of the items range between .553 and .951 in their own factors; which implies a strong construct validity. Despite this, some of the items were found to have factor loadings between .205 and .350 in more than one factor. The results for exploratory factor analysis repeated by removing 24 items from the items pool signals a 5-factor structure. On examining the items under this heading, it is found that all of the structures determined in this framework are included. The strong ones of the items related to three different structures – namely, structuring instruction (SI), feedback (FB), and clarity of content (CC) – were gathered on the same dimension. It is also possible to combine these dimensions under the dimension of structuring instruction in terms of relevant literature. The correlations between the factors were seen to range between 0.403 and 0.714. Consequently, it was decided to work with the 5-factor structure obtained by making evaluations along with these values.
3.2. Study II
The 5-factor structure obtained with EFA which was applied to the item pool prepared on the basis of literature was tested with CFA. Three different models were formed for this. Of these models, the first one was the single factor model assuming that 30 items had one factor; the second one was the uncorrelated model based on the assumption that the 5 factors formed with EFA results were separate structures, and the third one was the relational model based on the assumption that the items formed a 5-factor structure. The path diagrams for these three models were analyzed on the LISREL 8.8 program. The model data fit indices found with these models are shown in Table 5. According to the Table, it is clear that goodness of fit indices is not at acceptable levels for one-factor model and unrelated model whereas the indices are acceptable for the correlated model.
Therefore, the five-factor structure of the scale was accepted and the modifications to the model were checked afterwards. Accordingly, 2 (Item2_DST), 6 (Item7_DST), 12 (Item22_SCC), 13 (Item38_SI), 15 (Item39_SI), 20
(Item30_CC), 25 (Item12_ACR) and 26 (Item13_ACR) items yield high correlations with other factors and with error variances. As a result of repeating the analyses after removing the items, it was found that the fit indices were improved and that they reached acceptable or perfect fit
levels [(χ2 (197, N=512) = 569.35 p< .000, χ2/df = 2.9,
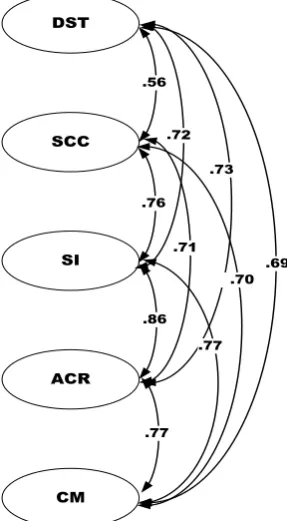
RMSEA = 0.057, GFI = 0.90, CFI = 0.98, NNFI = 0.98, NFI = 0.97]. The connection diagram prepared as a result of the analyses is shown in Figure 3 along with standardized path coefficients. In Table 7, it is seen that factor loadings in relation to these factors range between 0.60 and 0.77. On examining the covariances between factors, it was found that the lowest level of relation was between domain specific teaching and supportive classroom climate (0.56), and that the highest relation was between structuring instruction and activation of cognition and rehearsal (0.86).
DST
SCC
SI
ACR
CM
.56
.76
.86
.77 .73
.71
.77 .72
[image:6.595.356.500.283.544.2].70 .69
Figure 3. First Order CFA connection diagram
Table 5. CFA Fit Indices for the Models
Fit indices Perfect fit Acceptable fit One-factor model Uncorrelated model Correlated model
χ2/sd χ2/sd<3 3< χ2/sd<5 6.30 9.98 4.33
RMSEA 0< RMSEA <0.05 0.05< RMSEA <0.08 0.010 0.123 0.075
CFI 0.95≤CFI≤1 0.90<CFI<0.95 0.95 0.92 0.97
SRMR 0≤SRMR≤0.05 0.05<SRMR≤0.1 0.0064 0.054 0.041
Table 6. Descriptive Statistics for sub-dimensions, correlations between dimensions, and square roots of AVE
[1] [2] [3] [4] [5] M SD AVE
DST [1] 0.80* 15.93 2.97 0.63
SCC [2] 0.56 0.77* 21.58 3.87 0.60
SI [3] 0.72 0.76 0.87* 29.14 4.91 0.78
[image:6.595.91.521.677.749.2]Then the AVE (average variance extracted) values and the square roots of the AVE values were calculated. The findings are shown in Table 6.
According to the Table, the square roots of the AVE values are bigger than the values of correlations with other dimensions. This situation is thought to be evidence for discriminant validity. On the other hand, it is clear that the average variances explained (AVE) for latent variables as evidence for convergent validity are seen to be bigger than .50. This is considered to be evidence for convergent validity. So as to demonstrate that the five sub-dimensions revealed through confirmatory factor analysis represent the belief in teaching quality which was announced in the original form of the scale, the structural relations of the five dimensions with upper order variables were tested with second order confirmatory factor analysis. For these purposes, second order PCTQ latent variable was added to
the connection diagram, and thus analyses were done [(χ2
(225, N=512) = 753.05 p< .000, χ2/df = 3.34, RMSEA = 0.063, GFI = 0.90, CFI = 0.98, NNFI = 0.97, NFI = 0.97 ].
On examining the factor loadings between first order latent variables and belief in competency in teaching quality, it was found that activation of cognition and rehearsal (β = 0.95, t = 18.06, p < .05), structuring instruction (β = 0.93, t = 15.72, p < .05), and classroom management (β = 0.91, t = 17.37, p
< .05 ) were the strongest components. Supportive classroom
climate (β = 0.79, t = 15.57, p < .05 ) and domain specific
teaching (β = 0.77, t = 12.69, p < .05) were, on the other hand,
lower yet strong components. These components, which are described as criteria for teaching quality, were also statistically verified in this sample.
3.3. Reliability
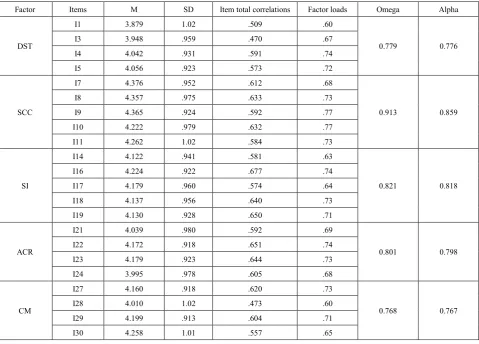
Cronbach’s Alpha for the whole scale was calculated approximately as 0.953. The values for the factors are shown in Table 7. As can be seen in the Table, total item correlations in the scale are bigger than .30 and range between .470 and .651.
Table 7. Reliability for the Factors, and Descriptive Statistics of the Items
Factor Items M SD Item total correlations Factor loads Omega Alpha
DST
I1 3.879 1.02 .509 .60
0.779 0.776
I3 3.948 .959 .470 .67
I4 4.042 .931 .591 .74
I5 4.056 .923 .573 .72
SCC
I7 4.376 .952 .612 .68
0.913 0.859
I8 4.357 .975 .633 .73
I9 4.365 .924 .592 .77
I10 4.222 .979 .632 .77
I11 4.262 1.02 .584 .73
SI
I14 4.122 .941 .581 .63
0.821 0.818
I16 4.224 .922 .677 .74
I17 4.179 .960 .574 .64
I18 4.137 .956 .640 .73
I19 4.130 .928 .650 .71
ACR
I21 4.039 .980 .592 .69
0.801 0.798
I22 4.172 .918 .651 .74
I23 4.179 .923 .644 .73
I24 3.995 .978 .605 .68
CM
I27 4.160 .918 .620 .73
0.768 0.767
I28 4.010 1.02 .473 .60
I29 4.199 .913 .604 .71
I30 4.258 1.01 .557 .65
[image:7.595.66.546.346.690.2]4. Conclusions
This study, which aimed to develop a scale for pre-service teachers’ perceptions of competency in teaching quality, firstly prepared an items pool of 54 items. The items were then revised by experts and were regulated. The initiall form of 54 items was firstly administered to 232 teacher candidates, and the data obtained were analyzed through exploratory factor analysis.In order to provide evidence for the construct validity of the scale and to determine the factor structure of the scale, the first factor analysis was performed and, in consequence, it was found that the scale had a one-factor structure. Cronbach’s Alpha coefficient for the 54-item initial form was found to be approximately 0.99. 24 items with low discriminating power and factor loading were removed from the scale by preserving the theoretical structure of the scale. The scale containing 30 items was put to EFA analysis and thus the scale was found to have a 5-factor structure.
In order to confirm the 5-factor structure of the scale emerging as a result of EFA, EFA was conducted on a group of 617 participants which was different from the group of the first application. Following the arrangements made by considering the fit indices and modification indices, it was found that the structure obtained from EFA applications was verified on a different sample. Cronbach’s Alpha coefficient for the final form of 22 items was calculated approximately as 0.931; and McDonalds omega reliability coefficient was found to be approximately 0.953. The findings showed that the scale with 22 items in the final form that was developed in order to measure pre-service teeachers’ perceptions of competency in teaching quality was a valid and reliable tool of measurement and is a usable instrument for determined purposes.When the 5-point Likert type items of the scale are scored between zero and four, it is possible to receive scores from the five sub-dimensions separately and it is possible to receive scores between 0 and 88 from the whole scale. Higher points obtained from the scale can be interpreted as the pre-service teacher’s perception of competency in teaching quality is higher while lower points can be interpreted as the pre-service teacher’s perception of competency in teaching quality is lower.
The theoretical framework and the statements of items developed with pre-service teachers in Turkey are based on
international literature. Despite the differences of teacher training systems in all countries, the criteria for teaching quality have similarities. Therefore, the scale developed can also be adapted into other languages, and its validity and reliability can be checked in the future by applying it to pre-service teachers.The fact that the views are analyzed through qualitative research techniques in studies conducted in this field leads to working with small groups. The scale developed is a data collection tool capable of measuring the quality of teaching with five components. Thus, it is possible to study pre-service teachers’ access to gains offered in teacher training in bigger samples comparatively.
REFERENCES
[1] A. Helmke, “Unterrichtsqualitaet,” in Handwörterbuch
Paedagogische Psychologie, H. R. Detlef, Ed. Weinheim,
Basel: Beltz, 2010, pp. 886–895.
[2] W. Eisiedler, “Das konzept der unterrichtsqualität.,”
Unterrichtswissenschaſt, vol. 30, pp. 194–196, 2002. [3] M. Clausen, K. Reusser, and E. Klieme, “Unterrichtsqualität
auf der Basis hoch-inferenter Unterrichtsbeurteilungen. Ein Vergleich zwischen Deutschland und der deutschsprachigen Schweiz.,” Unterrichtswiss. , vol. 31, pp. 122 – 141, 2003. [4] I. Hosenfeld, A. Helmke, and F. Schrader, “Bildungsqualität
von Schule : Schulische und außerschulische Bedingungen mathematischer , naturwissenschaftlicher und überfachlicher Kompetenzen Herausgegeben von Manfred Prenzel und Jörg Doll,” Zeitschrift für Pädagogik, vol. 45. Beihef, p. S. 65 – 82., 2002.
[5] J. E. Brophy, “Teaching,” Geneva, 1999.
[6] A. Helmke, “Was wissen wir über guten unterrich?,” in Lehren
und Lernen für die Zukunft, 2007.
[7] H. Meyer, Was ist guter Unterricht? Berlin: Cornelsen., 2004. [8] T. Seidel and R. Shavelson, “Teaching Effectiveness Research in the Pat Decade: The Role of Theory and Research Design in disentangling Meta-Analysis Results,” Rev. Educ. Res., vol. 77, no. 4, pp. 454–499., 2007.
[9] F. Lipowsky, “Unterricht,” in Paedagogische psychologie
(Lehrbuch), E. Wild and J. Möller, Eds. Heidelberg: Springer