Journal of Chemical and Pharmaceutical Research
__________________________________________________
ISSN No: 0975-7384 CODEN(USA): JCPRC5
J. Chem. Pharm. Res., 2011, 3(3):597-609
Method development, validation and stability study for simultaneous
estimation of Etofylline and Theophylline by RP-HPLC chromatography in
marketed formulation
Nirav P. M*and Kaushal K.C
Department of Pharmaceutical Analysis, Jaipur National University, Jaipur, Rajashthan, India
______________________________________________________________________________
ABSTRACT
An approach of forced degradation study was successfully applied for the development of a stability-indicating assay method for simultaneous estimation of Etofylline and Theophylline in a formulation in the presence of its degradation products. The method showed adequate separation of Etofylline and Theophylline from their associated main impurities and degradation products. Separation was achieved on an YMC Pack-ODS-AQ, 150 x 4.6 mm the mobile phase 10mM Potassium Di-Hydrogen Phosphate : Acetonitrile (90:10) pH-4.5 with ortho phosphoric acid buffer flow rate of 1 mL/min and UV detection at 272 nm. Comprehensive stress testing of Etofylline and Theophylline Rt= 6.4 & 5.2 min was according to the International Conference on Harmonization (ICH) guideline Q1A (R2). The method was validated in terms of system suitability, precision, linearity, accuracy, robustness, ruggedness, LOD, LOQ and solution stability.
Keywords: Etofylline, Theophylline, RP-HPLC, Validation.
______________________________________________________________________________
INTRODUCTION
N
N N
N C
H3
CH3 O
O
OH
Theophylline is a Xanthine bronchodilator. Chemically known as 1,3-dimethyl-7H-purine-2,6-dione, the molecular structure of Etofylline is shown in Figure 2
N
N NH
N C
H3
C H3 O
O
Simultaneous Etofylline and Theophylline is not official in any Pharmacopoeia. Literature study reveals that a UV and HPLC method and individual are available for estimation of Etofylline and Theophylline. Moreover there is no Simultaneous estimation of estimation of Etofylline and Theophylline and its formulations.
The objective of this work was to develop inexpensive, simple and rapid stability indicating RP-HPLC methods which would be accurate and precise.
The methods were validated according to ICH guidelines. The linearity of response, accuracy, and intermediate precision of the described methods has been validated.
EXPERIMENT AL SECTION
Etofylline and Theophylline were provided as a gift sample by Suven Pharmaceutical Pvt Ltd. Hyderabad, India and its claimed purity was 99.0%. and Marketed formulation sample Deriphylline Tablets (Etofylline 77mg and Theophylline 23mg) claim Cadila Healthcare Limited (Sikkim, India).
All other reagent required for experimentation was of analytical reagent (AR) grade. Chemicals used for this experiment were, Methanol (HPLC grade) were purchased from fisher scientific pvt. Ltd, Acetonitrile (HPLC grade) was purchased from Spectrochem pvt. Ltd, Mumbai, ortho phosphoric acid (AR grade) was purchased from fisher scientific pvt. Ltd, Potassium Dihydrogen Phosphate (AR grade) is Merck, pvt. Ltd.
Equipments
Liquid chromatographic conditions
Chromatographic conditions were obtained using a stainless steel column YMC Pack-ODS-AQ, 150 mm × 4.6 mm 5µm), which was maintained at 30⁰ C. The analytical wavelength was set at 272 nm and samples of 5µl were injected to HPLC system. The mobile phase was 10mM Potassium Di-Hydrogen Phosphate : Acetonitrile (90:10) pH-4.5 with ortho phosphoric acid at a flow rate of 1.0ml/min. Diluent as a water. The mobile phase was filtered through 0.45µm filter (Sartorius, Germany) and degassed for 10 minutes by sonication.
Preparation of Standard Solution
The standard stock of Etofylline and Theophylline was prepared by dissolving 100mg and 30 mg of working standard in water in 100 mL volumetric flask. After sonicate for 5 min and volume was made up to the mark. 5 mL aliquot from the standard stock solution of Etofylline and Theophylline was transferred in 50 mL volumetric flask, and the volume was made up to the mark with diluent.
Assay Sample preparation:
Twenty tablets were weighed, their mean weight was determined, and they were crushed in a mortar. An amount of powdered mass equivalent to Etofylline 100 mg and Theophylline equivalent to 30 mg weighed, add water, sonicate for 15 min and make upto mark with diluent in 100ml volumetric flask. 5 mL aliquot from the stock solution of sample was transferred in 50 mL volumetric flask, and the volume was made up to the mark with diluent. Filtered it through 0.45µ
(PVDF Millipore Filter).
Stress Degradation studies:
Acid Degradation: Treated with 20ml 1 N HCl and heated on boiling water bath for 3 hours then cool at room temperature afte that add 20ml 1 N NaOH for neutralize the solution.
Alkali degradation:Treated with 20ml 1 N NaOH and heated on boiling water bath for 3 hours then cool at room temperature afte that add 20ml 1 N HCl for neutralize the solution.
RESULTS AND DISCUSSION
The solution 10 µg/ml of Etofylline and Theophylline were scanned in the UV range of 200- 400 nm and their Wavelength was found to be 272 respectively and Etofylline and Theophylline showed very good absorbance at this wavelength. Literature review reveals only individual
methods for estimation of Etofylline and Theophylline but no methods were reported for simultaneous estimation of Etofylline and Theophylline. A simple, precise, accurate, RP-HPLC method has been developed for the estimation of Etofylline and Theophylline in bulk and in Tablet formulation. A Chromatogram of Etofylline and Theophylline shown in fig-1, Etofylline and Theophylline with retention time of 6.4 min and 5.2 min respectively.
Parameter Etofylline Theophylline
Retention Time 6.4 5.2
Symmetry 0.83 0.81
Plates 12409 12185
Resolution 5.42
Selectivity 1.22
Figure 1 Chromatogram Of Etofylline and Theophylline
Figure 2 Chromatogram Of Acid Degradation (blank)
Figure 3 Chromatogram Of Acid Degradation (sample)
Stress Degradation studies: Acid Degradation:
Sample Preparation: Twenty tablets were weighed, their mean weight was determined, and
water-bath, after heating neutralize with the 20ml of 1N NaOH solution and make upto mark with water in 100ml volumetric flask. 5 mL aliquot from the stock solution of sample in 1N HCL was transferred in 50 mL volumetric flask, and the volume was made up to the mark with water. Blank solution is also treated with same procedure.
Alkali Degradation:
Sample Preparation: Twenty tablets were weighed, their mean weight was determined, and
they were crushed in a mortar. An amount of powdered mass equivalent to Etofylline 100 mg and Theophylline equivalent to 30 mg weighed, add 20ml of 1N NaOH, heat at 100°C for 3hr on water-bath, after heating neutralize with the 20ml 1N HCL solution and make upto mark with water in 100ml volumetric flask. 5 mL aliquot from the stock solution of sample in 1N NaOH was transferred in 50 mL volumetric flask, and the volume was made up to the mark with water. Blank solution is also treated with same procedure.
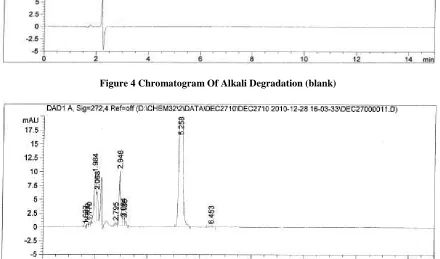
[image:5.595.92.527.264.422.2]Figure 4 Chromatogram Of Alkali Degradation (blank)
[image:5.595.88.528.350.609.2]Figure 5 Chromatogram Of Alkali Degradation (sample)
Table 2 Result of Forced Degradation Study
Purity Factor
Method Validation
Validation was carried out with respect to various parameters, as required under ICH guidelineQ2 (B).[9] The developed method validated with respect to parameters such as system suitability, precision, linearity, accuracy, robustness, ruggedness, LOD, LOQ and solution stability.
System suitability
[image:6.595.115.499.262.747.2]System suitability was daily performed during entire validation of this method. The results of system suitability were presented (Table 3)
Table 3 System Suitability Parameter
Theophylline Etofylline
Area Avg. Area Area Avg. Area
Standard 497.75 1252.99 Standard 498.69 1255.18 Standard 500.38 1258.84 Standard 503.54 1268.48 Standard 498.24 1255.26 Standard 500.36 499.82 1260.88 1258.6
SD 2.12 5.61
RSD 0.42 0.45
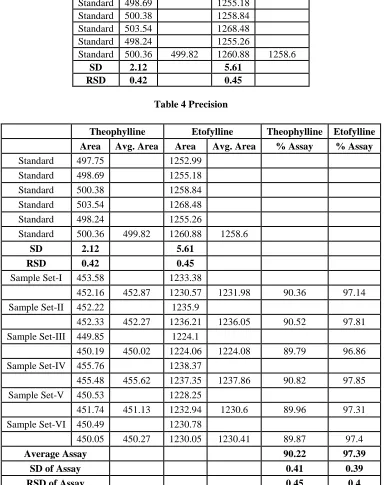
Table 4 Precision
Theophylline Etofylline Theophylline Etofylline
Area Avg. Area Area Avg. Area % Assay % Assay
Standard 497.75 1252.99
Standard 498.69 1255.18
Standard 500.38 1258.84
Standard 503.54 1268.48
Standard 498.24 1255.26
Standard 500.36 499.82 1260.88 1258.6
SD 2.12 5.61
RSD 0.42 0.45
Sample Set-I 453.58 1233.38
452.16 452.87 1230.57 1231.98 90.36 97.14 Sample Set-II 452.22 1235.9
452.33 452.27 1236.21 1236.05 90.52 97.81 Sample Set-III 449.85 1224.1
450.19 450.02 1224.06 1224.08 89.79 96.86 Sample Set-IV 455.76 1238.37
455.48 455.62 1237.35 1237.86 90.82 97.85 Sample Set-V 450.53 1228.25
451.74 451.13 1232.94 1230.6 89.96 97.31 Sample Set-VI 450.49 1230.78
450.05 450.27 1230.05 1230.41 89.87 97.4
Average Assay 90.22 97.39
SD of Assay 0.41 0.39
Precision
The method precision was done by preparing six different sample preparations by one analyst under the same condition. The results were presented in Table 5. The results obtained were within 2% RSD in Table 4.
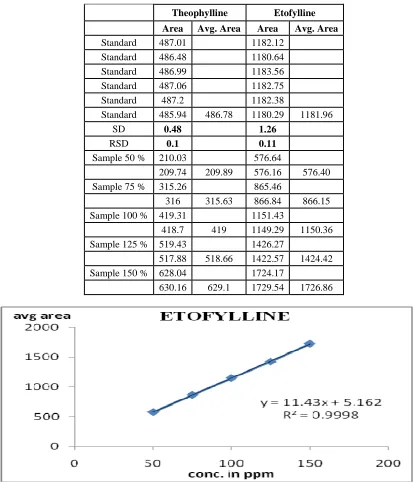
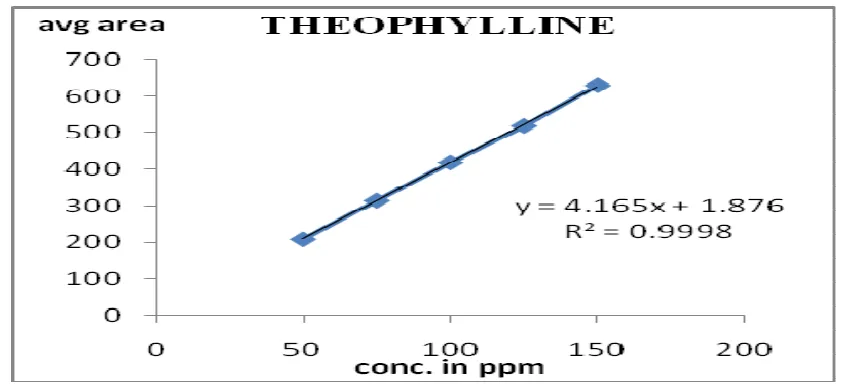
Linearity
The linearity was determined at 5 levels over the range of 50% to 150% of standard concentration. Etofylline and Theophylline standard stock solutions were prepared. The result obtained is in Table 5. r2 value for Etofylline and Theophylline were 0.9998 and 0.9998 in figure 6 & 7.
Table 5 Linearity of Etofylline and Theophylline
Theophylline Etofylline
Area Avg. Area Area Avg. Area
Standard 487.01 1182.12 Standard 486.48 1180.64 Standard 486.99 1183.56 Standard 487.06 1182.75
Standard 487.2 1182.38
Standard 485.94 486.78 1180.29 1181.96
SD 0.48 1.26
RSD 0.1 0.11
Sample 50 % 210.03 576.64
209.74 209.89 576.16 576.40 Sample 75 % 315.26 865.46
316 315.63 866.84 866.15 Sample 100 % 419.31 1151.43
418.7 419 1149.29 1150.36 Sample 125 % 519.43 1426.27
517.88 518.66 1422.57 1424.42 Sample 150 % 628.04 1724.17
630.16 629.1 1729.54 1726.86
[image:7.595.92.506.243.726.2]
[image:8.595.98.513.322.442.2]
Figure 7 Linearity curve for Theophylline
Table 6 % Recovery
Avg Area Avg Assay % Recovery
Theophylline Etofylline Theophylline Etofylline Theophylline Etofylline
Sample 50% 209.89 576.4 43.52 49.01 100.18 100.21
Sample 75% 315.63 866.15 65.45 73.65 100.44 100.39
Sample 100% 419 1150.36 86.89 97.82 100 100
Sample 125% 518.66 1424.42 107.55 121.12 99.03 99.06
[image:8.595.127.483.479.685.2]Sample 150% 629.1 1726.86 130.45 146.84 100.09 100.08
Table 7 Standard Condition For Robustness
Theophylline Etofylline Theophylline Etofylline
Area Avg. Area Area Avg. Area % Assay % Assay
Standard 473.23 1162.52 Standard 473.15 1162.52 Standard 473.08 1162.28 Standard 472.62 1161.26 Standard 472.42 1161.79
Standard 472.39 472.82 1161.32 1161.95
SD 0.38 0.57
RSD 0.08 0.05
Sample 425.71 1162.41
425.28 425.5 1161.71 1162.06 89.81 99.71
SD 0.3 0.5
RSD 0.07 0.04
Limit of Detection and Limit of Quantification
LOD = 3.3 × σ/S LOQ = 10 × σ/S
Where σ = standard deviation of the response S= slope of the regression line
[image:9.595.74.541.413.620.2]Table 8 Temperature Variation For Robustness (28˚C)
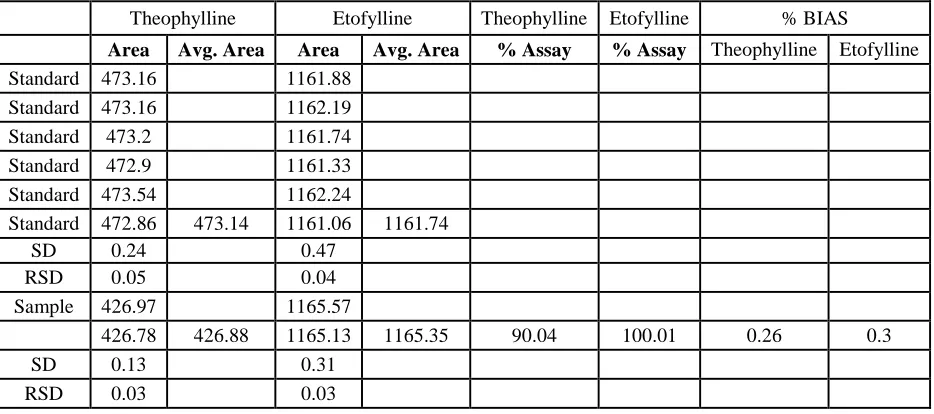
Table 9 Temperature Variation For Robustness (32˚C)
Theophylline Etofylline Theophylline Etofylline % BIAS
Area Avg. Area Area Avg. Area % Assay % Assay Theophylline Etofylline Standard 473.16 1161.88
Standard 473.16 1162.19 Standard 473.2 1161.74 Standard 472.9 1161.33 Standard 473.54 1162.24
Standard 472.86 473.14 1161.06 1161.74
SD 0.24 0.47
RSD 0.05 0.04
Sample 426.97 1165.57
426.78 426.88 1165.13 1165.35 90.04 100.01 0.26 0.3
SD 0.13 0.31
RSD 0.03 0.03
Accuracy (% Recovery)
The difference between theoretical added amount and practically achieved amount is called accuracy of analytical method. Accuracy was determined at 5 different level 50%, 75%, 100%, 125% and 150% of the target concentration in duplicate. Result of accuracy data presented in Table 6.
Robustness
Robustness of the method was carried out by deliberately made small change in the flow rate, and organic phase ratio, column oven temperature. Results were presented in Table 7-13.
Theophylline Etofylline Theophylline Etofylline % BIAS
Area Avg. Area Area Avg. Area % Assay % Assay Theophylline Etofylline Standard 473.33 1160.61
Standard 474.36 1162.39 Standard 473.11 1160.14 Standard 473.35 1160.56 Standard 473.56 1160.81
Standard 472.49 473.37 1158.55 1160.51
SD 0.61 1.23
RSD 0.13 0.11
Sample 425.66 1160.65
426 425.83 1160.67 1160.66 89.78 99.71 -0.04 0.00
SD 0.24 0.02
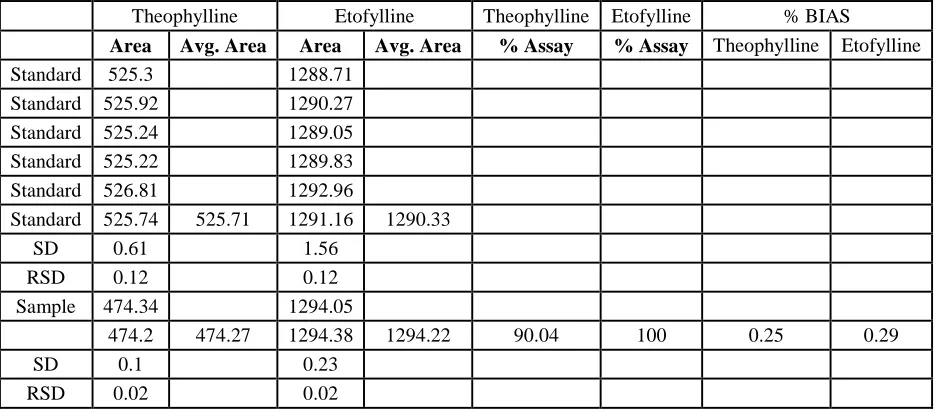
Table 10 Flow rate Variation For Robustness (0.9ml/min)
Theophylline Etofylline Theophylline Etofylline % BIAS
Area Avg. Area Area Avg. Area % Assay % Assay Theophylline Etofylline Standard 525.3 1288.71
Standard 525.92 1290.27 Standard 525.24 1289.05 Standard 525.22 1289.83 Standard 526.81 1292.96
Standard 525.74 525.71 1291.16 1290.33
SD 0.61 1.56
RSD 0.12 0.12
Sample 474.34 1294.05
474.2 474.27 1294.38 1294.22 90.04 100 0.25 0.29
SD 0.1 0.23
RSD 0.02 0.02
Table 11 Flow rate Variation For Robustness (1.1ml/min)
Theophylline Etofylline Theophylline Etofylline % BIAS
Area Avg. Area Area Avg. Area % Assay % Assay Theophylline Etofylline Standard 430.73 1060.94
Standard 432.15 1064.28 Standard 490.8 1059.96 Standard 430.28 1059.62 Standard 430.26 1059.13
Standard 430.41 440.77 1060.27 1060.7
SD 24.52 1.86
RSD 5.56 0.18
Sample 390.23 1063.24
391 390.61 1064.41 1063.83 88.44 99.99 -1.52 0.28
SD 0.55 0.82
RSD 0.14 0.08
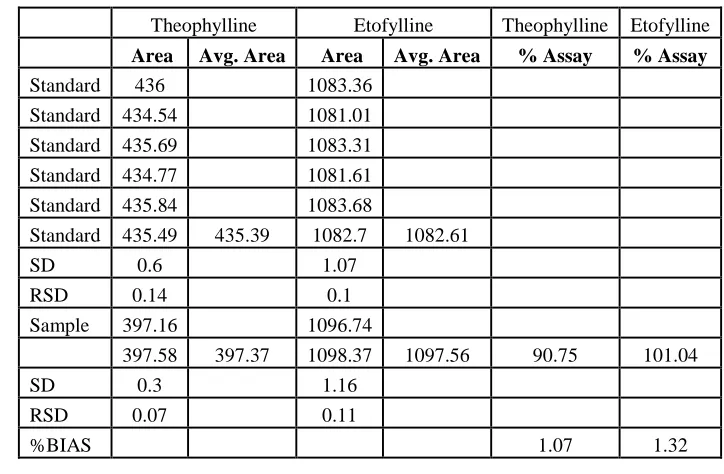
Ruggedness
Ruggedness test was determined between two different analysts, instruments and Columns. The value of percentage RSD was below 2.0%, showed ruggedness of developed analytical method. The results were presented in Table 14.
Solution stability
[image:10.595.76.541.334.542.2]Table 12 Mobile Phase Composition Variation For Robustness (88:12)
Theophylline Etofylline Theophylline Etofylline % BIAS
Area Avg. Area Area Avg. Area % Assay % Assay Theophylline Etofylline Standard 473.16 1163.71
Standard 471.2 1159.09 Standard 471.78 1160.22 Standard 471.57 1159.53 Standard 471.06 1159.09
Standard 470.93 471.62 1158.97 1160.1
SD 0.82 1.83
RSD 0.17 0.16
Sample 422.81 1155.49
422.8 422.81 1155.85 1155.67 89.47 99.32 -0.38 -0.39
SD 0 0.25
RSD 0 0.02
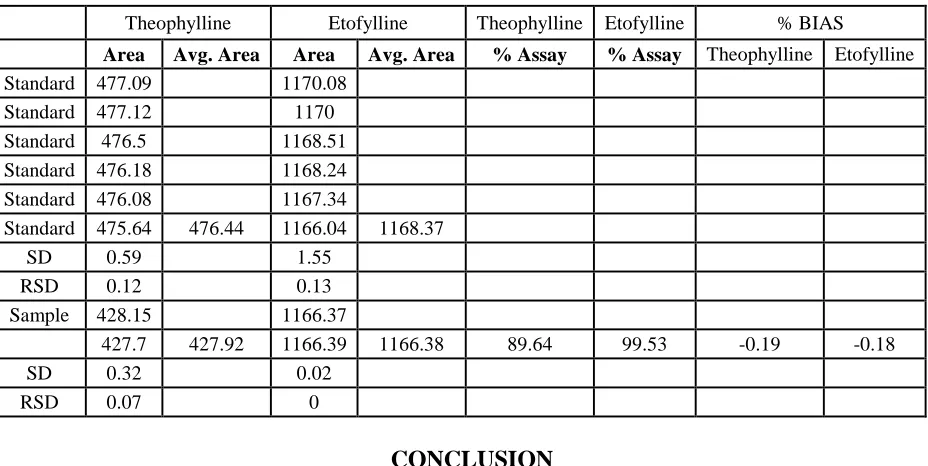
Table 13 Mobile Phase Composition Variation For Robustness (92:8)
CONCLUSION
From the above study we can conclude that the Etofylline and Theophylline undergo degradation to different extent under different, above mentioned, stress conditions. In this study, the products formed after forced decomposition studies were resolved from the bulk drug response. From the peak purity profile studies, it was confirmed that the peak of the degradation product was not interfering with the peak of drugs. It confirms that peak for degradation product of drug can be resolved from the drug peak by this method. The developed method is simple, accurate, precise, and specific, economic. It is proposed simultaneous routine analysis of these drugs in presence of degradation products in stability study.
Theophylline Etofylline Theophylline Etofylline % BIAS
Area Avg. Area Area Avg. Area % Assay % Assay Theophylline Etofylline Standard 477.09 1170.08
Standard 477.12 1170
Standard 476.5 1168.51 Standard 476.18 1168.24 Standard 476.08 1167.34
Standard 475.64 476.44 1166.04 1168.37
SD 0.59 1.55
RSD 0.12 0.13
Sample 428.15 1166.37
427.7 427.92 1166.39 1166.38 89.64 99.53 -0.19 -0.18
SD 0.32 0.02
[image:11.595.70.534.329.562.2]Table 14 Ruggedness
Theophylline Etofylline Theophylline Etofylline Area Avg. Area Area Avg. Area % Assay % Assay
Standard 436 1083.36
Standard 434.54 1081.01
Standard 435.69 1083.31
Standard 434.77 1081.61
Standard 435.84 1083.68
Standard 435.49 435.39 1082.7 1082.61
SD 0.6 1.07
RSD 0.14 0.1
Sample 397.16 1096.74
397.58 397.37 1098.37 1097.56 90.75 101.04
SD 0.3 1.16
RSD 0.07 0.11
%BIAS 1.07 1.32
Table 15 Solution Stability Study
THEOPHYLLINE ETOFYLLINE %Difference
Area Area THEOPHYLLINE ETOFYLLINE
Standard - 0hour 457.45 1167.32 - -
Standard - 3 hour 455.13 1162.65 -0.51 -0.4
Standard - 6 hour 455.43 1164.22 -0.44 -0.27
Standard - 9 hour 455.73 1165.85 -0.37 -0.13
Standard - 12 hour 456.38 1166.47 -0.23 -0.07
Standard - 15 hour 457.12 1167.4 -0.07 0.01
Standard - 18 hour 459.7 1164.52 0.49 -0.24
Standard - 21 hour 461.64 1148.1 0.92 -1.65
Standard - 24 hour 460.35 1146.78 0.64 -1.76
Acknowledgment:
Sincere thankful to Jaipur National University for providing the research facilities, Suven Pharmaceutical Pvt Ltd. Hyderabad, India for providing the Etofylline and Theophylline drug samples.
REFERENCES
[1] G. Schumann, I. Isberner and M. Oellerich Fresenius, Journal of Analytical Chemistry Volume 317, Number 6, 677.
[2] Supriya Shidhaye, Sheetal Malke, Vilasrao Kadam Validated stability indicating HPLC method for estimation of theophylline from a novel microsphere formulation. Year :
2009,Volume : 3,Issue : 1,Page : 13-17
[image:12.595.94.520.361.522.2][4] M. Shukla, D. Ajjala, K. Mudigonda, V. Kandikere, R. Nirogi, Therapeutic Drug Monitoring of Theophylline and Etofylline in Human Plasma
[5] V. M. Shinde , N. M. Tendolkar, B. S. Desai, Simultaneous Determination of Theophylline and Etofylline in Pharmaceutical Dosages by HPTLC.
[6] PFQ( pharmaceutical information and quality ) post-discovery development validation, volume 11, number 7, december/january10.
[7] Chandrul Kaushal K., B. Srivastava, J. Chem. Pharm. Res., 2010, 2(2): 519-545
[8] ICH, Q2A, Text on Validation of Analytical Procedures, International Conference on Harmonization, Geneva, October 1994, 1-5.
[9] ICH, Q2B, Validation of Analytical Procedures: Methodology, International Conference on Harmonization, Geneva, November 1996, 1-8.
[10]The United States Pharmacopoeia, 27th Rev., U.S. Pharmacopoeial Convention, Inc., Rockville, M.D., 2004, 2281-2282, 2622-2624.
[11]The Indian pharmacopoeia 2007, Indian Pharmacopoeia Commission.
[12] British pharmacopoeia 2007
[13]A Practical Handbook of Preparative HPLC, Elsevier The Boulevard, Langford Lane,
Kidlington, Oxford. Chromatography, 5th edition, fundamentals and application of
chromatography and related differential migration methods, E.Heftmann
[14]Comprehensive Analytical Chemistry ,S. Ahuja and N. Jespersen (Eds) Volume 47.
[15]http://www.informaworld.com/smpp/content~db=all~content=a747018578 acceessed on 20/08/2010 at 11:15am
[16]http://webcache.googleusercontent.com/search?q=cache:_TD9gyhaQxUJ:www.aapsj.org/ab stracts/AM_2006/staged/AAPS2006002672.PDF+etofylline+and+theophylline&cd=1&hl=en&c t=clnk&gl=in acceessed on 20/08/2010 at 12:05am