Journal of Chemical and Pharmaceutical Research
__________________________________________________
ISSN No: 0975-7384 CODEN(USA): JCPRC5
J. Chem. Pharm. Res., 2011, 3(1):108-114
Physico-chemical parameter prediction from drug structure using
multiple linear regression and artificial neural networks
M. Fakoor Yazdan Abad and Z. Bayat*
Department of Chemistry, Islamic Azad University-Quchan Branch, Iran
ABSTRACT
A set of adamantane derivatives (AD) as drug were tested for their chromatographic behavior and Kovats retention index (RI) were determined for all the compounds. Quantitative structure Property relationship (QSPR) analysis was applied to 32 of the AD.Molecular descriptors derived solely from 3D structures of the molecular compounds. Modeling of RI of AD as a function of the theoretically derived descriptors was established by multiple linear regression (MLR) And artificial neural networks (ANNs) for the prediction of Kovats retention index . The models were constructed using 25 molecules as training set, and predictive ability tested using 7 compounds. The usefulness of the quantum chemical descriptors, calculated at the level of the Density Functional Theory(DFT) theories using 6-31+G** basis set for QSPR study of AD was examined. A multi-parametric equation containing maximum five descriptors at B3LYP/6-31+G** method with good statistical qualities (R2train=0.914, Ftrain=97.674, R2test=0.770,
Ftest=3.214, Q2LOO=0.895, R2adj=0.904,Q2LGO=0.84451) was obtained by Multiple Linear
Regression using stepwise method.
Keywords: Adamantane derivatives, Kovats retention index (RI), MLR, QSPR, ANNs
______________________________________________________________________________
INTRODUCTION
Adamantane is simplest diamondoid molecule and originally isolated from oil in 1933, is a
hydrocarbon (C10H16) possessing a rigid but unstressed structure comprising four condensed
configuration of the adamantane molecules has a nearly perfect spherical shape [1]. For this reason, the surface of these molecules is relatively very small. Rigid ring structure prevents liquefaction of the crystalline form, which explains the very high melting point (268°C). Various methods for constructing QSAR/QSPR models have been used including multilinear regression (MLR) and artificial neural networks (ANNs) have become popular due to their success where complex nonlinear relationships exist amongst data, as is often the case when dealing with drug data sets (Turner et al., 2003b). Moreover, the generalization ability of ANNs makes them useful for construction of predictive models. ANNs represent learning tools which are distinctly different from standard statistical methods, and as such are not necessarily bound by the same constraints that linear methods are[2]. A number of theoretical descriptors were generated from the drug structures were used to derive optimal subsets of descriptors for quantitative structure-pharmacokinetic relationship models. Models were trained on one set of compounds and validated with another. Absolute predicted ability was evaluated using a further independent test set of compounds.Correlations between physicochemical properties and chromatographic retention parameters of AD. were studied. Correlations for test compounds ranged from 0.855 to 0.992. Predicted values agreed closely with experimental values for AD. [3-10]
EXPERIMENTAL SECTION
2.1. Experimental data
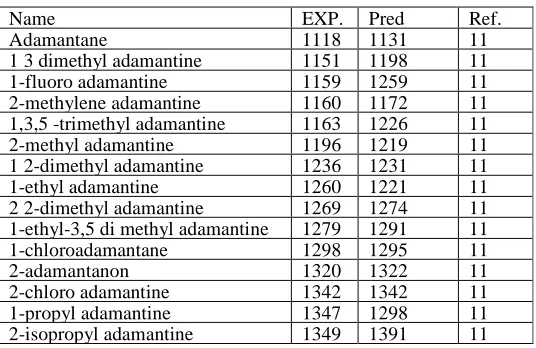
[image:2.595.165.433.557.731.2]The ANN technique develops data-driven models, such that known information about drugs from empirical methods does not influence the system. The data set of 32 compounds was divided randomly into a working data set for model construction and a testing set to evaluate the predictive performance of each model[11]. The working set was further divided into a training subset of 25 compounds and a validation subset of 7 compounds used to monitor network performance during training. Final predictive ability was determined using the 7 independent compounds in the testing set. Subsets were all examined statistically to ensure that validation and testing data did not lie outside the limits of the training set . The properties data for the complete set of compounds are presented in Table 1 and 2.To derive QSPR models, an appropriate representation of the chemical structure is necessary. For this purpose, descriptors of the structure are commonly used.
Table 1. Experimental values of RI for AD training set
Name EXP. Pred Ref.
Adamantane 1118 1131 11
1 3 dimethyl adamantine 1151 1198 11 1-fluoro adamantine 1159 1259 11 2-methylene adamantine 1160 1172 11 1,3,5 -trimethyl adamantine 1163 1226 11 2-methyl adamantine 1196 1219 11 1 2-dimethyl adamantine 1236 1231 11 1-ethyl adamantine 1260 1221 11 2 2-dimethyl adamantine 1269 1274 11 1-ethyl-3,5 di methyl adamantine 1279 1291 11 1-chloroadamantane 1298 1295 11
2-adamantanon 1320 1322 11
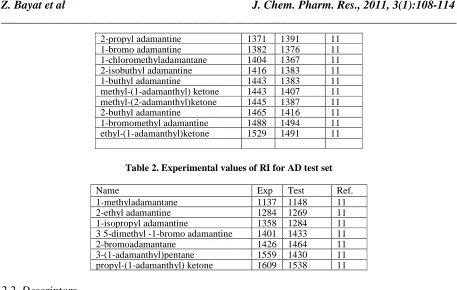
2-propyl adamantine 1371 1391 11 1-bromo adamantine 1382 1376 11 1-chloromethyladamantane 1404 1367 11 2-isobuthyl adamantine 1416 1383 11 1-buthyl adamantine 1443 1383 11 methyl-(1-adamanthyl) ketone 1443 1407 11 methyl-(2-adamanthyl)ketone 1445 1387 11 2-buthyl adamantine 1465 1416 11 1-bromomethyl adamantine 1488 1494 11 ethyl-(1-adamanthyl)ketone 1529 1491 11
Table 2. Experimental values of RI for AD test set
Name Exp Test Ref.
1-methyladamantane 1137 1148 11 2-ethyl adamantine 1284 1269 11 1-isopropyl adamantine 1358 1284 11 3 5-dimethyl -1-bromo adamantine 1401 1433 11
2-bromoadamantane 1426 1464 11
3-(1-adamanthyl)pentane 1559 1430 11 propyl-(1-adamanthyl) ketone 1609 1538 11
2.2. Descriptors
[image:3.595.53.545.538.687.2]Presentation of data containing adequately useful information to ANNs is the basis for construction of effective predictive models. For this purpose, descriptors of the structure are commonly used. These descriptors are generally understood as being any term, index or parameter conveying structure information. Commonly used descriptors in the QSPR analysis are presented in Table 3.In this work, we used Gaussian 03 for ab initio calculations.DFT method at 6-31+G** were applied for optimization of AD and calculation of many of the descriptors. At first AD were built by Hyperchem software and some o the descriptors such as surface area, hydration energy, and refractivity were calculated through it. The rest of the descriptors were obtained of Gaussian calculations. A large number of descriptors were calculated by Gaussian package and Hyperchem software.
Table 3. The calculated descriptors used in this study
Descriptors Symbol Abbreviation Descriptors Symbol Abbreviation
Quantum chemical descriptors Molecular Dipole Moment MDP Quantum chemical descriptors difference between LUMO and HOMO
E GAP
Molecular Polarizability MP Hardness
[ η=1/2
Η
Natural Population Analysis
NPA Softness ( S=1/ η ) S
Electrostatic Potentialc EP Electro negativity
[χ= -1/2 (HOMO– Χ Highest Occupied
Molecular Orbital
HOMO El Electro philicity (ω=χ2
/2 η )
Ω
Lowest Unoccupied Molecular Orbital
LUMO Mullikenl atomic
Chargeg
MC Chemical
properties
Partition Coefficient Log P
Chemical properties
Molecule surface area SA
Mass M Hydration Energy HE
2.3. ANN modeling
The ANN program used was Statistica Neural Networks (StatSoft Inc., 2000). All networks were of the three-layered feed-forward back-propagation (multilayer perceptron) type, containing a bias neuron in each layer and a single neuron in the output layer. Asigmoidal transfer function was employed in all neurons and weight adjustment was performed according to the generalised delta rule (Bourquin et al., 1997). Connection weights were initialised with random values.Models were constructed using the training set of compounds. The validation subset was then used to provide an indication of model performance. All generated descriptors were included in the initial model.Redundant descriptors were then pruned and the system was re-trained. Once optimum models were achieved true predictive ability was assessed using the testing subset of compounds. Both manual and automated methods were employed for descriptor selection. Sensitivity analysis of inputs was used to identify significance of individual molecular descriptors and to select descriptors that were considered the most important. Descriptors with sensitivities lower than one were deemed to be detrimental to the model. The higher the sensitivity above one the greater its influence on the model. Hence, those with lower sensitivities were able to be sequentially removed. The ANN program also utilized regularization and search algorithms for automated descriptor selection.[12-17]
RESULTS AND DISCUSSION
3.1. Data analysis and training
Molecules for this study were selected as follows. Our starting point was 32 AD For each of the selected molecules,geometry optimization was employed and then the descriptors were calculated through Density Functional Theory method at 6-31+G** basis set. MLR and ANN models were constructed in the present work using SPSS and MATLAB softwares. In order to build and test the model, a data set of 32 compounds was separated into a training set of 25 compounds, which were used to build the model and a test set of 7 compounds, which were applied to test the built model. Those descriptors that were too strongly correlated with the others were rejected. The first two QSAR models were derived from using all descriptors and molecules followed by these equations:
RI = -4.45754 (±1.161528) σ9 -80.1305 (±11.72555) ∆GCYCLO + 5.768715 (±0.292762) M -
121.607 (±42.44063) MC9 + 0.072961 (±0.015957) HF +177.4361 (±112.5648)
( B3LYP/6-31+G**)
R2train=0.914 Ftrain=97.674 R2test=0.770 Ftest =3.214 R2adj=0.904 Q2LOO=0.895 Q2LGO= 0.84451 Ntrain= 25 Ntest = 7
In this equation, N is the number of compounds, R2 is the squared correlation coefficient, Q2LOO
and Q2LGO are the squared cross-validation coefficients for leave one out, bootstrapping and
Figure1. The predicted versus the experimental RI by MLR.
Figure 2. The residual versus the experimental RI by GA-MLR.
(See colour version of this figure online at www.informahealthcare.com/enz)
3.2. Training and validation
in this study to assess the robustness of the model, the Y-randomisation test was applied. The dependent variable vector (RI) was randomly shuffled and The new QSPR models (after several
repetitions) would be expected to have low R2 and Q2 LOO values (Table 4). If the opposite
happens then an acceptable QSPR model cannot be obtained for the specific modeling method and data.
Table 4. The R2train and Q2LOO values after several Y-randomisation tests
NO Q2 R2
1 0.1045 0.0312 2 0.00002 0.0976 3 0.0939 0.0614 4 0.0042 0.1282 5 0.0457 0.0570 6 0.0340 0.1927 7 0.0060 0.1442 8 0.2991 0.0125 9 0.0175 0.1700 10 0.0251 0.0608
The MLR analysis was employed to derive the QSPR models for different AD. MLR and
Table5. The correlation coefficient existing between the variables used in different MLR and equations with b3lyp/6-31+G** method
HF MC9 M ∆GCYCLO σ9
HF 1 0 0 0 0
MC9 0.048869 1 0 0 0
M 0.39506 0.245901 1 0 0
∆GCYCLO 0.099875 0.22142 0.226936 1 0
σ9 0.17506 0.485565 0.070032 0.04617 1
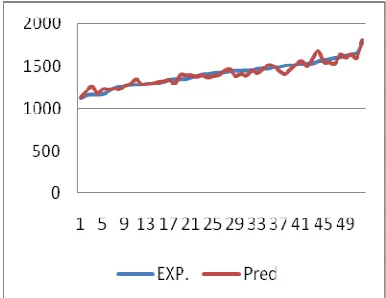
Figure 3 has showed that results were obtained from equation B3LYP/6-31+G** to the experimental values.
Series 1: the values of RI were obtained by using prediction.
Series 2: the values of RI were obtained by using Experimental methods.
Figure 3. The comparison between properties (RI) using experimental and prediction.
CONCLUSION
The QSPR developed indicated that Nuclear magnetic Resonance (σ9), free energy solvation
(∆GCYCLO), Mulliken atomic charges (MC9) and Hartee-fuck energy (HF)compound Kovats
retention index. Positive values in the regression coefficients indicate that the indicated
descriptor contributes positively to the value of RI, whereas negative values indicate that the
greater the value of the descriptor the lower the value of RI. In other words, increasing the σ9,
∆GCYCLO and MC9 will decrease RI and increasing the HF and M increases extent of RI of the
AD. The standardized regression coefficient reveals the significance of an individual descriptor presented in the regression model.The results showed that b3ly /6-31+G** method provides results close to experimental values . The QSPR model developed in this study can provide a useful tool to predict the RI of new compounds and also to design new compounds with high RI.
REFERENCES
[1]. 1. V. S. Savel’ev and V. M. Koshkin, Critical Ischemia of LowerExtremities [in Russian], Meditsina, Moscow (1997).
[image:6.595.201.394.261.410.2][3]. Buckley GM, Ceska TA, Fraser JL, Gowers L, Groom CR, Higueruelo AP, Jenkins K, Mack SR, Morgan T, Parry DM, Pitt WR, Rausch O, Richard MD, Sabin V. Bioorg Med Chem Lett 2008;18:3291–3295.
[4]. Buckley GM, Fosbeary R, Fraser JL, Gowers L, Higueruelo AP, James LA, Jenkins K, Mack SR, Morgan T, Parry DM, Pitt WR, Rausch O, Richard MD, Sabin V. Bioorg Med Chem Lett 2008;18:3656–3660.
[5]. Buckley GM, Gowers L, Higueruelo AP, Jenkins K, Mack SR, Morgan T, Parry DM, Pitt WR, Rausch O, Richard MD, Sabin V, Fraser JL. Bioorg Med Chem Lett 2008;18:3211–3214. [6]. Sammes PG, Taylor JB. Comprehensive Medicinal Chemistry. Oxford: Pergamon Press, 1990:766.
[7]. Riahi S, Pourbasheer E, Dinarvand R, Ganjali MR, Norouzi P. Chem Biol Drug Des 2008;74:165–172.
[8]. Riahi S, Pourbasheer E, Ganjali MR, Norouzi P. J Hazard Mater 2009;166:853–859. [9]. Riahi S, Pourbasheer E, Ganjali MR, Norouzi P. Chem Biol Drug Des 2009;73:558–571. [10]. Depczynski U, Frost VJ, Molt K. Anal Chim Acta 2000;420:217.
[11].Jiri Burkhard,Jiri Vais,Ludek Vodicka And Stanislav Landa. Jornal of Chromatography.
Chrom.4057.Adamantane and its derivatives. XVI. The gas chromatographic charactrization of adamantane derivatives.
[12]Titmarsh, S., Monk, J.P., 1987. Drugs 33, 461–477.
[13]Turner, J.V., Cutler, D.J., Spence, I., Maddalena, D.J., 2003a. J. Comput. Chem. 24, 891– 897.
[14]Turner, J.V., Maddalena, D.J., Cutler, D.J., Agatonovic-Kustrin, S., 2003b. J. Pharm. Sci. 92, 518–525.
[15]Villemin, D., Cherqaoui, D., Cense, J.M., 1993. J. Phys. Chem. Physicochem. Biol. 90, 1505–1519.
[16]Viswanadhan, V.N., Ghose, A.K., Revenkar, G.R., Robins, R.K., 1989. J. Chem. Inf.
Comput. Sci. 29, 163–172.