Parametric study of Multi-Spot Welded Lap Shear Specimen for Shear Strength
and Validation through Finite Element Analysis
Raghunath T Bandgar*, Pravin.A Dhawale**, Ravindra.T Vyavahare**
*Scholar, Department of mechanical Engineering, Sinhgad College of engineering, Korti,pandharpur,
**Professor, Department of mechanical Engineering, Sinhgad College of engineering, Korti,pandharpur,
Abstract-The effect of number of spots, spot spacing, squeezing force, welding current, weld time, overlapping length and sheet thickness on the shear strength of two similar galvanized steel sheets are investigated through experiments using RSM method. Similar sheets of galvanized steel sheets are made by resistance spot welding at different processing conditions and these joint populations were tested under lap-shear loading conditions. Specially fabricated fixture is used to load the lap shear specimen in the universal testing machine Regression analysis is done to obtain relationship between shear strength and selected parameters. Moreover finite element analysis of multi spot welded lap shear specimen has been carried out .The experimental results indicate that the failure loads of spot welds in lap-shear specimens increase when number of spot, squeezing force, welding current and sheet thickness increase for the given ranges.
Keywords-Number of spots, Shear Strength, Process parameters, Finite Element Analysis (FEA)
1. INTRODUCTION
Resistance spot welding (RSW) is a process of joining metal components through the fusion of discrete spots at the interface of the work pieces. It is one of the most useful and practical methods for the manufacture of sheet metal assemblies. This process is common for welding sheets of aluminium, stainless steel, titanium alloys etc. A typical automobile consists of more than 5000 spots [1].This study gives relationship among process parameters and strength of spot weld. Galvanized sheets are spot welded at permissible level of parameters so as to visualize interfacial mode of failure after tensile shear test [2].Author considered processing time as parameter. It was observed that shear strength of spot weld increases with increasing processing time [3].This study consists of application of Taguchi method to study effect of process parameters on strength of spot weld [4]. This study consists of
relationship between pre-straining and shear strength of spot weld [5].Lap shear specimen is used and its fatigue strength is obtained through experimentation .Effect of nugget diameter on fatigue strength of spot weld is studied [6]. Effect of fusion zone size on the shear strength is studied [7].Experiments were planned on the basis of response surface methodology (RSM) [8].Strength of spot weld defines the quality of integrated structure of automobile and improves the reliability of assembled sheets.Structural stability of multi spot welded structure depends upon number of spots, their locations and variable loads acting on it. So, investigation on the relations between the strength of spot weld and number of spots is the key to solve problem in the design of multi-spot welded structure. The diameter of the spot weld nugget, d, is chosen based on an empirical formula recommended by the American Welding Society (AWS), diameter of nugget is considered as follows.
(1)
However, several author claim that this equation is not safe for thickness beyond 1.5 mm. Though the effect of the process parameters on the mechanical behaviour of resistance spot welds on steels is well documented, study of failure modes of spot weld. The welds were done using a RSW electric resistance spot welding machine, with a nominal welding power of 10 kVA. Table I shows ranges of parameters and Table II
showsResistance spot welding parameters and
corresponding strength.
I I EXPERIMENTAL PROCEDURE
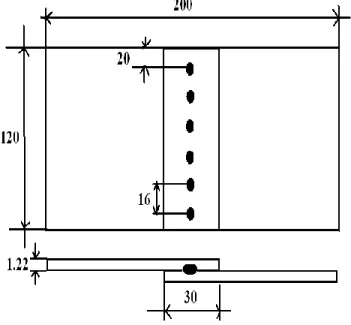
Mechanical properties of galvanized steels are given in Table 1. Resistance spot welding lap joints were done on specimens of 120 mm× 200 mm×1.22mm in size.Figure1 shows the geometry and dimensions of the welded specimens. Sheet surfaces were randomly abraded with silicon carbide paper P220 grade. Figure 2 shows local display of experimental set up.
Fig.1. Dimensions of tensile-shear test specimens (not to scale, dimensions in mm).
Fig.2 Local Display of Experiment Set up
Moreover Tensile shear testing has been carried out at dynamical loading condition i.e. loading velocities are 1.32m/min and 2 m/min. Dynamic shear strength has been obtained at different loading velocity .Ten number of lap-shear specimens are tested. Loading velocity has been varied as mentioned above. Up to 5mm displacement, loading velocity was constant. It can be seen that load was increased with respect to time. All spot welded specimens have been made at same welding conditions but each specimen tested at different loading velocities. Specimen configuration has been kept same which is shown in Fig.1 the results of the dynamic strength tests for all the joints are obtained in the form of load versus displacement curves using un-filtered load versus time and displacement versus time data.
III SIMULATION OF LAP SHEAR SPECIMEN
The simulation of single spot and multi spot welded specimen by using finite element method has been carried out. A three dimensional nonlinear and time step incremental finite element analysis of multi-spot welded lap shear specimen has been carried out and shear strength of spot weld has been analysed with respect to time. Thickness and nugget radius are randomly varied within effective range and their effects on the shear strength of multi spot welded lap specimen have been
analysed under dynamic loading condition.
Confirmation tests have been conducted to validate the results. Lap shear specimen having three spots are modelled for simulation. It is as shown in Fig.4 .FEM package ANSYS have been used to perform simulation. Elements selected for meshing the geometry of the specimen are, solid 186, MPC 184, Target 170 and Contact 175. MPC184 element is used to define spot weld. Material properties of uncoated mild steels are entered. Model of same geometry is drawn in ANSYS software. . Maximum shear stress at spot welding element has been selected as response parameters. Non-linear properties of uncoated mild steel are entered. All degrees of freedom are made zero at one end of specimen while other end is subjected to displacement. Fig.3 shows spot welding reactions at three different locations indicated by yellow arrows while pink indicate all DOF zero. Red colored arrows indicate displacement is applied.
Fig.3 Spot weld reactions for multi spot welded specimen
Table I shows resistance spot welding parameters and corresponding strength and Table II shows ranges of parameters
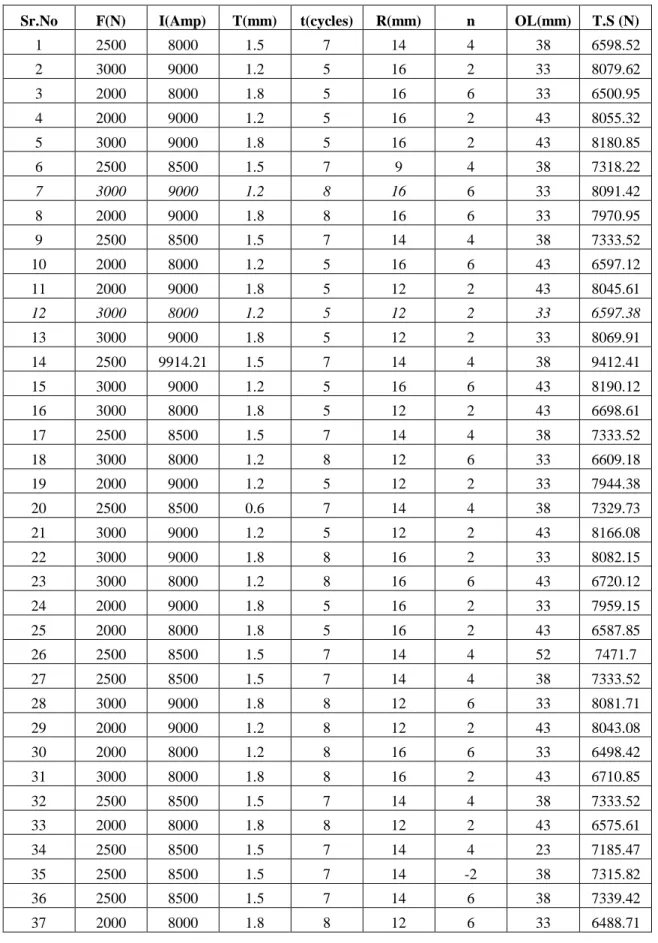
Table III Resistance spot welding parameters and corresponding strength (Response Surface Methodology)
Sr.No F(N) I(Amp) T(mm) t(cycles) R(mm) n OL(mm) T.S (N)
1 2500 8000 1.5 7 14 4 38 6598.52 2 3000 9000 1.2 5 16 2 33 8079.62 3 2000 8000 1.8 5 16 6 33 6500.95 4 2000 9000 1.2 5 16 2 43 8055.32 5 3000 9000 1.8 5 16 2 43 8180.85 6 2500 8500 1.5 7 9 4 38 7318.22 7 3000 9000 1.2 8 16 6 33 8091.42 8 2000 9000 1.8 8 16 6 33 7970.95 9 2500 8500 1.5 7 14 4 38 7333.52 10 2000 8000 1.2 5 16 6 43 6597.12 11 2000 9000 1.8 5 12 2 43 8045.61 12 3000 8000 1.2 5 12 2 33 6597.38 13 3000 9000 1.8 5 12 2 33 8069.91 14 2500 9914.21 1.5 7 14 4 38 9412.41 15 3000 9000 1.2 5 16 6 43 8190.12 16 3000 8000 1.8 5 12 2 43 6698.61 17 2500 8500 1.5 7 14 4 38 7333.52 18 3000 8000 1.2 8 12 6 33 6609.18 19 2000 9000 1.2 5 12 2 33 7944.38 20 2500 8500 0.6 7 14 4 38 7329.73 21 3000 9000 1.2 5 12 2 43 8166.08 22 3000 9000 1.8 8 16 2 33 8082.15 23 3000 8000 1.2 8 16 6 43 6720.12 24 2000 9000 1.8 5 16 2 33 7959.15 25 2000 8000 1.8 5 16 2 43 6587.85 26 2500 8500 1.5 7 14 4 52 7471.7 27 2500 8500 1.5 7 14 4 38 7333.52 28 3000 9000 1.8 8 12 6 33 8081.71 29 2000 9000 1.2 8 12 2 43 8043.08 30 2000 8000 1.2 8 16 6 33 6498.42 31 3000 8000 1.8 8 16 2 43 6710.85 32 2500 8500 1.5 7 14 4 38 7333.52 33 2000 8000 1.8 8 12 2 43 6575.61 34 2500 8500 1.5 7 14 4 23 7185.47 35 2500 8500 1.5 7 14 -2 38 7315.82 36 2500 8500 1.5 7 14 6 38 7339.42
38 2000 9000 1.2 8 16 6 43 8067.12 39 2000 9000 1.2 8 12 6 33 7956.18 40 2000 9000 1.8 5 12 6 33 7958.71 41 2000 8000 1.2 5 12 6 33 6486.18 42 2500 8500 1.8 7 14 4 38 7334.78 43 2000 8000 1.2 8 12 6 43 6584.88 44 3000 9000 1.8 8 16 6 43 8192.65 45 2500 8500 1.5 7 14 4 38 7333.52 46 2000 8000 1.2 8 16 2 43 6585.32 47 2000 9000 1.8 8 12 2 33 7946.91 48 2000 8000 1.2 5 12 2 43 6573.08 49 2000 8000 1.8 5 12 2 33 6476.91 50 2500 8500 1.5 11 14 4 38 7333.52 51 2500 8500 1.5 3 14 4 38 7333.52 52 3000 8000 1.2 5 12 6 43 6707.88 53 3000 9000 1.2 8 12 2 33 8067.38 54 2500 8500 1.5 7 14 4 38 7333.52 55 2500 8500 1.5 7 14 4 38 7333.52 56 2000 9000 1.2 8 16 2 33 7956.62 57 2000 9000 1.8 8 16 2 43 8057.85 58 2000 9000 1.8 5 16 6 43 8069.65 59 2000 9000 1.2 5 12 6 43 8054.88 60 3000 9000 1.2 8 16 2 43 8178.32 61 3000 9000 1.8 5 16 6 33 8093.95 62 3000 9000 1.8 8 12 2 43 8168.61 63 2500 8500 1.5 7 14 4 38 7333.52 64 2000 8000 1.8 8 16 6 43 6599.65 65 4000 8500 1.5 7 14 4 38 7518.02 66 3000 8000 1.8 5 12 6 33 6611.71 67 2000 8000 1.8 8 16 2 33 6489.15 68 3000 8000 1.2 5 16 2 43 6708.32 69 3000 9000 1.2 8 12 6 43 8177.88 70 3000 8000 1.8 5 16 2 33 6612.15 71 2000 8000 1.8 5 12 6 43 6587.41 72 3000 8000 1.2 8 16 2 33 6609.62 73 3000 9000 1.8 5 12 6 43 8180.41 74 2000 8500 1.5 7 14 4 38 7272.02 75 2000 9000 1.8 8 12 6 43 8057.41 76 3000 8000 1.8 8 16 6 33 6623.95
77 3000 9000 1.2 5 12 6 33 8079.18 78 3000 8000 1.2 8 12 2 43 6696.08 79 2500 8500 1.5 7 19 4 38 7348.82 80 3000 8000 1.8 5 16 6 43 6722.65 81 2500 8500 1.5 7 14 4 38 7333.52 82 3000 8000 1.8 8 12 6 43 6710.41 83 2000 8000 1.2 8 12 2 33 6474.38 84 3000 8000 1.8 8 12 2 33 6599.91 85 2000 9000 1.2 5 16 6 33 7968.42 86 2500 8500 1.5 7 14 4 38 7333.52 87 2000 8000 1.2 5 16 2 33 6486.62 88 3000 8000 1.2 5 16 6 33 6621.42
The shear strength testing was done in a servo hydraulic Universal Testing machine at a constant cross-head speed of 1.31mm/min up to the final failure of the joint. Specimen failed Partially by pull out faiure mode under constant loading velocity. Eqaution 2 is regression equation P =-5905+0.123×f+1.47×I+4.21×T+0.000242×t +3.06×X+2.94×n+9.86×OL (2) Where, P=Shear Strength (N). f=Electrode force (N) I=Current (Amp) T=Thickness in mm t=Weld time (Cycle) X= Spot spacing (mm) n= Number of spots
OL=Overlapping Length. (mm)
IV RESULT AND DISCUSSION
According to the results of experimentations and regression analysis, effect of number of spot, distance between two spot, electrode force, weld current and specimen thickness is obtained. Scattered plots are drawn according to the design matrix RSMAll spots are failed at once due to axially applied load and it is uniformly distributed over sheet surface.
Weld time:-Current and electrode force are kept
constant while weld time is varied within a range 3 to 7 cycles. It is observed that there is large increase in strength after 5 cycles of welding .welds obtained between times 6 and 7 cycles are failed in nugget pullout failure mode as shown in Fig.3. Spot welds made at time range 3 -5 cycles fail in interfacial failure mode.
Fig.4 Relationship between weld time and shear strength
Electrode force:-It is observed that there is large
increase in strength after 5 cycles of welding .welds obtained between times 6 and 7 cycles are failed in
Table II Ranges of parameters
Sr.No
Parameters and
Designations
Level
Low Medium High
1 Force (F) 2000 2500 3000 2 Number of spots(n) 2 4 6 3 spot spacing (X) 12 14 16 4 Thickness(t) 1.2 1.5 1.8 5 Current(I) 8000 85000 9000 6 Welding time (Cycles) 5 7 8 7 Overlapping length 33 38 43
welds made at time range 3 -5 cycles fail in interfacial failure mode.
Fig.5 Electrode force Vs shear strength
It is observed that spot welds made at electrode force 5464.66 N fail in pull out failure mode and remaining welds fail in interfacial failure mode
.
Fig.6 .Pull out failure mode
A considerable bending of specimen is observed when component fails in pull out failure mode. Pull out failure of specimen is observed only at higher level of process parameters.
Number of spots: - All spots are failed at once due to
axially applied load and it is uniformly distributed over sheet surface. It is observed that there is significant increase in shear strength of spot weld when number of spot increase. Fig.7 shows relationship between number of spot and tensile shear strength of spot weld. Specimens having six number of spot but made at lower values of other parameters , got the strength 5002.63N.Spot welds made at lower level are failed in interfacial failure mode while spot welds made at higher level are failed at pullout failure mode. All spots were failed at once due to axially applied load and it is uniformly distributed over sheet surface.
Fig.7 Relationship between number of spots and shear strength
Spot welding current:-It is observed that there is
significant increase in shear strength of spot weld when spot welding current increases. Fig.8 shows relationship between spot welding current and shear strength of spot weld. Spot welds made at 9 Kamp current and having six number of spots, got the strength 7689.906N.Spot welds made at 9 Kamp current but having lower value of thickness and number of spot, got the strength 3073.97N.
Fig.8 Relationship between current and shear strength
Work piece thickness:-It is observed that there is
significant increase in shear strength of spot weld when specimen thickness increases. Fig.9 shows relationship between Specimen thickness and shear strength of spot weld. Spot welds made 1.22 mm thickness and having six numbers of spots, got the strength 7589.99N. It is observed that compromising with number of spots and increasing specimen thickness shear strength can be improved. Spot welds made 1.22mm thickness but having lower value of current and number of spot, got the strength 3507.99N.
Fig .9 Relationship between specimen thickness and shear strength
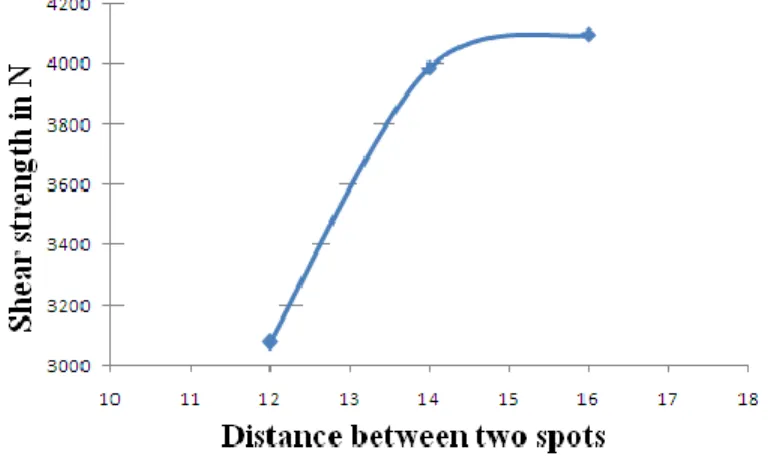
Spot spacing:-It is observed that there is significant
increase in shear strength of spot weld when distance between two spot decreases in between range 10mm-13mm.
Fig.11 Relationship between distance between spots and shear strength of spot weld
This is the least range at which there was no overlapping of two spots. Fig.11 shows relationship between distance between two spot and shear strength of spot weld. Spot welds made at distance 16 mm and
having six numbers
of spots, got the strength in between the range 8531.97N.
Fig 10 Relationship between Over lapping length and shear strength of spot weld
It is observed that up to certain range of distance between two spots, shear strength increases and after that strength decreases. Spot welds made 1.22mm thickness but having lower value of current and number of spot, got the strength 3776.97N. Tensile shear strength starts decreasing when distance between two spot is more than 18mm for six numbers of spots. It is observed that there is significant increase in shear strength of spot weld when specimen over length increases. Fig.10 shows relationship between Specimen over length and shear strength of spot weld. Spot welds made 45 mm over lapping length and having six numbers of spots, got the strength 7589.99N. It is observed that compromising with spot spacing and increasing specimen thickness shear strength can be
but having lower value of current and number of spot, got the strength 6507.99N. Fig.12 shows load verses displacement curves which are obtained by experiment and finite element method. Both curves are obtained at loading velocity 1.32 m/min and 2m/min. As far experimental results are considered, Strength increases by 1.318% as loading velocity increases from 1.32 to 2m/min. In finite element analysis, it is observed that strength increases by 1.597% as loading velocity varies from 1.32m/min to 2min/min. By comparing Strength values obtained through experimentation with Strength values obtained through FEM at loading velocity 2m/min, there is maximum deviation of 3.80%. By
comparing Strength values obtained through
experimentation with Strength values obtained through FEM at loading velocity 1.32 m/min, there is maximum deviation of 5.98%.reason for this is when load is applied rate of strain varies randomly .gradual increase in stain rate gives value of dynamic strength.
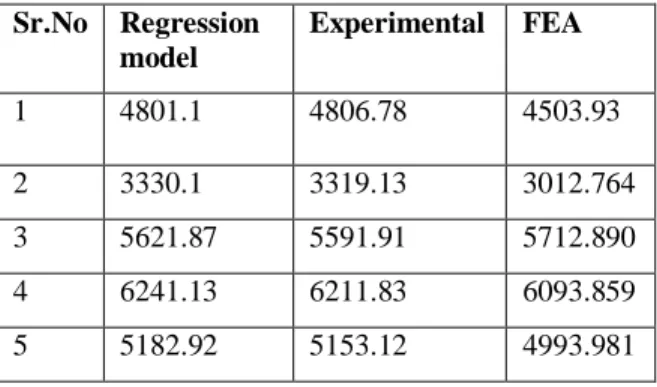
Table III Result of Confirmation test (P in N) Sr.No Regression model Experimental FEA 1 4801.1 4806.78 4503.93 2 3330.1 3319.13 3012.764 3 5621.87 5591.91 5712.890 4 6241.13 6211.83 6093.859 5 5182.92 5153.12 4993.981 IV CONCLUSION
The conclusions obtained are summarised as follow 1 finite element analysis of multi spot welded lap
shear specimen has been carried out and results obtained are validated by regression model as well as confirmation test.
2 The response surface methodology is used to
evaluate the effects of selected spot welding process and design parameters. It is an effective method used in the experimental design and the investigation for regression models between spot welding process and RSW quality of galvanized steel sheet.
3 The effect of selected welding process parameters and design parameters on the tensile–shear strength can be analysed on the basis of mathematical regression models of galvanized steel sheet and it can provide profitable reference to welding process devising as an assistant means.
4 The effect of number of spots on the shear strength
of spot weld is analysed. There is significant increase in the strength of spot weld as strength increases. Moreover, effects of distance between two spot and over lapping length on the strength of spot weld have been analysed. This study helps to find optimum number of spots, over lapping length and optimum distance between two spot.
REFERENCES
[1]. V.X. Trana, J. Pana,, T. Panb, “Effects of Processing Time on Strengths and Failure Modes of Dissimilar Spot Friction Welds Between Aluminum 5754-O and 7075-T6 Sheets” J materials processing technology 209(2009)3724–3739. [2]. Luo Yi a,b,, Liu Jinhe , Xu Huibin , Xiong
Chengzhi , Liu Lin , “Regression Modeling And Process Analysis Of Resistance Spot Welding On Galvanized Steel Sheet”. Materials and Design 30 (2009) 2547–2555
[3]. A.M. Pereira, J.M. Ferreira . A. Loureiro, J.D.M. Costa , P.J. Bártolo, “Effect of Process Parameters on The Strength of Resistance Spot Welds In
6082-T6 Aluminium Alloy”. Materials and
Design31(2010)2454–2463
[4]. A.G Thakur and V.M Nandedakar, “Application of Taguchi Method to Determine Resistance Spot Welding Conditions. of Austenitic Stainless Steel AISI304”,Journal of scientific research Vol No.69 ,Septmber 2010 pp.680-683.
[5]. G. Mukhopadhyay .S. Bhattacharya b, K.K. Ray a, “Effect of Pre-Strain on The Strength of Spot-Welds”. Materials and Design 30 (2009) 2345– 2354.
[6]. M. Vural , A. Akkus¸, B. Eryurek, “Effect of Welding Nugget Diameter on The Fatigue Strength of The Resistance Spot Welded Joints of Different Steel Sheets”. J Materials Processing Technology 176 (2006) 127–132.
[7]. M. Pouranvari , S.M. Mousavizadeh , S.P.H. Marashi , M. Goodarzi , M. Ghorbani , “Influence of Fusion Zone Size And Failure Mode on Mechanical Performance of Dissimilar Resistance Spot Welds of AISI 1008 Low Carbon Steel And DP600 Advanced High Strength Steel”.J Materials and Design xxx (2010) xxx–xxx.
[8]. S.M. Darwish*, S.D. Al-Dekhial, “Statistical Models For Spot Welding Of Commercial Aluminium Sheets”, International Journal of Machine Tools & Manufacture 39 (1999) 1589– 1610.