Abstract—Monitoring the stability of the software process in the lower level companies is a challenging issue to software engineers. In this paper, SPC is applied to software metrics. Defect Density, Review Performance and Rework percentage and results after applying the SPC to various processes of software are discussed and analyzed, using control charts,the most sophisticated tools of SPC. The difficulties in the application of Statistical Process Control to lower level software organization are observed and relevant suggestions are provided.
Index Terms—Control Chart, Statistical Process control (SPC), Defect density, Inspection Performance, Rework percentage, CMM.
1 INTRODUCTION
The impact of software in today’s culture and society is enormous and its importance is expected to grow. This growth forces the software community to develop technologies/methods that will help the organizations to build high-quality programs that are less expensive and easier to develop and maintain.
A solution that is adapted by software industries for maintaining and improving the software processes is called Statistical Process Control (SPC). SPC is a set of tools for managing the processes, and hence, determining and monitoring the quality of the outputs of an organization. SPC is a time-tested and effective control scheme used for process capability analysis and process monitoring. Even though, SPC is used since 1930 with the idea of applying SPC to software development it became effective only from the middle years of 1990’s. Earlier, it was mainly used by the manufacturing companies; but today, it is involved in the software development companies too.
G Vijaya,Associate Professor,KGiSL Institute of Technology,Anna University ,Coimbatore,Tamilnadu,India-641015,Phone:919894271312,
email:[email protected] S Arumugam, Chief Executive Officer,Nandha Engineering
College,Erode,TamilNadu,India ,email:[email protected]
2 CMM LEVEL AND SPC
The Software Engineering Institute (SEI) and Capability Maturity Model (CMM) mandate that SPC can be used in Level 4 organizations. As the maturity process of software organization is too long, many organizations stopped using SPC [20]. It would imply that emerging organizations have to wait till they reach maturity stage before applying SPC techniques to their software processes.
It is possible to perform SPC in CMM level 1[13]. The authors base their claim on the idea that if a process is defined and performed consistently, the outcome of SPC would be meaningful. Presently a case study is performed on the application of SPC techniques using existing measurement data in a CMM Level 3 software organization. The control chart (‘u’ chart) with 3-sigma control limits is used to demonstrate the practical evidence on the utilization of SPC.
The application of SPC techniques for software is rare due to prerequisites such as high maturity, rational sampling, and effective metric selection. The existing study reports result from their own implementations and provide suggestions for success. During this study, approaches used for assessing the suitability of software process and metrics for starting SPC implementation via control charts are assessed. The approach includes the guidance given to identify rational samples of a process and ways to select process metrics.
This paper gives the solution to the problem of CMM Level 3companies as to how they could manage their processes using control charts with three sigma limits.
3 SIGNIFICANCE OF THE RESEARCH
The study relied on the case study method. This method was found to be useful in low level companies to achieve the CMM level 4. Three software metrics, namely defect density, inspection performance and rework percentage were selected. The metric data were collected from the trouble report of requirement documents and design documents. A total of seven projects were selected for SPC analysis. From the results obtained, a set of guidelines were formulated to help the programmers, analysts and organizations to use SPC in their organizations successfully.
Utilization of Statistical Process Control in
Defined Level Software Companies to Manage
Processes Using Control Charts with Three
Sigma
As per the CMM level standards, SPC can’t be utilized in lower level companies to maintain the process stability. Three metrics have been selected and analyzed for the existing data in the CMM level 3 companies and it was found from the analysis that it can be applied for low level companies.
4 ANALYSIS AND INTERPRETATION
U-chart and 3-sigma limits are used extensively in the
present study. U-chart is a data analysis technique for determining if a measurement process has gone out of statistical control. The u-chart is sensitive to changes in the normalized number of defective items in the measurement process. Here, ‘normalized’ means the result of number of defectives divided by the unit area. The U in u-chart stands for units as in defectives per lot. The U-control chart consists of:
Vertical axis = the normalized number of defectives (number of defectives/area for sub-group = u) for each sub-group;
Horizontal axis = sub-group designation.
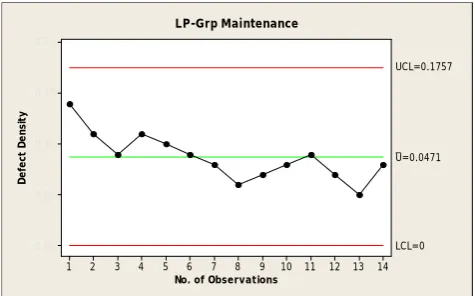
A sub-group is a time sequence frequently (e.g., the number of defectives in a daily production runs where each day is considered a subgroup). If the times are equally spaced, the horizontal axis variable can be generated as a sequence. U charts consist of three guidelines, centre line, a lower control limit and an upper control limit. The center line is the average number of occurrences-per-unit and the two control limits are set at plus and minus three standard deviation. If the process is in the statistical control, virtually all subgroup occurrences-per-unit should be between the control limits and they should fluctuate at random about the center line. The sample control chart is given below in Fig 1.
No. of Observations
De
fe
ct
D
e
n
si
ty
14 13 12 11 10 9 8 7 6 5 4 3 2 1
0.20
0.15
0.10
0.05
0.00
_ U=0.0471 UCL=0.1757
LCL=0 LP-Grp Maintenance
Fig1 Sample Control Chart
Presently, eight tests were defined to identify out of control software processes and are given in Table I.
4.1 Defect Density
Defect density data was obtained from the review, test and audit meetings. Data were obtained mainly through Trouble Reports. Two types of defects were considered.
These defects were obtained from the requirements and design documents. The data collected were restricted to requirementsand design documents and were obtained from documents listed below.
1. Software Requirements Specification and IRS-Interface Requirements Specification)
2. Design Documents (SDD and IDD): The number of pages used to compute size. (SDD- Software Design Description and IDD-Interface Design Description)
[image:2.595.46.284.476.624.2]3. Requirements documents (SRS and IRS): The number of requirements is used to compute size. (SRS- Problem Reports and Document Change Request (DCR) Reports were the two main sources of defect data collection reports for code and document defects respectively.
TABLE I TEST DEFINITIONS
The reports show basic information like work product, related project phase, defect priority, initiation and closure dates. Defect density is consolidated according to the priority assigned to it.
There are five priority levels maintained by the company, namely, Urgent, High, Medium, Low and Not Applicable. As the number of samples with Urgent priority is very small and is insufficient for SPC analysis, Urgent and High priorities are grouped together. The ‘Not Applicable’ priority is assigned to defects that are not related to the project and hence are ignored during defect density calculation. Thus, during consolidation, the defect priorities are grouped into three main categories, namely, ‘High (HP-Grp), ‘Medium’ (MP-Grp) and ‘Low’ (LP-Grp). Few graphs of metric defect density are presented for analysis and interpretation.
4.1.1 Requirements Documents
4.1.1.1 HP-Grp: Implementation and Maintenance
Figure A.1 shows the control chart for HP-Grp defects (High Priority Defects) obtained from defect density measures of requirement documents for implementation phase and it can be noted that there are two situations which show deviations from centre line.
Situation 1: Test Failed at points: 5, 6 (Test No. 1) Test
No K Definition
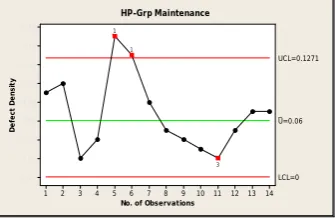
A similar pattern is observed in the maintenance phase also (Figure A.2). The control chart takes into consideration the defects obtained from the IRS and SRS documents for all the seven projects selected.
No. of Observations
[image:3.595.334.510.120.231.2]De fe ct D e n sit y 14 13 12 11 10 9 8 7 6 5 4 3 2 1 0.16 0.14 0.12 0.10 0.08 0.06 0.04 0.02 0.00 _ U=0.06 UCL=0.1271 LCL=0 3 1 1 HP-Grp Implementation
Fig A.1: HP-Grp Implementation (Requirement Documents)
No. of Observations
De fe ct De n sit y 14 13 12 11 10 9 8 7 6 5 4 3 2 1 0.16 0.14 0.12 0.10 0.08 0.06 0.04 0.02 0.00 _ U=0.06 UCL=0.1271 LCL=0 3 1 1 HP-Grp Maintenance
Fig A.2: HP-Grp Maintenance (Requirement Documents)
4.1.1.2 Interpretation
As per the fig A.1, the points 5 and 6 refer to project 3 IRS and SRS respectively, while point 11 refers to project 6 IRS document. While trying to find the reason for such behaviour, it is found that both project 3 and 6 are from the same customer and the company is lenient towards their demand for new additions and modifications during requirement analysis phase. Modifications and requirements are done according to the adhoc requests and these are reflected in future defects in requirement documents.
4.1.2 Design Documents
Design defects result from bad design practices and are bad solutions for recurring design problems. They include problems ranging from high-level and design problems, such as antipatterns, to low-level or local problems, such as bad coding practice (Parez, 2008). In the present work, the problem reports are used to obtain the defects from Software Design and Interface Design phases. This section explains the application of control charts to design document defects. The number of documents are consolidated into three groups, HP-Grp, MP-Grp and LP-Grp consolidated according to their priority. As mentioned earlier, these data are collected from the SDD and IDD documents and as the data are collected cumulatively from one phase to the other, the graphs for implementation and maintenance phases looked quite alike.
4.1.2.1 HP-Grp : Implementation and Maintenance
Figures A.3 and A.4 show the control charts for High priority group obtained from Software and Interface Design Documents.
No. of Documents
De fe ct D e n si ty 10 5 1 0.30 0.25 0.20 0.15 0.10 0.05 0.00 _ U=0.1336 UCL=0.2432 LCL=0.0239 1 1 1
HP-Grp - Implementation
[image:3.595.87.255.259.368.2]Fig. A.3 : HP-Grp Implementation (Design Documents)
No. of Documents
De fe ct De n si ty 10 5 1 0.30 0.25 0.20 0.15 0.10 0.05 0.00 _ U=0.1336 UCL=0.2432 LCL=0.0239 1 1 1
HP-Grp - Maintenance
Fig. A.4: HP-Grp Maintenance (Design Documents) In the figure A.3 and A.4, points 1, 2 and 14 are depicted as out of control limit conditions as they failed in Test No. 1 with deviations from centre line. These points belong to the SDD and IDD of Project 1 and IDD of Project 14.
4.1.2.2 Interpretation
While investigating the reason for the deviations located in the figures 4.3 and 4.4, it is found that there are major structural changes in Project 1 and 7 system level documents and the software components are divided into different builds and this results in a high defect density. When the components are divided, the integration needed between subsequent builds also becomes complex and products turn out to be more defective. The next reason is that the staff turn over rate is high for project 1 and 14, which is another important reason for high defect density. The frequent change in staff team is because both the projects are in-house projects, and are frequently interrupted. These interruptions show high time delay during the development process. The same trend is observed for HP-Grp maintenance also. Obtaining similar charts prove that most of the defects in this group are detected before maintenance phase itself.
[image:3.595.334.505.268.379.2]5 CASE STUDY RESULTS
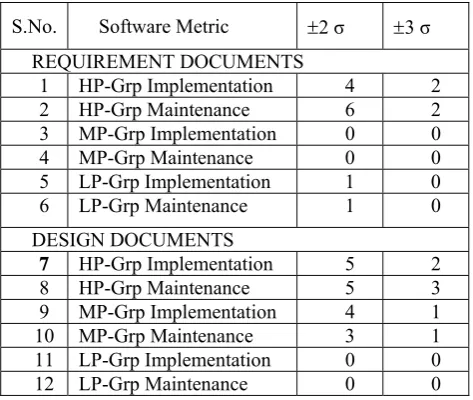
[image:4.595.51.288.225.425.2]The research work uses 3-sigma to calculate the upper and lower limits to draw a control chart. To evaluate the performance efficiency obtained by using 3-sigma limits, all the experiments are conducted twice, with 3-sigma limits and with 2 standard deviation limits. The experiments are conducted with all the three metrics. Results obtained for each of the metrics selected are consolidated according to the number of tests failed and presented in Table 2, 3 and 4 for metrics defect density, inspection performance and rework percentage respectively.
Table 2 Defect Density
S.No. Software Metric 2 σ 3 σ REQUIREMENT DOCUMENTS
1 HP-Grp Implementation 4 2 2 HP-Grp Maintenance 6 2
3 MP-Grp Implementation 0 0
4 MP-Grp Maintenance 0 0 5 LP-Grp Implementation 1 0
6 LP-Grp Maintenance 1 0
DESIGN DOCUMENTS
7 HP-Grp Implementation 5 2 8 HP-Grp Maintenance 5 3
9 MP-Grp Implementation 4 1
10 MP-Grp Maintenance 3 1 11 LP-Grp Implementation 0 0 12 LP-Grp Maintenance 0 0
Table 3 Inspection Performance
S.No. Software Metric 2 σ 3 σ INITIAL REVIEW
1 SDD 1 1
2 UITD 0 0
3 Code 14 7
ADDITIONAL REVIEW
4 SDD 9 5
5 UITD 2 0
[image:4.595.56.282.472.636.2]6 Code 12 6
Table 4 Rework Percentage Project
No
Code Rework Document Rework
2 σ 3 σ 2 σ 3 σ
1 4 3 4 2 2 1 0 0 0 3 0 0 0 0 4 2 0 3 0 5 4 0 6 0 6 0 0 0 0 7 1 0 8 2
Two kinds of mistakes are commonly encountered while using control charts with SPC. The first is the mistaken identity of common cause as special cause variation and the second is the mistaken identification of special cause variation as a common cause variation. Both situations of mistaken identification are costly and will result in substandard software product. In either case, the economic loss is large and the creation of substandard software product is inevitable. From the results shown, it is evident that the usage of 3-sigma minimizes the number of false alarms, thus indirectly reducing the total cost from both overcorrecting and under-correcting.
6 CONCLUSION
The study provides a practical insight into whether it is necessary and sufficient to have a high maturity level for successful SPC implementation. Some metric data are collected when the organization is at CMM Level 2 and the results produced for these data are also successful. This proves that a high maturity level might not be necessary for utilizing SPC in a software organization. The following are determined:
1. What the core process are; 2. Whether they are in control;
3. Measuring the behavior of the processes not under control
4. Using different types of control charts to different applications
5. Interpreting the variation
6. Developing strategies to reduce variation. Experiments proved that the charts are efficient in monitoring the process stability and can be used by lower level software industries. And also the results explicitly show that the lower level companies need not wait for the Maturity period to achieve CMM level 4.
REFERENCES
[1] Sutherland, J., Devor, R., Chang, T., Statistical Quality Design and Control. Prentice Hall Publishing Company, 1992. ISBN:
002329180X.
[2] Card, D., “Statistical Process Control for Software?” IEEE Software, May 1994, PP 95-97.
[3] Kan, S. H., Metrics and Models in Software Quality Engineering. Addison-Wesley Publishing Company, 1995. ISBN 0-201-63339-6. [4] Crosby, P.B., Quality is Free: The Art of Making Quality Certain,
Penguin Book USA Inc, January 1980. ISBN: 0-451-62585-4. [5] Paulk, M. C., Curtis, B., Chrissis, M. B., Weber, C. V. Capability
Maturity Model for Software, Version 1.1 (CMU/SEI-93-TR-024, ADA 263403).Pittsburgh, PA: Software Engineering Institute, Carnegie
Mellon University,1993.
[6] Carleton, A., “Statistical Process Control for Software (Software Technology Review)”. Carnegie Mellon University, 2001. (URL: http://www.sei.cmu.edu/ str/descriptions/spc_body.html).
[7] Florac, A.W., Carleton A.D., Measuring the Software Process: Statistical Process Control for Software Process Improvement.
Pearson Education,1999. ISBN 0-201-60444-2.
[8] Florac, A.W., Carleton A.D., “Statistically Controlling the Software Process (The 99 SEI Software Engineering Symposium)”, September
1999, Software Engineering Institute, Carnegie Mellon University. [9] Florac, A.W., Carleton A.D., Barnard, J.R., “I”. IEEE
Improvement (CMU/SEI-97-HB-003).Software Engineering Institute, Carnegie Mellon University, April 1997.
[11] Jakolte, P., Saxena, A., “Optimum Control Limits for Employing Statistical Process Control in Software Process”. IEEE Transactions
on Software Engineering, Vol: 28, No: 12, December 2002, PP 1126-1134.
[12] Romine, J., “Using Statistical Techniques to Manage Software Projects with Data”, SEPG 2002 Conference, February 18-21, 2002.
[13] Radice, R., “Statistical Process Control for Software Projects”. 10th
Software Engineering Process Group Conference. Chicago, Illinois. March 1998.
[13] Weller, E., “Practical Applications of Statistical Process Control”. IEEE Software, May/June 2000, PP 48-55.
[14] Humphrey, W., Managing the Software Process. Reading, Mass.:
Addison-Wesley Publishing Company, 1989. ISBN 0-201-18095-2.117.
[15] Paulk, M. C., Chrissis, M. B., “The 2001 High Maturity Workshop,(CMU/SEI 2001-SR-014)”. Carnegie Mellon University,
January 2002.
[16] Shewhart, W.A., Statistical Method: From the Viewpoint of Quality Control, Lancaster Press Inc., 1939.
[17] Deming, W.E., Out of the Crisis, First MIT Press, 2000. ISBN: 0-262-54115-7.
[18] Fenton, N.E., Pfleeger, S.L., Software Metrics. PWS Publishing
Company, 1997. ISBN 0-534-95425-1.
[19] Fenton, N.E., Neil M., “Software Metrics: successes, failures and new directions”. The Journal of Systems and Software, 47, 1999, PP
149-157.