THE EFFECT OF TOPOGRAPHY ON BUILDING STRUCTURES IN URBAN SUBDIVISION UTILIZING
COMPUTATIONAL FLUID DYNAMICS FOR CRITICAL WIND PRESSURE DETERMINATION
Philippine
ARTICLE INFO ABSTRACT
The topography was established using Autodesk Revit with reference to Google Earth. The mathematical model was formulated wit
dimensional form into a simplified and corrected momentum and pressure equations. The maximum positive and negative wind pressures were obtained from 180° south wind attack angle and critical wind pressures were obtained from the maximum negative wind pressures. Topography in terms of elevation showed that the recorded wind pressure of elevated houses are higher than those situated on the non
simulated pressure also increases. The higher the simulation resolution, the more detailed and accurate are the results.
Copyright © 2018, Bonifacio Jr Aznar. This is an open distribution, and reproduction in any medium, provided
INTRODUCTION
Wind is one of the important forces of nature that must be considered in any structural design. Its actual behavior is influe only by the surface conditions, but also by the geometry of a structure. All types of turbulent effects occu
edges and roof eaves of a structure. Some of these effects are accounted for by the wind pressure coefficients (Cui, 2007). W flow generation has different types of forms, examples of these are gales and monosonic winds, cyclon
tornados, thunderstorms and localized storms depending on the location and the importance of the structures being designed (Bhandari, Krishna and Kumar, 2011). Hurricane winds destroy buildings and structures around the world such
commercial and industrial buildings. Boudreau (2009) mentioned that majority of the growing population in the United States lived in open terrains and coastal areas. Based on his findings, there is therefore an increasing need to conduct f
pertaining to hurricanes. Typhoon Haiyan, otherwise known as Super Typhoon Yolanda in the Philippines, was the strongest stor recorded at landfall with a maximum sustained wind of 315 kph. With this extremely high wind speed, Typhoon Haiy reported to have claimed the lives of at least 6300 people and an estimated damage of $219.5 million to infrastructure alone (National Disaster Risk Reduction and Management Council [NDRRMC], 2014). In Mindanao which is located at the southern part of the Philippines, past and current practices consider dead load and live load only in the design of structures, particularl roofing. The National Structural Code of the Philippines (NSCP) requires wind load analysis to be considered in the structura design of roofs. This is done in order to prevent further destruction caused by super typhoons, that even exceed the maximum allowable wind velocity as provided in the NSCP 2010 edition.
minimum design requirements. However, these provisions are limited to general conditions. Projects that go beyond the basic parameters of these standards require wind tunnel testing or wind simulation. To save on cost and time, wind pressures and wi loads can be determined with the use of computer
Computational Fluid Dynamics (CFD) (Gallant, 2014). However, the main focus of this study is the CFD Flow Design simulation software. Computational Fluid Dynamics (CFD) has become a very useful tool in analyzing wind flows instantly. It is able to solve mathematical models accurately for any type of structure. Moreover, it is able to analyze results which can be used for design optimization (Kerklaan, 2006).
ISSN: 0975-833X
Article History:
Received 08th March, 2018 Received in revised form 24th April, 2018 Accepted 19th May, 2018 Published online 30th June, 2018
Citation: Bonifacio Jr Aznar. 2018. “The effect of topography on building structures in urban wind pressure determination”, International Journal of
Key words:
Computational Fluid Dynamics, Critical wind Pressure, Revit, Topography, Urban Subdivision, Philippines.
*Corresponding author
RESEARCH ARTICLE
THE EFFECT OF TOPOGRAPHY ON BUILDING STRUCTURES IN URBAN SUBDIVISION UTILIZING
COMPUTATIONAL FLUID DYNAMICS FOR CRITICAL WIND PRESSURE DETERMINATION
*
Bonifacio Jr Aznar
Philippine Institute of Civil Engineers, Philippines
ABSTRACT
The topography was established using Autodesk Revit with reference to Google Earth. The mathematical model was formulated with the discretization of the Navier
dimensional form into a simplified and corrected momentum and pressure equations. The maximum positive and negative wind pressures were obtained from 180° south wind attack angle and critical pressures were obtained from the maximum negative wind pressures. Topography in terms of elevation showed that the recorded wind pressure of elevated houses are higher than those situated on the non-elevated areas. As the velocity profile and elevation of
simulated pressure also increases. The higher the simulation resolution, the more detailed and accurate are the results.
access article distributed under the Creative Commons Attribution the original work is properly cited.
Wind is one of the important forces of nature that must be considered in any structural design. Its actual behavior is influe only by the surface conditions, but also by the geometry of a structure. All types of turbulent effects occu
edges and roof eaves of a structure. Some of these effects are accounted for by the wind pressure coefficients (Cui, 2007). W flow generation has different types of forms, examples of these are gales and monosonic winds, cyclon
tornados, thunderstorms and localized storms depending on the location and the importance of the structures being designed Hurricane winds destroy buildings and structures around the world such
commercial and industrial buildings. Boudreau (2009) mentioned that majority of the growing population in the United States lived in open terrains and coastal areas. Based on his findings, there is therefore an increasing need to conduct f
pertaining to hurricanes. Typhoon Haiyan, otherwise known as Super Typhoon Yolanda in the Philippines, was the strongest stor recorded at landfall with a maximum sustained wind of 315 kph. With this extremely high wind speed, Typhoon Haiy reported to have claimed the lives of at least 6300 people and an estimated damage of $219.5 million to infrastructure alone (National Disaster Risk Reduction and Management Council [NDRRMC], 2014). In Mindanao which is located at the southern
of the Philippines, past and current practices consider dead load and live load only in the design of structures, particularl roofing. The National Structural Code of the Philippines (NSCP) requires wind load analysis to be considered in the structura design of roofs. This is done in order to prevent further destruction caused by super typhoons, that even exceed the maximum allowable wind velocity as provided in the NSCP 2010 edition. Detailed codes and specifications are necessary in determining the inimum design requirements. However, these provisions are limited to general conditions. Projects that go beyond the basic parameters of these standards require wind tunnel testing or wind simulation. To save on cost and time, wind pressures and wi
can be determined with the use of computer-aided simulation softwares, such as: SolidWorks, Robot Structural Analysis and Computational Fluid Dynamics (CFD) (Gallant, 2014). However, the main focus of this study is the CFD Flow Design simulation Computational Fluid Dynamics (CFD) has become a very useful tool in analyzing wind flows instantly. It is able to solve mathematical models accurately for any type of structure. Moreover, it is able to analyze results which can be used for
International Journal of Current Research
Vol. 10, Issue, 06, pp.70514-70527, June, 2018
The effect of topography on building structures in urban subdivision utilizing computational fluid dynamics for critical
of Current Research, 10, (06), 70514-70527. Available online at http://www.journalcra.com
z
THE EFFECT OF TOPOGRAPHY ON BUILDING STRUCTURES IN URBAN SUBDIVISION UTILIZING
COMPUTATIONAL FLUID DYNAMICS FOR CRITICAL WIND PRESSURE DETERMINATION
The topography was established using Autodesk Revit with reference to Google Earth. The h the discretization of the Navier-Stokes equation in three dimensional form into a simplified and corrected momentum and pressure equations. The maximum positive and negative wind pressures were obtained from 180° south wind attack angle and critical pressures were obtained from the maximum negative wind pressures. Topography in terms of elevation showed that the recorded wind pressure of elevated houses are higher than those situated on elevated areas. As the velocity profile and elevation of the topography increases, the simulated pressure also increases. The higher the simulation resolution, the more detailed and
ribution License, which permits unrestricted use,
Wind is one of the important forces of nature that must be considered in any structural design. Its actual behavior is influenced not only by the surface conditions, but also by the geometry of a structure. All types of turbulent effects occur, especially at corners, edges and roof eaves of a structure. Some of these effects are accounted for by the wind pressure coefficients (Cui, 2007). Wind flow generation has different types of forms, examples of these are gales and monosonic winds, cyclones/hurricanes/typhoons, tornados, thunderstorms and localized storms depending on the location and the importance of the structures being designed Hurricane winds destroy buildings and structures around the world such as residential, commercial and industrial buildings. Boudreau (2009) mentioned that majority of the growing population in the United States lived in open terrains and coastal areas. Based on his findings, there is therefore an increasing need to conduct future researches pertaining to hurricanes. Typhoon Haiyan, otherwise known as Super Typhoon Yolanda in the Philippines, was the strongest storm recorded at landfall with a maximum sustained wind of 315 kph. With this extremely high wind speed, Typhoon Haiyan was reported to have claimed the lives of at least 6300 people and an estimated damage of $219.5 million to infrastructure alone (National Disaster Risk Reduction and Management Council [NDRRMC], 2014). In Mindanao which is located at the southern of the Philippines, past and current practices consider dead load and live load only in the design of structures, particularly in roofing. The National Structural Code of the Philippines (NSCP) requires wind load analysis to be considered in the structural design of roofs. This is done in order to prevent further destruction caused by super typhoons, that even exceed the maximum Detailed codes and specifications are necessary in determining the inimum design requirements. However, these provisions are limited to general conditions. Projects that go beyond the basic parameters of these standards require wind tunnel testing or wind simulation. To save on cost and time, wind pressures and wind aided simulation softwares, such as: SolidWorks, Robot Structural Analysis and Computational Fluid Dynamics (CFD) (Gallant, 2014). However, the main focus of this study is the CFD Flow Design simulation Computational Fluid Dynamics (CFD) has become a very useful tool in analyzing wind flows instantly. It is able to solve mathematical models accurately for any type of structure. Moreover, it is able to analyze results which can be used for
INTERNATIONAL JOURNAL OF CURRENT RESEARCH
These results would lead to a more efficient structural design. Reiter (2008) states that CFD simulation programs have a huge advantage over wind tunnel tests. Through the use of CFD simulation programs, both quantitative and qualitative wind flow representation of the entire volume can be obtained. Results of these simulation programs can be used as a structural design reference. Accuracy of these tools can be proven in correlation with the following: field test results, current NSCP wind specifications and theoretical concepts. In this study, the CFD Flow Design 2014 virtual wind simulation program and Autodesk Revit Building Information Modeling 2015 were utilized in order to simulate the different wind velocities affecting the topography of a sample urban subdivision. They were also used to determine the critical wind pressures of the building structures as reference for structural design. This study is unique compared to other studies since the software used in mathematical modeling and wind simulation was new in the locality. The purpose of this study is to determine the effect of topography on building structures in urban subdivision utilizing computational fluid dynamics for critical wind pressure determination. Specifically, it has the following objectives:
To establish the topography of sample subdivision;
To formulate a mathematical model as input to CFD;
To conduct simulations for varying wind velocities affecting the topography of sample subdivision; and,
To determine the critical wind pressures of the building structures of sample subdivision.
Review of Related Literature
Wind Engineering on Structures: Wind engineering is a field in structural engineering that has been evolving over the centuries. Over 350 years ago, Torricelli invented the barometer to measure air pressure. This invention was considered as the first step in wind engineering. Measurements of the actual wind flows to predict the forces transferred to engineered structures with the use of wind tunnels in either actual or virtual was the core in wind engineering (Boudreau, 2009). The high degree of industrialization and speedy construction were the reasons why light-weight gable roof buildings had been extensively used in low-rise commercial and industrial buildings. However, their relatively light dead load and flexibility made them most vulnerable to wind load which was considered as a significant type of load in structural design (Jing and Li, 2013). These factors led to the development of various building codes relative to wind loads across the world as a design tool for structural engineers. Accurate knowledge of wind pressure and its coefficients on the walls and roofs of structures are necessary for the design of wind-resistant structures. Holmes (1994) investigated wind pressure characteristics acting on the walls and roofs of gable-roofed houses. He took into consideration the effects of elevation, roof pitch and grouping of buildings on the external pressures. The characteristics of long low-rise structures with gable roofs on the large aspect ratio were studied by Kanda and Maruta (1993). They discovered that the large negative values of mean wind pressure and peak wind pressure were generated on the leeward surface for a 45° wind attack angle. They concluded that the main sources of large negative wind pressure values were generated on the leeward side of a structure.
Meecham, Surry and Davenport (1991) evaluated the performances of gabled roof and hip roof building models. They reported the dominance of hip roof over gabled roof. Their statement was based on the result that the peak pressure on the hip roof was reduced by about 50% compared to that of the gabled roof. Holmes (1986) conducted a study on the effects of the elevation of houses and the roof pitch. His findings revealed that elevated houses performed worse than the non-elevated ones considering the same roof pitch. The 15° roof pitch recorded all negative wind pressure coefficients, while the 20° and 30° pitch had near zero and almost zero on the windward side of the roof, respectively. Prasad, Uliate and Ahmed (2008) investigated the effects of wind loads on low-rise building models. He identified the best roof configuration and found out that suction for the flat roof was the worst among the nine models. He added that the hip roof models performed better than the gabled roof models which had a 42% recorded reduction in the peak suction.
wind tunnel results was presented by Endalew et al. (2009). In their study, they found that the simulation result was congruent with the average longitudinal velocity measurements having 92% minimum accuracy. The main disadvantage was that the flow problems being solved were based on theoretical models rather than on actual flow data as compared to full-scale wind tunnel models of rooftop wind flows. Araujo, de Alencar Valenca, Asibor and Rosas (2012) simulated wind flow fields around an urban environment. The objective of this simulation was to evaluate the significant impact of buildings on the wind flow patterns and power production for the current generation of wind turbines or wind mills. The roughness, topography and volumetry of buildings were considered in the simulation of the urban environment. Results showed that the simulation identified zones for potential wind sources which were not detected in classical wind atlas. Wakes, Maegli, Dickinson and Hilton (2009) studied the numerical modeling of wind flow over a complex topography for land planning purposes. This research established the numerical simulation techniques which can be used for predictive purposes. Mohotti, Mendis and Ngo (2014) studied the application of CFD in predicting the wind loads on tall buildings.
They stated that the rapid growth of CFD programs over the last few decades enabled engineers and designers to simulate wind behavior and predict wind loads on buildings, and becomes necessary especially at the preliminary design stage. CFD application for the analysis of complex urban environments was greatly improved with the increased Central Processing Unit power or memory. An accurate CFD simulation is dependent on the quality and complexity of the computational grid or mesh. A Geographic Information System (GIS) data of an urban environment can be transferred to this computational grid and utilized for simulation (Labovsky and Jelemensky, 2013). Ahmad, Muzzammil and Zaheer (2011) conducted numerical simulation of wind loads on low buildings. The simulation of the environment involved the full-scale Reynolds number, boundary layer and turbulence properties. He compared the wind loading effect of the flat roof and pitched roof using both wind simulation and wind tunnel test. Results showed that there is a fair agreement between the wind simulation and wind tunnel test on buildings. It also showed that the numerical simulation of wind loads hold a great potential in extending codes for wind loads.
Montazeri and Blocken (2013) studied on the CFD simulation of wind-induced pressure coefficients on buildings with and without balconies. Their study presented a systematic evaluation of 3D steady Reynolds Averaged Navier Stokes (RANS) CFD. It was conducted in order to predict the wind pressure distributions on the windward and leeward surfaces of a medium-rise building with and without balconies. Findings revealed that RANS, can accurately reproduce the wind pressure distribution across the windward face of the building with the average deviations from the wind tunnel measurements of 12% and 10% for the building with and without balconies, respectively. Computational evaluation of wind loads on buildings were studied by Dagnew and Bitsuamlak (2012). They reviewed the CFD numerical evaluation of wind loads on buildings. They also reported the advantages of LES over RANS and hybrid RANS-LES over LES. They added that LES based simulations seem suitable for wind load evaluation and that the numerical and experimental wind load evaluation on buildings were in good agreements on the mean values. Wind tunnel simulations were employed by Lee, Park and Kang (2009). They utilized these simulations in evaluating the wind environment around a tested residential area located near industrial complexes.
They reported that in the upper region, the velocity fluctuations increased and in the near surface layer the wind speed decreased due to the presence of hills and high rise structures around the simulated area. Hang, Sandberg and Li (2009) studied the effect of urban morphology on wind condition in idealized city models. These includes round, square and long rectangular city model with a developed steady flow region along the main street. They also found that a weaker wind was observed in the street of the square city model than that observed in the round city model. Meanwhile, a steady horizontal flow along the street with an approximate fully developed region was observed in the long rectangular city model. Computational Wind Engineering (CWE) over the years had grown to a strongly established field in wind engineering practice, education and research. It was used daily by thousands of practitioners, instructors and researchers around the world (Assaad, 2015). CFD Flow Design is widely recognized as a simple CFD, due to its less setup options and interoperability with other autodesk softwares, such as: revit and autocad 3ds max. It is also commonly used in analyzing external wind pressure that serves as a good reference in calculating external wind loads for structural design purposes (Autodeskcfd-fd, 2015). Broekhuizen (2016) compared the 2D and 3D simulation using CFD Flow Design. He observed that 3D simulation provided a more accurate result compared to 2D simulation due to its environmental complexity. He also found out that the quality of the simulation could be set from 50% to 400%, wherein higher resolution means a more detailed and accurate but slower simulation. Autodeskcfd-fd (2015) reported that the quality of the simulation depended on the simulation resolution. The lower the resolution the faster but less detailed and less accurate was the simulation. On the other hand, the higher the resolution the slower but the more detailed and more accurate was the simulation. Autodeskcfd-fd (2015) also added that the simulation resolution was dependent upon the Random Access Memory (RAM) resources of a computer. The higher the RAM the higher was the simulation resolution. This study is aimed to use the Computational Fluid Dynamics (CFD) Flow Design virtual wind simulation. This will be used for the mathematical and building models subjected to different wind velocities affecting the topography of a sample subdivision. It also aimed to determine the critical wind pressure of the structures as reference/basis for structural design, particularly in roofing.
Significance of the study: Through this study, engineers and designers would be able to use a wind simulation software that considered all wind load effects, most especially, topography. This would be applicable to any type of structure. Moreover, it would minimize the time and cost involved in the project. The output of this study can be used by a structural engineer as parameter in designing building structures located at Cabantian, Davao city. The result of this study can also be used as reference for future researches involving wind simulation in other places in Mindanao along the coastal areas especially in the Pacific Ocean.
METHODS
Research Design: This research is a modeling and simulation study. A simulation study involves the following key stages namely: conceptual model, computer model, solutions/understanding and Improvement in the real world. A conceptual model is a model description which is to be developed in a computer software. A computer model is the simulation model enforced which in this case is the wind simulation software. Solutions/understanding is derived from the results of the experiment. Lastly, improvement in the real world is acquired from implementing the solutions formed (Robinson, 2004). Prior to this study, the topography of sample subdivision, mathematical model and velocity profiles as input to simulation and critical wind pressures of the structures should be established. The simulation process took a total of 60 hours with 12 hours per wind velocity profile simulation in order to arrive at the most accurate results. The results are then presented in tables and figures.
Research Locale: The research locale of the urban subdivision was at Deca Homes Cabantian, Davao City, Philippines. The maps were based from Google map and Google Earth Pro. These maps were utilized as input data for the simulation.
Data Collection: The data collection for each specific objective were explained thoroughly in the paragraphs below.
Topography of sample subdivision: A Computer-Aided Design (CAD) model with reference to Google Earth Pro was used in order to come-up with the topography of Deca Homes Cabantian, Davao City.
Mathematical model as input to CFD: The sample building models together with the distances between the buildings and their surroundings were also derived using Computer-Aided Design (CAD). The mathematical model of the Computational Fluid Dynamics (CFD) Flow Design was based on the Fluid Dynamic equation: Reynolds Averaged Navier-Stokes (RANS) and Large Eddy Simulation (LES), which accounted for the turbulence model just like a traditional CFD application (Clannachan et al., 2009). After a thorough study, the fluid dynamic equation was improved to the low Mach number assumption to decompose the pressure. Mach One (1) is equal to the speed of sound (343.2m/s).
Mach numbers less than 0.3 (103m/s) are assumed to have incompressible flows whereas Mach numbers greater than 0.3 requires the consideration of compressible analysis for accurate solutions (Autodeskcfd, 2016). Incompressible flows uses a pressure correction equation based on the work of Patankar and Spalding (1972). These researchers developed the initial implementation of the SIMPLE (Semi Implicit Method for Pressure Linked Equations) algorithm. The SIMPLE algorithm method starts with the initial pressure values Pn derived from the simulation. The researcher then determined the mass flow rate at the element faces using the Rhie-Chow interpolation to compute a momentum satisfying mass flow rate field .
m*. Using the new mass flow rates, the
pressure correction equation was assembled and solved to obtain a pressure correction field P’. Finally, the researcher obtained the
collocated pressure correction using the equation:
Pc
Pc
n
Pc
' where Pc* is the collocated pressure correction, Pcnis the simulated initial guess for pressure cell or center and Pc’ is the pressure correction (Moukalled et al., 2016).Varying wind velocities affecting the topography of sample subdivision: The velocity profiles entered and applied were adapted from the American Society of Civil Engineers (ASCE) / National Structural Code of the Philippines (NSCP) wind specifications, such as: 150kph (41.67m/s), 200kph (55.56m/s) and 250kph (69.44m/s), respectively. Furthermore, wind speeds of 300kph (83.33m/s) and 350kph (97.22m/s) were added by the researcher to consider the velocity of super typhoons like Pablo and Yolanda.
Critical wind pressures of the building structures of sample subdivision: The maximum positive and negative wind pressures of the building structures were generated by the Autodesk Computational Fluid Dynamics (CFD) Flow Design simulation software. The critical wind pressures were also obtained using CFD Flow Design.
Research Tools: The research tools used in the study were the Autodesk Revit Building Information Modeling 2015 and the Autodesk Computational Fluid Dynamics (CFD) Flow Design 2014 Simulation software. These programs were utilized since it has both the topographic-building modeling and wind simulation capabilities. Moreover, these softwares are user friendly due to their convenient user interface compared with other simulation programs.
RESULTS
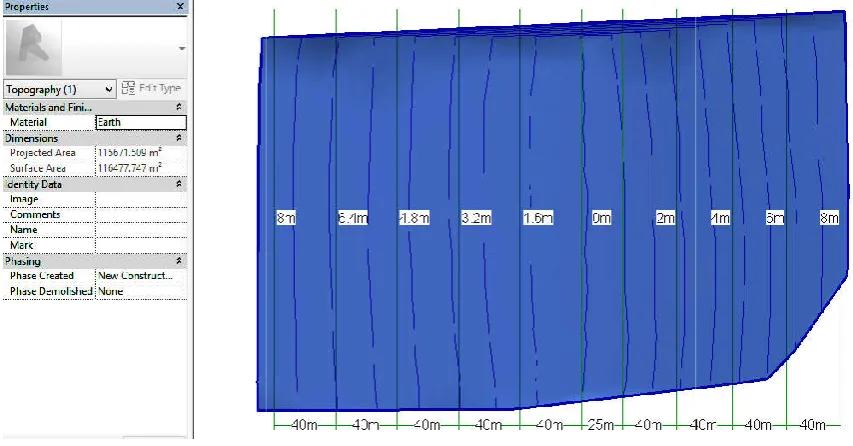
Topography of Sample Subdivision: In this study a Computer-Aided Design (CAD) model of the topography of Deca Homes, Cabantian, Davao City was made with reference to Google Earth Pro. The approximate area of the sample subdivision is 11.5 hectares or 115000 square meters (m2). In the south view of the topography, the maximum elevation on the right side is 8 meters followed by intervals of 6 meters, 4 meters and 2 meters, respectively. On the left side, the maximum elevation is 8 meters followed by intervals of 6.4 meters, 4.8 meters, 3.2 meters and 1.6 meters, respectively. Contour intervals of 40 meters was applied on each respective elevation intervals.
The datum/reference at elevation 0 meter was taken at the 25 meter part of the topography as shown in Figure 1.
the east (right) and west(left) sides of the topography. The datum/reference elevation at 0 meter was taken at the 25 meter part of the topography were the drainage and the two main parallel roads of the subdivision was located.
Figure 1. Area of Topography and Contour Intervals of Sample Urban Subdivision
Mathematical Model as Input to CFD: The mathematical model as input to CFD was derived from the Navier Stokes equation in three dimensional Cartesian coordinates followed by the discret
by numerical methods using finite volume method for the pressure correction equation.
The Navier Stokes equation in three dimensional Cartesian coordinates is given by
z
u
w
y
u
v
x
u
u
t
u
z
v
w
y
v
v
x
v
u
t
v
z
w
w
y
w
v
x
w
u
t
w
where:t
w
t
v
t
u
,
,
are the local acceleration along x, y and z axes, respectively
v
x
v
u
z
u
w
y
u
v
x
u
u
,
are the convection along x, y and z axes, respectively
z
P
y
P
x
P
,
,
are the piezometric pressure gradient along x, y and z axes, respectively
2 2 2 2 2 2 2 2 2 2,
y
v
x
v
z
u
y
u
x
u
are the viscous terms along x, y and z axes, respectively 70518 International Journal of Current Research,
(right) and west(left) sides of the topography. The datum/reference elevation at 0 meter was taken at the 25 meter part of the topography were the drainage and the two main parallel roads of the subdivision was located.
Area of Topography and Contour Intervals of Sample Urban Subdivision
The mathematical model as input to CFD was derived from the Navier Stokes equation in three dimensional Cartesian coordinates followed by the discretization with respect to volume and surface integration and then by numerical methods using finite volume method for the pressure correction equation.
The Navier Stokes equation in three dimensional Cartesian coordinates is given by
2 2 2 2 2 2z
u
y
u
x
u
x
P
2 2 2 2 2 2z
v
y
v
x
v
y
P
2 2 2 2 2 2z
w
y
w
x
w
z
P
are the local acceleration along x, y and z axes, respectively
z
w
w
y
w
v
x
w
u
z
v
w
y
v
v
,
are the convection along x, y and z axes, respectively
are the piezometric pressure gradient along x, y and z axes, respectively
2 2 2 2 2 2 2 2,
z
w
y
w
x
w
z
v
are the viscous terms along x, y and z axes, respectively
International Journal of Current Research, Vol. 10, Issue, 06, pp.70514-70527, June, 2018
(right) and west(left) sides of the topography. The datum/reference elevation at 0 meter was taken at the 25 meter part of
Area of Topography and Contour Intervals of Sample Urban Subdivision
The mathematical model as input to CFD was derived from the Navier Stokes equation ization with respect to volume and surface integration and then
(3.1)
(3.2)
The Continuity equation in three dimensional Cartesian coordinates is given by
0
)
(
)
(
)
(
z
w
y
v
x
u
t
(3.4) or
0
)
(
v
t
(3.5)
where in Cartesian coordinates, the vector operator nabla (del),
, is defined ask
z
j
y
i
x
The continuity equation is a partial differential equation form of the continuity condition. This represents an unsteady, three-dimensional mass conservation at a point in a compressible fluid. This infinitesimally small aspect of the element is why the equation is directly obtained in this form. Solving general flows requires an algorithm that can deal with the pressure-velocity coupling. The classical segregated SIMPLE (Semi Implicit Method for Pressure Linked Equations) algorithm of Patankar and Spalding (1972) was used to iteratively solve the Navier-Stokes equations. The Navier-Stokes equations was reformulated in terms of a momentum and a pressure equation, which are then discretized and solved sequentially. The pressure equation is constructed by combining the semi-discretized momentum and continuity equations.
For steady and incompressible flows, the simplified continuity and momentum equations becomes
0
)
(
)
(
)
(
z
w
y
v
x
u
(3.6)
z
P
y
P
x
P
z
w
z
y
v
y
x
u
x
z
ww
y
vv
x
uu
)
(
)
(
)
(
(3.7)
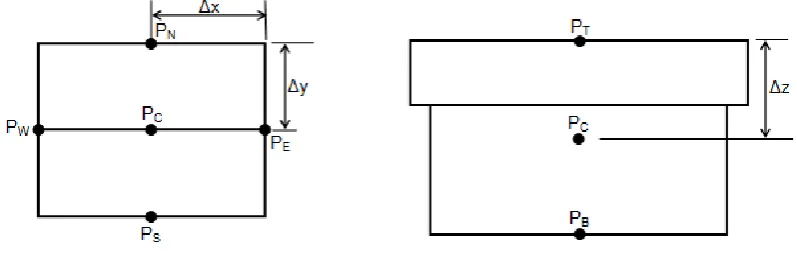
[image:6.595.36.207.75.161.2]Figure 2 shows the top and side views of a building taken from the sample subdivision and is used to derive the pressure correction equation for the three dimensional Cartesian grid.
Figure 2. Top and Side View of a Structure
The discretization of momentum equation starts with volume integration and is shown as
Vc Vc Vc
Vc
Vc Vc
Vc Vc
Vc
dV
z
P
dV
y
P
dV
x
P
dV
z
w
z
dV
y
v
y
dV
x
u
x
dV
z
ww
dV
y
vv
dV
x
uu
)
(
)
(
)
(
[image:6.595.96.495.492.622.2]Volume integrals of the convection and diffusion terms are then transformed into surface integrals by invoking the divergence theorem to give
dV
z
P
dV
y
P
dV
x
P
dxdy
z
w
dxdz
y
v
dydz
x
u
dxdy
ww
dxdz
vv
dydz
uu
Vc Vc Vc Vc Vc Vc Vc Vc Vc
)
(
)
(
)
(
(3.9)Representing the surface integrals by summation of fluxes over the faces of the element, and using a single Gaussian point for the face integrals, the semi-discretized forms of the three dimensional sides of Equation 3.9 becomes
dV
z
P
dV
y
P
dV
x
P
y
x
z
w
z
x
y
v
z
y
x
u
y
x
z
w
z
x
y
v
z
y
x
u
u
y
x
w
u
y
x
w
u
z
x
v
u
z
x
v
u
z
y
u
u
z
y
u
b s w t n e b b t t s s n n w w e e
(3.10)Equation (3.10) can be simplified as
dV
z
P
dV
y
P
dV
x
P
y
x
z
w
y
x
z
w
z
x
y
v
z
x
y
v
z
y
x
u
z
y
x
u
u
m
u
m
u
m
u
m
u
m
u
m
b t s n w e b b t t s s n n w w e e
. . . . . . (3.11)The discretization of the continuity equation starts from the simplified continuity equation and integrating over element C to give
0
)
(
)
(
)
(
dV
z
w
dV
y
v
dV
x
u
Vc Vc Vc
(3.12)Using the divergence theorem to transform to give volume integral into a surface integral and then into summation of fluxes over the faces of the element, the discrete form of the continuity equation is obtained as
0
)
(
)
(
)
(
)
(
)
(
)
(
u
y
z
e
u
y
z
w
v
x
z
n
v
x
z
s
w
x
y
t
w
x
y
b
(3.13)or
0
. . . . . .
w n s t be
m
m
m
m
m
m
(3.14)The discretization of the pressure term can be accomplished by transforming the pressure gradient term of the volume integral into a surface integral as shown as
Vc Vc Vc Vc Vc VcPdxdy
Pdxdz
Pdydz
dV
z
P
dV
y
P
dV
x
P
b t s n w e Vc Vc Vc
y
x
P
y
x
P
z
x
P
z
x
P
z
y
P
z
y
P
dV
z
P
dV
y
P
dV
x
P
)
(
)
(
)
(
)
(
)
(
)
(
y
x
P
P
z
x
P
P
z
y
P
P
dV
z
P
dV
y
P
dV
x
P
b t s n w e Vc Vc Vc
(
)
(
)
(
)
z
Vc
P
P
y
Vc
P
P
x
Vc
P
P
dV
z
P
dV
y
P
dV
x
P
b t s n w e Vc Vc Vc
(
)
(
)
(
)
(3.15)Applying linear interpolation profile for the variation of pressure as shown gives
z
Vc
P
P
P
P
y
Vc
P
P
P
P
x
Vc
P
P
P
P
dV
z
P
dV
y
P
dV
x
P
b c c t s c c n w c c e Vc Vc Vc
)
(
2
1
)
(
2
1
)
(
2
1
)
(
2
1
)
(
2
1
)
(
2
1
z
Vc
P
P
y
Vc
P
P
x
Vc
P
P
dV
z
P
dV
y
P
dV
x
P
e w n s t bVc Vc Vc
(
2
)
(
2
)
(
2
)
dV
Vc
P
x
P
P
y
P
P
z
P
z
P
dV
y
P
dV
x
P
e w n s t bVc Vc
Vc
2
(3.16)The Pressure Correction Equation The derivations are based on the work of Patankar and Spalding (1972), who developed the initial implementation of the SIMPLE (Semi Implicit Method for Pressure Linked Equations) algorithm. The SIMPLE algorithm starts with the continuity and momentum equations as derived earlier and then proceeds by providing initial guess for the velocity and pressure fields.
The pressure correction equation is given by
'
P
P
P
n
(3.17)where P* is the collocated pressure correction, Pn is the simulated initial guess for pressure cell and P’ is the pressure correction. The mass flow rate at cell faces correction is given by
0
)
'
(
)
'
(
)
'
(
)
'
(
)
'
(
)
'
(
. * . . * . . * . . * . . * . . * .
e w w n n s s t t b be
m
m
m
m
m
m
m
m
m
m
m
m
* . * . * . * . * . * . . . . . . .'
'
'
'
'
'
w n s t b e w n s t be
m
m
m
m
m
m
m
m
m
m
m
m
(3.18)where the mass flow rates and mass flow rate corrections at an element faces are
b b t t s s n n w w e e
y
x
w
m
y
x
w
m
z
x
v
m
z
x
v
m
z
y
u
m
z
y
u
m
)
(
,
)
(
,
)
(
,
)
(
,
)
(
,
)
(
. . . . . .
and b b t t s s n n w w e ey
x
w
m
y
x
w
m
z
x
v
m
z
x
v
m
z
y
u
m
z
y
u
m
)
'
(
'
,
)
'
(
'
,
)
'
(
'
,
)
'
(
'
,
)
'
(
'
,
)
'
(
'
. . . . . .
so that the simplified form of equation 3.18 can be written as
b t s n w e b t s n w e
y
x
w
y
x
w
z
x
v
z
x
v
z
y
u
z
y
u
m
m
m
m
m
m
)
'
(
)
'
(
)
'
(
)
'
(
)
'
(
)
'
(
)
(
* . * . * . * . * . * .
(3.19)' '
' '
' '
' '
'
'
'
'
'
'
'
C EP E WP W NP N SP S TP T BP B CPP
C
P
a
P
a
P
a
P
a
P
a
P
a
P
b
a
(3.20)
where
)
(
)
(
)
(
,
)
(
,
)
(
,
)
(
,
)
(
,
)
(
* . * . * . * . * . * . '
' ' ' ' ' ' '
' '
' '
' '
b t s n w e P
C
P B P T P S P N P W P E P
C
b w
P B t w P
T
s v P
S n v P
N w u
P W e u P
E
m
m
m
m
m
m
b
a
a
a
a
a
a
a
y
x
D
a
y
x
D
a
z
x
D
a
z
x
D
a
z
y
D
a
z
y
D
a
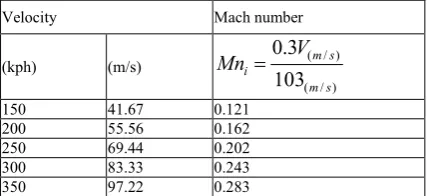
The sample building structures which are made up of gabled roofs with dimensions of 8 meters as the width, 10 meters as the length and 3 meters as the height were subjected to a roof angle of 20°. The mathematical model equation of the Autodesk Computational Fluid Dynamics (CFD) Flow Design uses the low Mach number assumption to decompose the pressure. Incompressible flows are assumed for all simulated velocity profiles since the Mach numbers for each velocity profile were found out to be less than 0.3 (103m/s) as shown in Table 1.
CFD Flow Design simulation model was based on the Reynolds Averaged Navier-Stokes (RANS) and Large Eddy Simulation (LES) which accounted for the turbulence model as shown in Figure 4.
[image:9.595.191.405.393.491.2]Table 1 shows the simulated velocity profiles and their equivalent Mach numbers. Since the equivalent Mach numbers of all velocity profiles are less than 0.3, the air flow is assumed to be incompressible. Wind velocities with equivalent Mach numbers greater than 0.3, compressible effects are becoming more influential and must be considered for accurate solutions.
Table 1.Velocity Profiles with their Equivalent Mach Numbers
Velocity Mach number
(kph) (m/s)
) / (
) / (
103 3 . 0
s m
s m i
V
Mn
150 41.67 0.121
200 55.56 0.162
250 69.44 0.202
300 83.33 0.243
350 97.22 0.283
[image:9.595.135.462.671.743.2]Critical Wind Pressures of the Building Structures of Sample Subdivision: The maximum positive and negative wind pressures (0.827,-1.222; 1.662,-2.293; 2.539,-3.558; 4.099,-5.087; 5.132,-6.766) kPa were obtained from 180° south wind attack angle and their respective velocities as shown in Table 2. The sign convention of the wind pressure indicates the direction of wind on the surface of the building model: positive value indicates the wind pressure acting towards the surface and negative value indicates the wind pressure acting away from the surface. The respective critical wind pressures, wind direction and wind velocities are shown in Figures 3 to 4. Wind pressures at different wind velocities are shown in Table 2. The Simulated and theoretical absolute maximum wind pressure results are shown in Table 3. Table 2 shows the simulated results of wind pressures subjected to different wind velocities. Pressure points were shown to provide information regarding the positive (windward) and negative (leeward) wind pressures affecting the surface of the building models. The maximum negative wind pressures were evidently higher than the maximum positive wind pressures. At various wind velocities, maximum positive and negative wind pressures occur at pressure points 1 and 7.
Table 2. Wind Pressures at Different Wind Velocities
Wind Velocity (kph) Pressure Points (kPa)
1 2 3 4 5 6 7
150 0.827 0.485 0.144 -0.198 -0.539 -0.881 -1.222 200 1.662 1.003 0.344 -0.315 -0.974 -1.633 -2.293 250 2.539 1.523 0.507 -0.509 -1.526 -2.542 -3.558 300 4.099 2.568 1.037 -0.494 -2.025 -3.556 -5.087 350 5.132 3.149 1.166 -0.817 -2.800 -4.783 -6.766
Table 3 shows the comparison of the absolute maximum value of the simulated and theoretical wind pressures at various wind velocities. It is shown that the simulated pressures are comparatively higher than the reference theoretical pressures since the simulated pressure varies with respect to the structure’s position, location and elevation, while the theoretical pressure is taken as uniform throughout the entire sample subdivision. The simulated wind pressures were based on the pressure point 7.
Table 3.Simulated and Theoretical Wind Pressure with Respect to Wind Velocities
Velocity(V) (kph) Simulated pressure (kPa) Theoretical pressure ρ = 0.0000473V2 (kPa)
150 1.222 1.064
200 2.293 1.892
250 3.558 2.956
300 5.087 4.257
[image:10.595.46.534.240.561.2]350 6.766 5.794
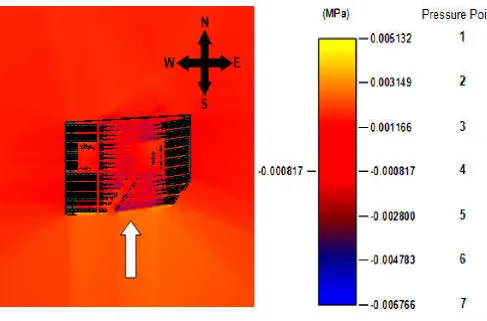
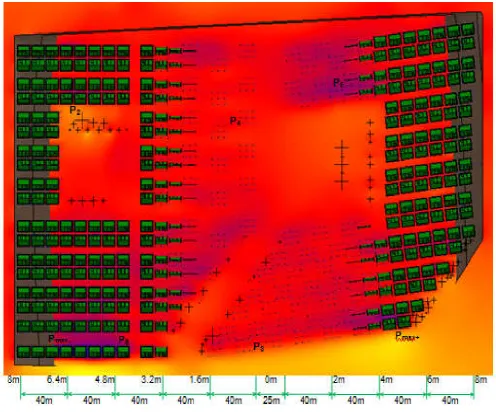
Figure 3 shows the wind direction taken from south (180°) attack angle with a wind velocity of 97.22m/s (350kph) applied at the urban subdivision. The critical positive and negative wind pressures obtained were 5.132kPa and -6.766kPa, respectively. The lower wind pressures as indicated by red-orange color are mostly located at the center/lower and plain portion of the urban subdivision. The maximum positive and negative wind pressures as indicated by yellow and blue color are mostly located at the sides/upper and elevated portion of the urban subdivision especially at the south direction where the wind originates. Turbulence of the air flow was reduced when it passes through a wall boundary.
Figure 3. Wind direction from south (180°), wind velocity of 97.22m/s (350kph) and critical wind pressures
Figure 4 shows the enlarged top view with pressure points and contour intervals of simulated urban subdivision. Pressure point 1 is named as the maximum positive wind pressure and denoted as Pmax+, while pressure point 7 is named as the maximum negative wind pressure and denoted as Pmax-. These maximum wind pressures are commonly located at the upper left and right portion of the subdivision. Pressure points 2 to 7 are called as the intermediate pressure points and are commonly located at the center and lower portions of the subdivision. These intermediate pressure points are denoted as P2, P3, P4, P5 and P6, respectively.