doi:10.4236/ti.2010.14028 Published Online November 2010 (http://www.SciRP.org/journal/ti)
Cost Benchmarking of Generation Utilities Using DEA:
A Case Study of India
Shafali Jain, Tripta Thakur, Arun Shandilya
Department of Electrical Engineering, National Institute of Technology, MANIT-Bhopal, India E-mail:{shafalijain9, tripta_thakur}@yahoo.co.in, [email protected] Received July 28, 2010; revised September 8, 2010; accepted September 12, 2010
Abstract
Technical efficiency of electric utility is the critical element for its competitiveness in the electricity market and very relevant in the Indian electricity sector presently. This paper is aimed to measure the efficiencies of 30 state owned electric generation utilities/companies for the year 2007-08 by applying DEA models with single input and two outputs. The input used is total cost and outputs are units of energy generated and total energy sold or consumed. Cost benchmarking has been carried out so that cost controls can be implemented. In addition, the target evaluation for input cost has also been done. The result of this model shows that GENCOs are generally inefficient in cost frontier and there is an urgent need for intro inspection. This will help for GENCOs. The result shows that the total average of overall, technical and scale efficiencies are 46%, 75.1% and 60% respectively. This efficiency measurement assists the utilities by identifying their shortcom-ings, setting targets and trying to reach the set targets.
Keywords:Data Envelopment Analysis (DEA), Generation Company (GENCO), Cost Benchmarking, Target Evaluation
1. Introduction
Recent electricity sector reforms in the form of liberali-zation, privatiliberali-zation, and implementation of a new regu-latory design around the world have been radically transformed the power sector. Enhancing efficiency, productivity and quality are the goals behind these re-forms. A similar had been followed by India which ex-perienced electric power reforms in early 1991. Today’s competitive electricity market has heightened the need for methods to evaluate the technical efficiency of the electric utility [1]. Among many possible efficiency measurement methods, Data Envelopment Analysis (DEA) is one method that has been used especially for the complicated systems with lots of inputs and outputs for benchmarking since its introduction by Charnes, Cooper and Rhodes in 1978 based on previous work by Farrell on production efficiency [2]. DEA methodology has been most commonly used for calculating the effi-ciency of utilities and benchmarking their performances to establish the best practices [3].
The deficiency in power availability in India is a sig-nificant obstacle to the smooth development of the economy [4-5]. The deficits experienced in India during
serious efforts to improve the efficiency levels to the international best practice levels [8-9]. Bridging the gap in demand and supply has become significant and ac-cordingly this strongly necessitates assessment of per-formance of generation utilities [10].
This paper presents the cost benchmarking of Indian electric generation companies by analyzing their effi-ciency using DEA methodology for the year 2007-2008.
2. Indian Generation Sector
India is world’s fifth largest consumer of energy. It is sixth largest generating company in the world and third largest in Asia. The Indian power sector is divided into five Regions: Northern, Western, Southern, Eastern, and the North-Eastern Region; and each state in India has its own state owned electric utility (SOEU). The Central Electricity Authority (CEA) is responsible for power planning at the national level. CEA advises the Ministry of power (MOP) on matters concerning the national power policy, and national power planning. Regulatory matters in the center are taken care by the Central Elec-tricity Commission (CERC) and the State ElecElec-tricity Regulatory Commission (SERC) take care corresponding regulatory issue at the state level.
The electricity sector in India is predominantly con- trolled by the Government of India’s public sector un- dertakings (PSUs). Major PSUs involved in the genera- tion of electricity include National Thermal Power Cor- poration (NTPC), National Hydroelectric Power Corpo- ration (NHPC) and Nuclear Power Corporation of India (NPCI). In electricity generation, the contribution of state, central and private sectors are 52.5, 34 and 13.5% re- spectively. As on 31st march, 2008, there were eight State Electricity Boards and thirteen Electricity Depart-ments in the States and Union Territories and total fifteen utilities have been unbundled.
3. Methodology
DEA occasionally called frontier analysis was first place ahead by Charnes, Cooper and Rhodes in 1978 [4]. It is a performance measurement technique which, can be used for evaluating the relative efficiency of decision-making units (DMU's)1 in organizations. The most basic DEA model is CCR based on Charnes, Cooper & Rhodes (1978) which have constant returns to scale; however there is also DEA models which address varying returns
to scale known as BCC based on Banker, Charnes and Cooper (1984) [11].
DEA has been applied for both production and cost data [12]. By using the selected input and output variables, DEA software finds for the points with the lowest input value for any given output, connecting those points to form the efficiency frontier. The utility which is not on the frontier is considered to be inefficient. A numerical coefficient is given to each firm, defining its relative efficiency. This method can easily accommodate a multiplicity of inputs and outputs. This method is also useful because returns to scale is taken into consideration in calculating efficiency, thus allowing for the concept of increasing or decreasing efficiency based on size and output levels.
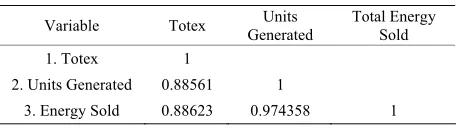
The most important job in this efficiency analysis is the right selection of inputs and outputs. No universally applicable rational template is available for selection of variables [13]. An inherent assumption in DEA is that there is some relationship between the input and the output. Correlation is a statistical test which enables us to investigate for a statistical relationship between two variables. Input variables chosen for DEA model are: total cost in Rs. Crores and the outputs are units gener-ated (GWh) and energy sold (GWh), their correlation is shown in Table 1.
3.1. DEA Models
There can be two DEA models: CCR and BCC model and both of these models are applied in this analysis.
1) CCRModel
The CCR model was suggested by Charnes et al. (1978), and hence is named as CCR model and assumes constant returns to scale (CRS) assumption. If assuming data on K inputs and M outputs for each of N firms, then for the i-th firm these are represented by the column vectors xi and yi respectively. The K × N input matrix, X, and the M × N output matrix, Y, represent the data for all N firms. A measure of the ratio of all outputs over all inputs would be obtained for each firm, such as uyi / vxi, where u is an M × 1 vector of output weights and v is a K × 1 vector of input weights [14]. The optimal weights are obtained by solving the mathematical programming problem:
maxu, v (uyi / vxi),
st uyj / vxj ≤ 1, j = 1,2,….N,
u,v ≥ 0. (1) It is required to calculate values of u and v, such that the efficiency measure for the i-th firm is maximized, subject to the constraints that all efficiency measures must be less than or equal to one. The difficulty in this 1DMU is a distinct unit within an organization that has flexibility with
231 ratio formulation is that it has an infinite number of
solu-tions. This can be avoided by imposing the constraint vxi = 1, which provides:
maxµ,v (µyi), st vxi = 1,
µyj – vxj ≤ 0, j = 1,2,….N,
µ,v ≥ 0, (2) where the notation is changed from u and v to µ and v, to stress that this is a different linear programming problem. Equation (2) is known as the multiplier form of the DEA linear programming problem. By the duality in linear programming, equivalent envelopment form of this problem can be derived as:
minθ,λ θ ,
st -yi + Yλ ≥ 0, θxi – Xλ ≥ 0,
λ ≥ 0, (3) where θ is a scalar and λ is a N × 1 vector of constants. The efficiency score for the i-th firm will be the value of θ According to the Farell (1957) definition, it will satisfy: θ ≤ 1, with a value of 1 indicating a point on the frontier and hence the firm is technically efficient firm.
2) BCC Model
BCC model was suggested by Banker, Charnes and Cooper (1984) investigates whether the performance of each DMU was conducted in region of increasing, con-stant or decreasing returns to scale in multiple outputs and multiple inputs situations. The CCR efficiency can be decomposed into the pure technical and scale effi-ciency components by this BCC model, thus investigat-ing the scale effects [15]. Accordinvestigat-ing to this model an inefficient firm is only “benchmarked” against firms of a similar size.
The CRS linear programming problem can be easily modified to account for VRS by adding the convexity constraint: N1λ = 1 to (3) to provide:
minθ,λ θ ,
st -yi + Yλ ≥ 0, θ xi – Xλ ≥ 0, N1λ = 1
λ ≥ 0, (4) where N1 is an N × 1 vector of ones. This approach forms a convex hull of interesting planes which envelope the data points more tightly than the CRS conical hull and thus provides technical efficiency scores which are greater than or equal to those obtained using the CRS model. The VRS specification has been the most com-monly used specification in the 1990s.
3.2. DEA Variables
The most important job in this efficiency analysis is the
right selection of inputs and outputs. No universally ap-plicable rational template is available for selection of variables [16-17]. An inherent assumption in DEA is that there is some relationship between the input and the outpu t. Correlation is a statistical test which enables us to investigate for a statistical relationship between two variables. Input variables chosen for DEA model are: total cost in Rs. Crores and the outputs are units gener-ated (GWh) and energy sold (GWh) and input output correlation has been shown in Table 1. Total cost (To-tex), which represents the cost incurred by the utility to supply electricity to the ultimate consumers. The com-ponents considered for calculating the total cost are: cost of the fuel, operating and maintenance cost (O & M), administrative and general cost (A & G), interest pay-ment liability, depreciation and the cost of power pur-chase.
3.3. Orientation
Efficiency can be evaluated either on an input-oriented or output-oriented basis. For this paper, an input- ori-ented or input-minimizing approach has been selected since the purpose of the analysis was to suggest bench-marks for efficiency and reduction of cost input chosen in order to produce a given output.
3.4. Data Collection
Data was collected for 30 SOEUs in which 8 entities were the State Electricity Boards (SEBs), 7 entities com-prised various electricity or power departments (PDs), and 15 entities comprised the unbundled SOEUs. The physical data for various states were obtained for the different years from “General Review 2009” published by CEA [18]. The cost data were taken from the “Power Finance Corporation” report 2005-2006 to 2007-2008 [19]. Descriptive statistics of the data for year 2007-2008 is presented in Table 2 in the form of mean, median, standard deviation, minimum and maximum values.
4. Result & Analysis
4.1. Overall Efficiency Scores
[image:3.595.310.538.656.720.2]The overall efficiency is measured by CCR model with
Table 1. Input/output correlations.
Variable Totex Generated Units Total Energy Sold
1. Totex 1
2. Units Generated 0.88561 1
Table 2. Descriptive statistics.
Variables Mean Median Deviation Standard Min Max
Totex 1960.03 458 2465.15 20 7770
Units
Generated 14477.57 5427.61 18407.74 21.08 72770.46
Energy
Sold 16547.84 10956.17 18604.46 169.51 67930.96
CRS assumption. The results are presented in Table 4. It is evident from Table 4 that the utilities display signifi-cant variations in efficiency levels. The total efficiency had a mean score of 46 % for all the utilities and nearly two- third of utilities lie below this average value. Only three generation companies (Himachal Pradesh- HPSEB, Jammu & Kashmir- J & K SEB and Puducherry-PCL) turned out to be the best practices and the remaining 27 utilities exhibited varying degree of inefficiencies. With the exception of the best practices and eight utilities -Sikkim, Assam- APGCL, Manipur, Meghalaya, Na-galand, Tripura, Arunachal Pradesh and Mizoram, exhib-ited decreasing returns to scale suggesting that these
utilities exceeded their most productive scale size. This outcome supports the unbundling policy of the GoI, as envisaged in the Electricity Act. Five Utilities –Sikkim PD, APGCL, Manipur PD, Arunachal Pradesh (PD) and Mizoram (PD), exhibited increasing returns to scale, which indicates that these utilities are smaller than the most productive scale size.
4.2. Calculation of Scale Efficiency
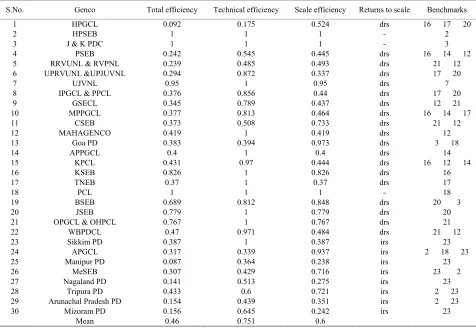
The scale efficiency is calculated by the BCC formula-tion that assumes a VRS by taking into consideraformula-tion the sizes of utilities. This formulation ensures that similar sized utilities are benchmarked and compared with each other [20-21]. In this model the total efficiency is de-composed into pure technical and scale efficiency. The scale efficiency is given by the ratio of CRS efficiency (overall efficiency) to VRS efficiency (pure technical efficiency). The results are presented in Table 3. In BCC model, the number of utilities that appear as efficient increased to 11, while remaining 19 utilities showed in-efficiencies. The average technical efficiency is 75.1%. The results indicate the possibility of restructuring of several utilities that display low scale efficiencies.
Table 3. Results of CCR and BCC Model.
S.No. Genco Total efficiency Technical efficiency Scale efficiency Returns to scale Benchmarks
1 HPGCL 0.092 0.175 0.524 drs 16 17 20
2 HPSEB 1 1 1 - 2
3 J & K PDC 1 1 1 - 3
4 PSEB 0.242 0.545 0.445 drs 16 14 12
5 RRVUNL & RVPNL 0.239 0.485 0.493 drs 21 12
6 UPRVUNL &UPJUVNL 0.294 0.872 0.337 drs 17 20
7 UJVNL 0.95 1 0.95 drs 7
8 IPGCL & PPCL 0.376 0.856 0.44 drs 17 20
9 GSECL 0.345 0.789 0.437 drs 12 21
10 MPPGCL 0.377 0.813 0.464 drs 16 14 17
11 CSEB 0.373 0.508 0.733 drs 21 12
12 MAHAGENCO 0.419 1 0.419 drs 12
13 Goa PD 0.383 0.394 0.973 drs 3 18
14 APPGCL 0.4 1 0.4 drs 14
15 KPCL 0.431 0.97 0.444 drs 16 12 14
16 KSEB 0.826 1 0.826 drs 16
17 TNEB 0.37 1 0.37 drs 17
18 PCL 1 1 1 - 18
19 BSEB 0.689 0.812 0.848 drs 20 3
20 JSEB 0.779 1 0.779 drs 20
21 OPGCL & OHPCL 0.767 1 0.767 drs 21
22 WBPDCL 0.47 0.971 0.484 drs 21 12
23 Sikkim PD 0.387 1 0.387 irs 23
24 APGCL 0.317 0.339 0.937 irs 2 18 23
25 Manipur PD 0.087 0.364 0.238 irs 23
26 MeSEB 0.307 0.429 0.716 irs 23 2
27 Nagaland PD 0.141 0.513 0.275 irs 23
28 Tripura PD 0.433 0.6 0.721 irs 2 23
29 Arunachal Pradesh PD 0.154 0.439 0.351 irs 2 23
30 Mizoram PD 0.156 0.645 0.242 irs 23
[image:4.595.59.535.395.724.2]233
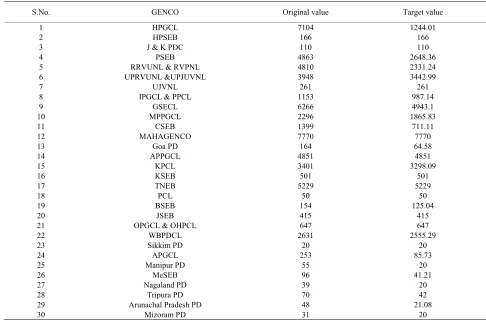
Table 4. Input cost target values.
S.No. GENCO Original value Target value
1 HPGCL 7104 1244.01
2 HPSEB 166 166
3 J & K PDC 110 110
4 PSEB 4863 2648.36
5 RRVUNL & RVPNL 4810 2331.24
6 UPRVUNL &UPJUVNL 3948 3442.99
7 UJVNL 261 261
8 IPGCL & PPCL 1153 987.14
9 GSECL 6266 4943.1
10 MPPGCL 2296 1865.83
11 CSEB 1399 711.11
12 MAHAGENCO 7770 7770
13 Goa PD 164 64.58
14 APPGCL 4851 4851
15 KPCL 3401 3298.09
16 KSEB 501 501
17 TNEB 5229 5229
18 PCL 50 50
19 BSEB 154 125.04
20 JSEB 415 415
21 OPGCL & OHPCL 647 647
22 WBPDCL 2631 2555.29
23 Sikkim PD 20 20
24 APGCL 253 85.73
25 Manipur PD 55 20
26 MeSEB 96 41.21
27 Nagaland PD 39 20
28 Tripura PD 70 42
29 Arunachal Pradesh PD 48 21.08
30 Mizoram PD 31 20
4.3. Benchmarking
Benchmarking is the process of creating a standard/best practice against which the performance of utility can be measured [22]. For every inefficient DMU, DEA identi-fies a set of corresponding efficient units that can be utilized as benchmarks for improvement. The bench-marks for inefficient utilities are shown in Table 3. For example the benchmarks for Haryana (HPGCL) are Ker-ala SEB, Tamil Nadu (TNSEB) and Jharkhand (JSEB). This inefficient utility will be benchmarked or compared against these three efficient utilities.
4.4. Input Cost Target Values
For each inefficient utility target value for input variable is calculated so as to make them efficient and shown in the Table 4. The input cost target values for most of the utilities is lower than their actual values. In the case of HPGCL, the input cost should be reduced by 82% to make it technically efficient. The mean technical effi-ciency of all the utilities is 75.1% which means utilities could reduce their inputs by 24.9% without reducing their outputs.
4.5. Cost Savings
The mean technical efficiency of all the utilities is 75.1% which means utilities could reduce their inputs by 24.9% without reducing their outputs. That means by cost benchmarking the utilities we can have the cost reduction by nearly 25% with the same output. For the case of generation company of Haryana (HPGCL), the input cost is 7104 Rs crores, so on an average we can reduce its cost by 25% which is a huge money saving which can be utilize by this utility for further generation.
5. Conclusions
ap-pear as efficient entities are 3 in case of CRS while under VRS condition, it increased to 11. In addition to this, for each inefficient GENCO target value for input cost is calculated so as to make them efficient. Himachal Pradesh (HPSEB), Jammu & Kashmir (J & K SEB) and Puducherry (PCL) display the best performance. This efficiency measurement assists the companies by identi-fying their shortcomings, setting targets and trying to achieve the set targets.
6. References
[1] K. Sarica and I. Or, “Efficiency Assessment of Turkish Power Plants Using Data Envelopment Analysis,”
En-ergy policy, Vol. 32, 2007, pp. 1484-1499.
[2] A. Charnes, W. W. Cooper and E. Rhodes, “Measuring the Efficiency of Decision Making Units,” European
journal of operational research, Vol. 2, No. 6, 1978, pp
429-444.
[3] B. Golany, Y. Roll and D. Rybak, “Measuring effi-ciency of power Plants in Israel by data envelopment analysis,” IEEE transactions on engineering manage-ment, Vol. 41, No. 3, 1994, pp. 291-301.
[4] K. P. Kannan and N. V. Pillai, “Plight of the power sector in India: SEBs and their saga of inefficiency”, Centre for development studies, Thiruvananthapuram, working paper, No. 308, 2000.
[5] V. K. Yadav, N. P. Padhy and H. O. Gupta, “Assessing the performance of electric utilities of developing coun-tries: An inter country comparison using DEA,” Power
and energy general meeting, No. 308, November 2000,
pp. 1-87.
[6] Ministry of power website. www.powermin nic in [7] T. Thakur, “Benchmarking Study for the Indian Electric
utilities Data Envelopment Analysis,” IEEE
Transac-tions on Power Systems, 2005, pp. 545-549.
[8] D. K. Jha and R. Shrestha, “Measuring Efficiency of Hydropower Plants in Nepal Using Data Envelopment Analysis,” IEEE Transactions on Power Systems, Vol. 21, No. 4, November 2006, pp. 1502-1511.
[9] M. Saleem, “Technical efficiency in electricity sector of Pakistan-The impact of private and public ownership,” 2007. www.pide.org.pk
[10] T. Thakur, S. G. Deshmukh, S. C. Kaushik and M. Kulshrestha, “Impact Assessment of the Electricity Act 2003 on the Indian Power Sector,” Energy Policy, Vol.
33, No. 9, 2005, pp. 1187-1198.
[11] T. Coelli, D. S. P. Rao and G. E. Battese, “An introduc-tion to efficiency and productivity analysis,”
[12] R. F. Lovado, “Benchmarking the efficiency of Philip-pines electric cooperatives using stochastic frontier analysis and data envelopment analysis,” Third east
west center international graduate student conference,
Hawaii, 2004.
[13] T. Thakur, S. G. Deshmukh, S. C. Kaushik and M. Kulshrestha, “Impact Assessment of the Electricity Act 2003 on the Indian Power Sector,” Energy Policy, Vol. 33, No. 9, 2005, pp. 1187-1198.
[14] W. W. Cooper and K. Tone, “Measures of Inefficiency in Data Envelopment Analysis and Stochastic Frontier Estimation,” European Journal of Operational
Re-search, Vol. 99, 1997, pp. 72-88.
[15] D. K. Jha, N. Yorino and Y. Zoka, “A Modified DEA Model for Benchmarking of Hydropower Plants,”
Power Technology, July 2007, pp. 1374-1379.
[16] A. Vaninsky, “Efficiency of electric power generation in the United States: Analysis and Forecast Based on Data Envelopment Analysis,” Energy Economics, Vol. 28, 2006, pp. 326-338.
[17] R. Meenakumari and N. Kamraj, “Measurement of Relative Efficiency of State Owned Electric Utilities in India Using Data Envelopment analysis,” Modern
Ap-plied Science, Vol. 2, No. 5, September 2008, pp 61-71.
[18] CEA, “All India Electricity Statistics, General Review 2009,” Central Electricity Authority, New Delhi, India, 2009, pp. 1-235.
[19] “Report on the Performance of the State Power Utilities for the years 2005-06 to 2007-08,” Power Finance Corporation Ltd, New Delhi.
[20] M. Abbott, “The Productivity and Efficiency of the Australian Electricity Supply Industry,” Energy
Eco-nomics, Vol. 28, 2006, pp. 444-338.
[21] A. Pahwa, X. Feng and D. Lubkeman, “Performance Evaluation of Electric Distribution Utilities Based on Data Envelopment Analysis,” IEEE Transactions on
Power Systems, Vol. 18, No. 1, February 2003, pp. 400-
405.