DEVELOPMENT AND VALIDATION OF ANALYTICAL METHOD OF
BERBERINE AND ITS QUANTIFICATION IN MULTICOMPONENT
HOMEOPATHIC FORMULATIONS
Anjani Chaudhari and Rajashree Mashru*
Faculty of Pharmacy, G.H. Patel Building, Donor’s Plaza, The M.S. University of Baroda,
Vadodara-390 002, India.
ABSTRACT
A reverse phase high performance liquid chromatographic method was
developed for the estimation of Berberine in Multicomponent
Homeopathic formulations. The separation was achieved by C18 (10 X 4.6 mm, 5 μm) column and 0.1% trifluroacetic acid in water and
Acetonitrile (45:55) as mobile phase, at a flow rate of 1 ml/min.
Detection was carried out at 344 nm. Retention time of Berberine is
found to be 5.1 min. The method has been validated for Calibration
Curve, Accuracy, Precision, LOD and LOQ. Linearity for the method
was linear over the concentration range for 0.01-0.06 μg/ml. The
percentage recoveries for Berberine is found to be in range of
98-103%. Developed method was found to be Accurate, Precise, Selective
and Rapid for Estimation of Berberine in Multicomponent Homeopathic formulations.
KEYWORDS: RP-HPLC, Validation, Multicomponent Formulation.
INTRODUCTION
Berberine is a quaternary ammonium salt from the protoberberine group of benzyl
isoquinoline alkaloids. Due to Berberine's strong yellow color, Berberis species were used to
dye wool, leather, and wood. Wool is still dyed with today in northern India. Under
ultraviolet light, shows a strong yellow fluorescence.[1] is a chemical found in several plants
including European barberry, goldenseal, goldthread, Oregon grape, phellodendron, and tree
turmeric.[2,3] Berberine-containing plants are used medicinally in many traditional medical
systems, including Ayurvedic herbal and Chinese herbal medicine. has been used in diabetes,
Volume 6, Issue 5, 793-802. Research Article ISSN 2277–7105
Article Received on 27 Feb. 2017,
Revised on 19 March 2017, Accepted on 08 April 2017 DOI: 10.20959/wjpr20175-8337
*Corresponding Author’
Rajashree Mashru
prostate cancer, cardiac arrhythmia and leukemia.[4] Homeopathic remedies are prescribed on
the basis that in a tiny dilution like cures like, so while the very dilute homeopathic remedy
may help, the raw product is often best avoided.[5] Analytical methods are reported in
literature for the Simultaneous and single molecule particular plant extract[6,7,8] and for whole
plant and also studies on plasma has been carried out.[9] we are the first to estimate in
multicomponent homeopathic formulation. This work is aimed to develop and validate HPLC
method for the determination of Berberine(figure 1) in Homeopathic multicomponent
formulation. The method developed is accurate, precise and simple for these compounds in
[image:2.595.190.392.274.402.2]mixtures.
Figure 1: Chemical Structure of Berberine.[10]
EXPERIMENTAL Chemicals and reagents
Berberine was procured from sigma aldrich with purity of 99.87%. Methanol and Acetonitrile
of HPLC grade are of Rankem (mumbai). triflouroacetic acid (HPLC Grade) were procured
from Finar Chemicals Ltd (mumbai). Commercial homeopathic formulation was purchased
from the local market which contain Berberis aristata and Berberis vulgaris. All other
Chemicals and solvents were of analytical reagents grade. All solutions were prepared with
HPLC grade water. All solutions were filtered through a Nylon 6,6 membrane filter (Pall Life
Sciences, USA) prior to use.
Instrument
A high - performance liquid chromatograph (Shimadzu,Kyoto,Japan) was installed of a
LC-20AT prominence solvent delivery system, injector which was manually operated was fixed
20-μl loop and a SPD-20A Prominanace UV-visible detector .Separation was Optimized on a Thermofischer C18 Column (particle Size 5μm: 250 mm × 4.6 mm internal daimeter,
using a Spinchrom chromatographic Station® CFR Version 2.4.195 (Spinchrom Pvt. Ltd.,
Chennai, India).
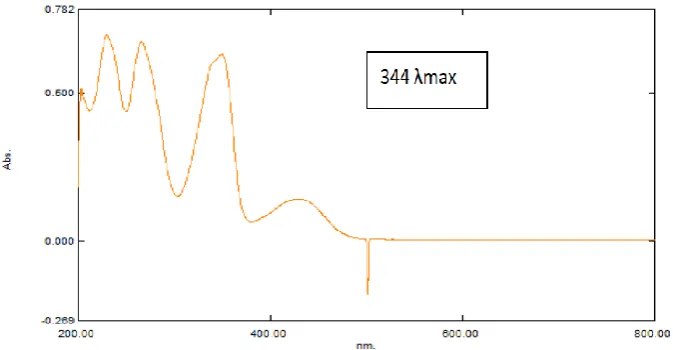
Selection of detection wavelength
Solution of Berberine in acetonitrile was scanned over the range of 200-400 nm. It was
observed that the it show considerable absorbance at 344 nm and was selected as the
[image:3.595.130.467.242.417.2]wavelength for detection.(fig.2).
Figure 2 UV spectrogram of Berberine.
Chromatographic Conditions
The isocratic method was developed at 1.0 ml/min flow rate with 0.1% TFA :ACN(45:55,v/v) as mobile phase. The mobile phase was filtered through a 0.2 μm Nylon
membrane filter to remove any particulate matter and degassed by sonication for 10 minutes.
The absorbance was taken at 344 nm, scanning was done previously on UV to select optimal
absorbance wavelength. The sensitivity of detector was set at 0.01 AUFS. Peak area of was
the method of Quantification. Before injecting solutions, the column was maintained at
equilibrated for at least 30 min with the mobile phase flowing through the system .All the
readings was taken in triplicate and the relative standard deviation (%R.S.D) was required to
remain below 2.0% on peak area readings.
Preparation of solutions
A stock solutions of Berberine (1000 μg/ml) were prepared in Acetonitrile and were stored at
2-8 OC until used. Aliquots of these solutions were diluted stepwise with mobile phase to
Optimization of chromatographic condition
Sometimes, the effects of different chromatographic conditions on the instrumental responses
create a situation where one has to compromise between different experimental variables in
order to achieve the best chromatographic separation. Chromatographic separations are
significantly affected by the mobile phase conditions, such as mobile phase ratio, the organic
modifiers And therefore before selecting the conditions for the optimization, a number of
preliminary trails were conducted with different combinations of different organic solvents
and buffers at various pH, compositions, and flow rate to check the retention time, shape,
resolution. From those experiments the mobile phase combination of 0.1% TFA in water and
ACN in the acidic pH range was found to be most suitable.
In order to achieve an optimum separation, following trails were conducted:(table-1).
Table 1: different mobile phase trial.
Mobile phase Observation
Methanol : Water(50:50) No peak ACN:Water (50:50) No peak Ammonium Formate pH-2.5 :
ACN(50:50) Distorted peak Ammonium Acetate pH-4 : ACN(50:50) Less column K2HPO4 pH-6 : ACN(50:50) Fronting
Water (0.1 TFA) : ACN(45:55) Good shape peak
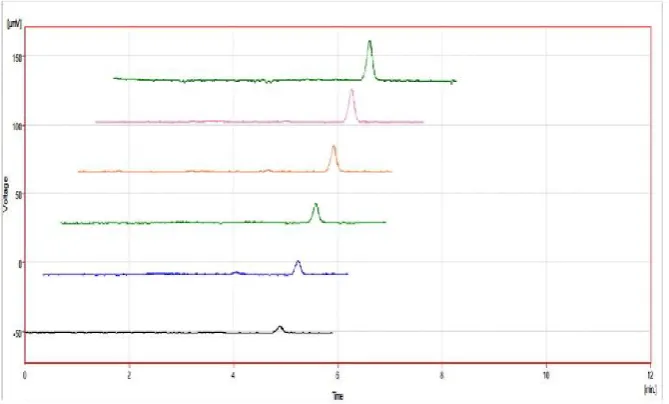
RESULT AND DICUSSION Calibration curve (Linearity)
The linearity of an analytical method is its ability within a definite range to obtain results
directly proportional to the concentrations (quantities) of an analyte in the sample. The
calibration plot(concentration VS Area) was generated by replicate analysis (n = 6) at all
concentration levels . Calibration curve data are shown in table 2.Overlain chromatogram of
Berberine(0.01-0.06μg/ml) shown in figure 3 and calibration curve of Berberine represented
Figure 2: Overlain chromatogram of BERB.(0.01-0.06)(μg/ml)
Table 2: Linearity range of berberine.
conc.(μg/ml) Area(mV.s)
0.01 0.387 0.02 0.718 0.03 1.063 0.04 1.449 0.05 1.690 0.06 2.123
Figure 4. Standard calibration curve of Berberine.
Accuracy and precision
Both repeatability (within a day precision) and reproducibility (between days precision) were
of the calibration curve, i.e. 0.01, 0.03 and 0.06 μg/ml were prepared. Six injections at each
of the specified concentration levels were injected within the same day for repeatability and
over a period of 3 days (6 injections/day) for reproducibility. Mean and relative standard
deviation were calculated and used to judge accuracy and precision of the method. Both
intra-day and inter-intra-day samples were compared with standard curves concurrently prepared on the
day of analysis. Accuracy can be measured by many methods here we have done percentage
of recovery by spiking at 50,100,150 % levels. Results of accuracy and precision are shown
in table 3 and 4 respectively.
Table 3: Statistical validation of recovery studies.
Method % spiking Actual conc. Of BERB. (µg/ml) Amount of BERB. (µg/ml) Amount of recovered (µg/ml) % Recovery ± SD RP- HPLC
50% 0.010 0.005 0.005149 102.99±0.3366 100% 0.010 0.010 0.010658 96.788±0.5202 150% 0.010 0.015 0.0160 106.82±0.7563 * Data obtained from 3 replicate injections
Table 4: Statistical validation of precision data. Intraday.
Conc. ( µg/ml)
Set-1 (Mean ± sd)
Set-2 (Mean ± sd)
Set-3 (Mean ± sd)
0.01 0.3258±0.003 0.3596±0.026 0.280±0.1125 0.03 1.069±0.0257 1.176±0.1190 1. 0718±0.024 0.06 2.1488±0.058 2.0956±0.067 2.187±0.0874
Inter-day
Conc.(µg/ml) Day 1(Mean ± sd ) Day 2 (Mean ± sd )
0.01 0.3654±0.02972 0.3156±0.0083 0.03 0.9882±0.00755 1.1698±.08684 0.06 2.1432±0.04193 2.0968±0.05997
* Data obtained from 3 replicate injections
Detection Limit
The Detection Limit of an individual analytical procedure is the lowest amount of analyte in a
sample which can be detected but not necessarily quantitated as an exact value. The detection
Where σ = Relative standard deviation of the response. S = the slope of the calibration curve
(of the analyte).
Quantitation Limit
The Quantitation limit of an analytical procedure is the lowest amount of analyte in a sample,
which can be quantitatively determined with suitable precision and accuracy.
Quantitation Limit (LOQ) may be expressed as. LOQ = 10(σ/ S)
Where σ = Relative standard deviation of the response. S = the slope of the calibration curve
(of the analyte).Data were summarised in Table 8.
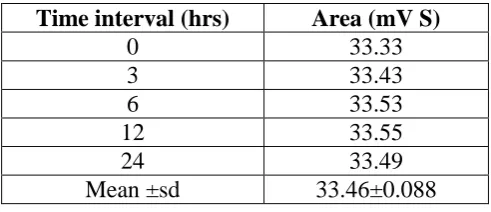
Stock solution stability
Stock solution of (100 μg/ml) was prepared in Acetonitrile and stored at room temperature. Area of solution was taken for 1 μg/ml at 0hr, 3hr, 6hr, 12 hr and 24 hr. No change in area
[image:7.595.175.421.450.556.2]was found to occur after 24 hour. Hence, Solution is found to be stable. results shown in the
Table 5.
Table 5: data of stock solution stability.
Time interval (hrs) Area (mV S)
0 33.33 3 33.43 6 33.53 12 33.55 24 33.49 Mean ±sd 33.46±0.088
Specificity
The method was determined as specific by comparing test results obtained from analyses of
sample solution containing placebo ingredients with that of test results those obtained from
standard solution.
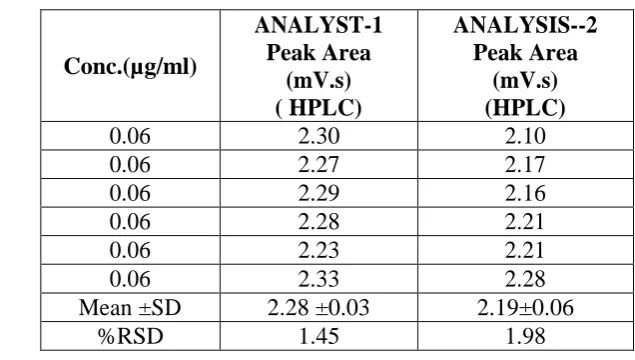
Ruggedness
Ruggedness should be used as a parameter evaluating constancy of the results when external
factors such as analyst, laboratory, instrument, reagents and days are varied. We have did the
Table 6: Ruggedness.
Conc.(µg/ml)
ANALYST-1 Peak Area
(mV.s) ( HPLC)
ANALYSIS--2 Peak Area
(mV.s) (HPLC)
0.06 2.30 2.10 0.06 2.27 2.17 0.06 2.29 2.16 0.06 2.28 2.21 0.06 2.23 2.21 0.06 2.33 2.28 Mean ±SD 2.28 ±0.03 2.19±0.06
%RSD 1.45 1.98
Robustness
The evaluation of robustness should be considered during the development phase and
depends upon the type of procedure under study. It should show the reliability of an analysis
with respect to deliberate variations in method parameters. The parameters included flow
rate, mobile phase composition and wavelength. The results are shown in Table 7.
Table 7: Statistical validation of robustness studies.
Factor Retention time (min) Peak Area (mV.s)
A. Flow Rate
0.9 5.51 2.10
1 5.17 2.15
1.1 4.86 2.08
Mean ±SD 5.18 ± 0.32 2.11 ± 0.03 B. MOBILE PHASE COMP.
(0.1%TFA IN WATER: ACN)
50-50 4.51 1.81 45-55 5.17 1.98 40-60 5.52 2.04 Mean ± SD 5.06 ± 0.51 1.94 ± 0.11 C. Wavelength
342 nm 5.10 2.14 344 nm 5.17 2.07 346 nm 5.17 2.11 Mean ± SD 5.14 ± 0.040 2.10 ± .0.03
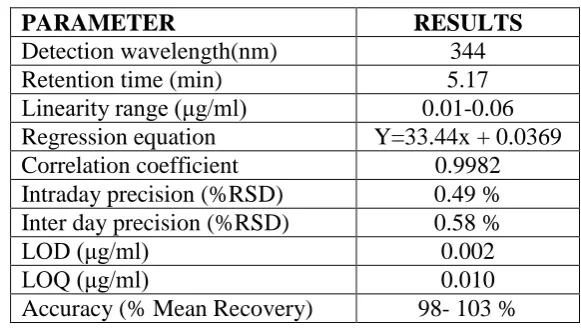
Table 8: Optimized parameters.
PARAMETER RESULTS
Detection wavelength(nm) 344 Retention time (min) 5.17 Linearity range (μg/ml) 0.01-0.06 Regression equation Y=33.44x + 0.0369 Correlation coefficient 0.9982 Intraday precision (%RSD) 0.49 % Inter day precision (%RSD) 0.58 % LOD (μg/ml) 0.002 LOQ (μg/ml) 0.010 Accuracy (% Mean Recovery) 98- 103 %
System Suitability Test
SST is commonly used to verify retention time, column efficiency and Tailing factor of a
chromatographic system to ensure its adequacy for a particular analysis. According to the
United States Pharmacopoeia (USP) and the International Conference on Harmonization
[image:9.595.150.441.89.254.2](ICH), SST is an integral part of many analytical procedures. SST results shown in Table 9.
Table 9: system suitability test (SST) parameters.
PARAMETER DATA OBTAINED
BERBERINE
Retention Time 5.04 Theoretical plate 9888 Tailing factor 0.996
Analysis of marketed formulation Samples. Extraction Procedure
The 5 ml of sample has been taken and extracted in 5 ml of Acetonitrile by keeping it on
ultrasonic bath for 10 to 15minutes. Filtered it through whatmann filter paper. The final
solution was make up with mobile phase. This solution was analysed using the developed
method. The results for analysis of marketed formulation are shown in Table 10.
Table 10: Quantification in multicomponent formulation.
Formulations Concentration of
Berberine found (μg/ml)
Standard deviation
Formulation 1 (3 x) with
Other constituents 0.010 ±0.0017 Formulation 2 (2x) with
Other constituents 0.017 ±0.0013 Formulation 3 (3x) with
CONCLUSION
From the results obtained, it is obvious that the proposed HPLC method is applicable for the
determination of Berberine in Homeopathic formulations. The intra-day and inter-day
variability and accuracy results were found in acceptable limit. Simplicity of the method,
economical nature and low limit of detection and quantification in marketed formulations
with other active constituents makes the method superior from other methods. This method
analysis Berberine in presence of other active constituents in homeopathic marketed
formulations were its concentration were in dilutions as 2X ,3X and not in exact in μg/ml that
this method has achieved and its an added advantage.
REFERENCES
1. https://www.revolvy.com/main/index.php?s=Berberine.
2. Agarwal SS, Paridhavi M. Herbal drug technology. University Press. Hyderabad, 2007; 1:
1-2.
3. Pharmacognosy and Plant Cultivation, 1st ed. New Delhi, CBS Publishers and
Distributers, 2008; 11-16. 3.s
4. Kumar T. Standardization of herbal drugs – a review. Int journal of universal pharmacy
and bio sciences, 2013; 2(4): 7-18.
5. http://www.raysahelian.com/berberine.html.
6. American Herbal Pharmcopoeia, Cs. Hc, 2007.
7. Weber, H. A. and Maureen, J. 2001. Extraction and HPLC analysis of alkaloids in
goldenseal-application. Consumer Products and Drug Manufacturing/QA/QC, Agilent
Technology, 24: 87-95.
8. Kursinszki, L., Sarkozi, A., Kery, A., and Szoke, E. 2006. Improved RP-HPLC Method
for analysisof isoquinoline alkaloids in extracts of Chelidonium majus. Chromatographia,
63: 131-135.
9. Tsai, P. L. and Tsai T. H. 2002. Simultaneous determination of berberine in rat blood,
liver and bile using microdialysis coupled to high-performance liquid chromatography.
Journal of Chromatography A, 961: 125-130.
10.Berberine: Chemistry and Biological Activity I. V. NECHEPURENKO, N. F.
SALAKHUTDINOV a nd G. A. TOLSTIKOV Vorozhtsov Novosibirsk Institute of
Organic Chemistry, Siberian Branch of the Russian Academy of Sciences, Pr. Akademika
![Figure 1: Chemical Structure of Berberine.[10]](https://thumb-us.123doks.com/thumbv2/123dok_us/834181.593147/2.595.190.392.274.402/figure-chemical-structure-of-berberine.webp)