In
fl
uence of Substrate Temperature on the Structure
and Cohesive
/
Adhesive Strength of Fe
Co
Si
B
Nb Metallic
Glass Coating Films Produced by Thermal Spraying
Masahiro Komaki
1, Tsunehiro Mimura
1, Saori Tsuji
1, Kenji Amiya
2,
Yasunori Saotome
2and Tohru Yamasaki
31Nakayama Steel Works, Ltd., R&D Division, Osaka 551-8551, Japan
2Institute for Materials Research, Kansai Center, Tohoku University, Himeji 671-2280, Japan 3University of Hyogo, Himeji 671-2280, Japan
The influence of the substrate temperature on the structure, pore distribution and cohesive/adhesive strength of FeCo-based metallic glass coatingfilms has been examined. The metallic glass coatingfilms have been produced by a thermal spraying technique using our developed cylindrical nozzle on SS400 substrates. The splat morphology of the sprayed particles changed from an irregular splash to a disk shape at a transition temperature of about 300°C. When the substrate temperature increased to the transition temperature region (300323°C), the porosity in the boundaries between the sprayed coatingfilms and the substrates decreased. This can be produced by the strong increase in the wettability of the sprayed particles which is accompanied with a morphological change from splashed to disk-shaped particles. At temperatures ranging from 375 to 400°C, the porosity in both the boundary and inside regions decreased, and the volume fraction of the amorphous phase increased with temperature, resulting in a increase in the cohesive/adhesive strength up to about 27 MPa. [doi:10.2320/matertrans.M2012282]
(Received August 20, 2012; Accepted September 26, 2012; Published November 25, 2012)
Keywords: ironcobaltsiliconboronniobium, metallic glass, sprayed coating film, thermal spraying method, substrate temperature,
cohesive/adhesive strength
1. Introduction
In our previous study, the influence of the substrate
temperature on the structure, pore distribution and cohesive/
adhesive strength of FeCr-based amorphous coating films
was examined by a thermal spraying technique using our
developed cylindrical nozzle on SS400 substrates.1)
The volume fraction of amorphous phase in the sprayed
coatingfilms was found to strongly dependent on the cooling
rate of the sprayed particles. This volume fraction increased at temperatures ranging from 325 to 400°C. In this temper-ature region, the heat transfer may be substantially increased with substrate temperature because of the lower porosity in the boundary region, resulting in a higher cooling rate of the sprayed particles. Therefore, the optimum substrate temper-ature providing the maximum cooling rate of the sprayed particles may be determined.
In the present study, the influence of the substrate
temperature on the structure, pore distribution and
cohe-sive/adhesive strength of FeCo-based metallic glass coating
films have been examined with the aim to collect the basic
data required for spray-coating soft magnetic materials onto various magnetic sensors.
2. Experimental Procedures
The thermal spraying equipment used in this study was
composed of a gas flame spraying gun and a cylindrical
nozzle. The thermal spraying material was a gas-atomized
Fe36Co36Si4B20Nb4 (FeCo, numbers indicate at%) powder
(grain size: 6388 µm) with a melting temperature of 1103°C.
SS400 steel plates (120 mm©120 mm©6 mm) were used as
substrates. The surface finishing of the substrates was done
by shot blasting with alumina powders, while the surface
roughness was adjusted to about Ra=4 µm. The
micro-vickers hardness of the thermal sprayed coatingfilms on the
substrates was measured by using a 0.2 kg load and a loading time of 10 s at the center of the inside region in cross section.
Structural analysis of the sprayed coating films was carried
out by X-ray diffraction (XRD, CuK¡ radiation with a
graphite monochromator, 40 kV, 200 mA) and scanning electron microscope (SEM, 15 kV, Hitachi SU1500). The volume fraction of the amorphous phase in the sprayed
coatingfilms separated from the substrate was estimated by
measuring the heat evolution during crystallization in differ-ential scanning calorimetry (DSC, SII 6220) with a heating
rate of 40°C/min under a high-purity argon gas atmosphere.
The weight of the samples was set to about 20 mg.
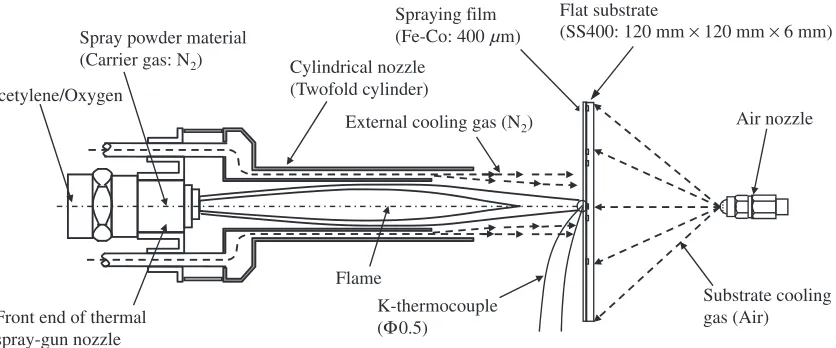
Figure 1 shows a schematic illustration of the cylindrical
nozzle-type thermal spraying gun and the flat substrate.
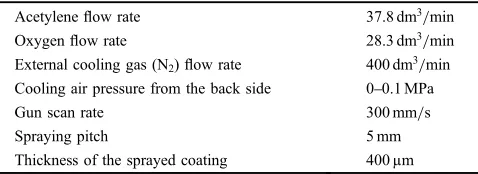
Table 1 summarizes the thermal spraying conditions used in the present study. In order to prevent the formation of oxides
in the sprayed coatingfilms, theflame was kept in a reducing
[image:1.595.310.549.419.506.2]atmosphere by using an acetylene-rich gas fuel mixture while Table 1 Thermal spraying condition for FeCoSiBNb metallic glass
coatingfilms.
Acetyleneflow rate 37.8 dm3/min
Oxygenflow rate 28.3 dm3/min
External cooling gas (N2)flow rate 400 dm3/min
Cooling air pressure from the back side 00.1 MPa
Gun scan rate 300 mm/s
Spraying pitch 5 mm
Thickness of the sprayed coating 400 µm
introducing nitrogen gas into the cylindrical nozzle.2) With the aim to control the substrate temperature, the cooling air pressure from the rear side was controlled to be between 0 and 0.1 MPa with an intermittent operation of thermal spraying, as described later in Fig. 5.
Figure 2 shows schematic illustrations of the tensile test
specimen used for measuring the cohesive/adhesive strength
between the sprayed coating film and the substrate. In
particular, Fig. 2(a) shows the tensile test specimen. The
substrate was first bonded to an aluminum dolly (effective
area: 314 mm2, diameter: 20 mm) using the 3M Company
adhesive agent AF163-2, and then annealed at 120°C for 2 h to harden the adhesive. Figure 2(b) shows the assembly diagrams of the tensile test jig and the tensile test specimen. The aluminum dolly and the substrate were installed in upper and lower test jigs, respectively. The cross-head speed of the
tensile test was set to 1 mm/min.
Figure 3 shows the shape of the substrate designed to
measure the cohesive/adhesive strengths of the tensile test
specimens with an effective area 20 mm in diameter. As a pretest, substrate surface temperatures at the center points of
the four central specimens (6, 7, 10, 11) and the center point of the substrate were measured by the spot-welded K-thermocouples, respectively. In the result, the temperature
difference of five points changed less than «5°C. For this
reason, the substrate surface temperature was measured at the center point by a spot-welded K-thermocouple as a typical temperature. After the thermal spraying treatment, the substrate was cut along the dotted lines by wire cutting equipment. Finally, four specimens around the
K-thermo-couple were selected for subsequent cohesive/adhesive
strength measurements. After bonding the coated substrate
and the aluminum dolly, the remaining sprayed coatingfilm
was removed from the effective area by shot blasting. With this purpose, a ring groove with a 2 mm depth around the 20 mm diameter area was used for precise removal.
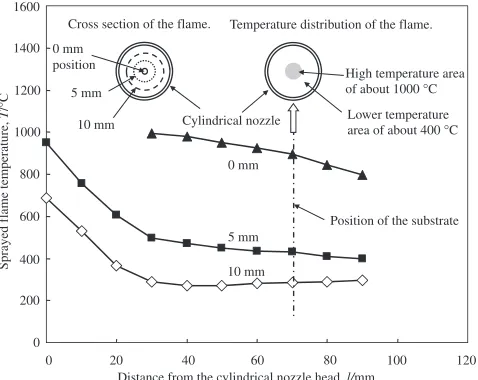
Figure 4 shows the thermal gradients of the spraying
flame, as measured by the thermocouple, along the distance
from the cylindrical nozzle head to the substrate. In this diagram, the 0 mm curve indicates the thermal gradient in the
center of the flame, while the 5 and 10 mm curves refer to
the thermal gradient at the corresponding distances from the
Flat substrate
(SS400: 120 mm × 120 mm × 6 mm)
Flame
Spraying film (Fe-Co: 400 µm)
External cooling gas (N2) Spray powder material
(Carrier gas: N2) Cylindrical nozzle
(Twofold cylinder)
Front end of thermal spray-gun nozzle Acetylene/Oxygen
Substrate cooling gas (Air)
Air nozzle
K-thermocouple (Φ0.5)
Fig. 1 Schematic illustration of the cylindrical nozzle-type thermal spraying gun and theflat substrate.
Upper test jig Tensile direction
Tensile test piece Aluminum dolly (Φ20)
Sprayed coating film (Φ20) Fe-Co
(b)
Ring groove with the 2 mm depth
Substrate SS400
Tensile direction Lower test jig Adhesive agent (Φ20)
3M AF163-2
30 mm × 30 mm × 6 mm (a)
[image:2.595.94.512.71.245.2] [image:2.595.107.486.286.487.2]center of theflame. Although theflame hits the substrate at a temperature of approximately 1000°C at its center, this temperature decreased sharply to about 300 and 500°C at 10 and 5 mm, respectively, from this position.
Figure 5 shows the thermal spraying scanning patterns on the SS400 substrates. The spraying gun was mounted on a
robot arm and scanned at a feed rate of 300 mm/s. In afirst
step, the thermal spraying was started at point A, and subsequently scanned back and forth along the solid lines with a 10 mm pitch. Once the spraying reached point B, the
spraying gun was returned to point A and held in standby while the substrate temperature decreased to the preset value. In the second step, the scanning pattern was shifted about 5 mm downward. In the third step, the scanning pattern returned to that of the 1st step. After that, these steps were repeated until reaching the preset thickness value of the
sprayingfilms.
Metal: SS400
120 6
Φ20 2
1 2 4
5 6 7 8
9 10 11
Φ26 30
Tensile test side
Cross-section observation and XRD area
Wire cut line
Spot-welded
Selected specimens to measure the cohesive/adhesive strength
K-thermocouple (Φ0.5) Ring groove with
the 2 mm depth
K-thermocouple
(Sprayed coating film: Fe-Co)
120
30
12 3
Fig. 3 Shape of the substrate designed to measure the cohesive/adhesive strengths of the tensile test specimens with an effective area 20 mm in diameter.
0 200 400 600 800 1000 1200 1400 1600
0
Sprayed flame temperature,
T
/
°
C
Distance from the cylindrical nozzle head, l/mm Cylindrical nozzle
5 mm
10 mm
Cross section of the flame.
0 mm position
Lower temperature area of about 400 °C High temperature area of about 1000 °C Temperature distribution of the flame.
0 mm
5 mm
10 mm
Position of the substrate
120 100
80 60
40 20
Fig. 4 Thermal gradients of the spraying flame, as measured by the thermocouple, along the distance from the cylindrical nozzle head to the substrate.
Waiting position of the cylindrical-nozzle type thermal spraying gun.
Flat substrate
(SS400: 120 mm × 120 mm × 6 mm) First scanning line (Feed rate: 300 mm/s)
Second scanning line (Feed rate: 300 mm/s)
Spot-welded K-thermocouple
A
B
10
5
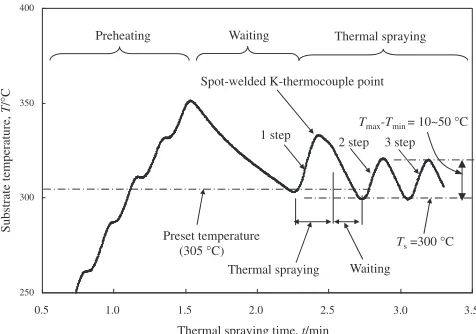
[image:3.595.94.508.72.356.2] [image:3.595.308.547.409.662.2] [image:3.595.51.290.414.604.2]Figure 6 shows a representative example of the substrate temperature over 50 consecutive steps for a given target temperature of 300°C. The substrate temperature was measured by the spot-welded K-thermocouple at the center
point. Figure 7 shows a magnified picture of the dotted
circle area represented in Fig. 6. After preheating the substrate above the preset value (305°C), the gun was held in standby at the starting point while the substrate cooled
down to 305°C. Once this point was reached, the first
spraying step was started. In this case, the bottom
temperature of the substrate (Tmin) was obtained when the
thermal spraying was started, while the local maximum
temperature (Tmax) was reached when the gun was scanned
over the spot-welded point of the K-thermocouple. After
scanning the first step, the gun was held at standby at the
starting point while the substrate temperature decreased to the preset value. Once the substrate temperature had decreased below 305°C, the second spraying step was
started. In this study, 400-µm-thick films were prepared
over 50 steps. Hereafter, the average value of Tmin for all
the steps will be referred to substrate temperature (Ts). In
this case, Ts was 300°C. The difference between Tmax and
Tmin remained within 50°C, and Tmin ranged within «6°C,
as shown in Fig. 8.
3. Results
3.1 Structure of the sprayed coatingfilms
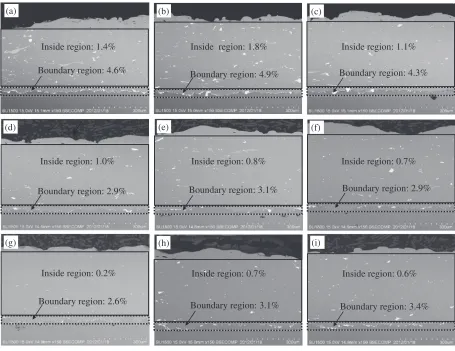
Figure 9 shows cross-sectional SEM micrographs of the
FeCo-based metallic glass coating films on SS400
sub-strates. The pores in the cross sections are shown as white
spots. A high porosity (²4.0%) was observed in the
boundary region framed by the dotted line for Ts¯300°C
(Figs. 9(a)9(c)). The porosity in the boundary region
decreased to about 3.0% at Ts=323°C, and a further
increase in Ts to 401°C led to a drop in the porosity to a
minimum of about 2.6%. Porosity in the boundary region
gradually increased to about 3.4% when Ts increased to
451°C. In the inside region of the sprayed coating film,
framed by the solid line, the observed porosity reached only
1.0% or above at Ts values ranging from 250 to 323°C, as
shown in Figs. 9(a)9(d). AtTs²350°C, the porosity in the
inside region remained below 1.0%, reaching a minimum
value of about 0.2% at 401°C. A further increase in Ts
(451°C) led to a gradual increase in the inside region porosity
to a maximum of about 0.6%. Figure 10 shows the porosity
of the sprayed coatingfilms as a function ofTsas summarized
the results of Fig. 9.
Figure 11 shows the hardness of the sprayed coatingfilms
as a function of Ts. The hardness was found to initially
increase withTs(³HV1080 at 300°C) and dropped thereafter
(³HV1060 at 325°C). The hardness reached a maximum
value of about HV1100 for Ts=450°C.
Figure 12 shows the XRD patterns of the as-sprayed Fe
Co coatingfilms at variousTsvalues. Broad diffraction peaks
(2ª=4050°) were obtained at Ts¯425°C, indicating that
the structure of the sprayed coating films was practically
amorphous. When Ts was increased to 451°C, some sharp
peaks attributable to ¡-Fe, Fe3B and Fe2B phases appeared
superimposed on the broad pattern of the amorphous phase, thereby indicating the partial crystallization of the amorphous phase.
Figure 13 shows the DSC curves for the FeCo sprayed
coatingfilms at variousTsvalues. In the case of the rapidly
quenched ribbon sample, a large exothermic peak was
100 150 200 250 300 350 400 450 500 550 600 0 Substrate temperature, T / ° C
Thermal spraying time, t/min Preheating Thermal spraying
Crystallization temperature (586 °C)
Average bottom temperature of substrate Cooling
Fig.7
Substrate temperature: Ts=300 °C 50 steps 20 18 16 14 12 10 8 6 4 2
Fig. 6 Representative example of the substrate temperature over 50 consecutive steps for a given target temperature of 300°C.
250 300 350 400
0.5
Preheating Thermal spraying
Waiting Spot-welded K-thermocouple point
Thermal spraying Substrate temperature, T / ° C
Thermal spraying time, t/min 1 step
2 step Waiting
3 step Tmax-Tmin= 10~50 °C
Preset temperature
(305 °C) Ts=300 °C
3.5 3.0 2.5 2.0 1.5 1.0
Fig. 7 Magnified picture of the dotted circle area represented in Fig. 6.
200 250 300 350 400 450 500 0
Substrate minimum temperature,
T
/
°
C
Thermal spraying cycle number
Ts= 323 °C Ts = 350 °C Ts = 376 °C Ts = 401 °C Ts = 425 °C Ts = 451 °C
Ts= 250 °C Ts = 274 °C Ts = 300 °C
65 55 45 35 25
15 20 30 40 50 60
10 5
[image:4.595.306.548.67.257.2] [image:4.595.48.288.68.233.2] [image:4.595.50.288.289.456.2]observed with a peak temperature of 600°C. For powder
(grain size: 3863 µm), peak temperature shifted to higher
value as compared with ribbon sample. This may be attributed to a compositional shift due to the difference in
a production method. For sprayed coating films, the peak
temperatures did not change with an increase in Ts as
compared with powder.
Figure 14 shows the volume fractions of the amorphous
phase for the FeCo sprayed coatingfilms as a function ofTs.
These values were estimated from the sizes of the exothermic peaks based on that of the rapidly quenched ribbon sample. The volume fraction of the amorphous phase decreased with
Tsto a minimum value of about 91% at 275°C. This value
increased to a maximum value of about 97%at aTsvalue of
about 400°C, and decreased thereafter.
Boundary region: 2.6% Inside region: 0.2% (g)
Inside region: 1.0%
Boundary region: 2.9% (d)
(b)
Boundary region: 4.9%
(c)
Inside region: 1.1%
(i)
Boundary region: 3.1% Inside region: 0.7% (h)
Inside region: 0.8%
Boundary region: 3.1% (e)
Inside region: 0.7%
Boundary region: 2.9% (f)
(a)
Inside region: 1.4%
Boundary region: 4.6%
Boundary region: 3.4% Inside region: 1.8%
Inside region: 0.6% Boundary region: 4.3%
Fig. 9 Cross-sectional SEM micrographs of the FeCo-based metallic glass coating films on SS400 substrates: (a) Ts=250°C; (b)Ts=274°C; (c)Ts=300°C; (d)Ts=323°C; (e)Ts=350°C; (f )Ts=376°C; (g)Ts=401°C; (h)Ts=425°C; (i)Ts=451°C.
0 1 2 3 4 5 6 7 8 9 10
225
Boundary region
Inside region
Substrate temperature, Ts/°C
Porosity (%)
Transition temperature
[image:5.595.70.525.69.420.2]475 450 425 400 375 350 325 300 275 250
Fig. 10 Porosity of the sprayed coating films as a function of Ts as summarized the results of Fig. 9.
900 950 1000 1050 1100 1150 1200
Substrate temperature, Ts /°C
Hardness of the coatings (HV)
[image:5.595.56.283.463.655.2]225 250 275 300 325 350 375 400 425 450 475
[image:5.595.312.540.464.651.2]3.2 Tensile tests
Figure 15 shows the fracture surfaces of the four speci-mens around the K-thermocouple region after tensile tests at
each Ts value. Small fractured areas with dark colored
cohesive/adhesive agent were observed at Ts=350, 401,
425 and 451°C, thereby indicating that the fracture was
caused by the sprayed coating film peeled from the dolly.
However, almost entire fractured area having rough metallic luster surface was created by the fracture inside the sprayed
coatingfilm.
Figure 16 shows the average cohesive/adhesive strength
of the four specimens around the K-thermocouple region (as
previously shown in Fig. 3) as a function ofTs. An increase
in Ts between 250 and 450°C led to increased cohesive/
adhesive strengths (²19 MPa, minimum value at 300°C,
maximum of 27 MPa at 400°C). This maximum can result from the observed decrease in porosity in both the boundary and inside regions, as previously shown in Fig. 10. A further
increase in Ts (²400°C) led to lower cohesive/adhesive
strengths, which may be due to partial crystallization and embrittlement accompanying crystallization of the Fe-based
amorphous phase, as previously shown in Fig. 12.3,4)
4. Discussion
In order to obtain large volume fractions of the amorphous
phase and high cohesive/adhesive strengths between the
sprayed coatingfilms and the substrates, control overTsmay
be an important factor.5,6)
The splat morphology of the sprayed particles has been reported to be a useful parameter to estimate optimum
thermal spraying conditions.5,6)The splat morphology of the
sprayed particles changed from irregular splash to a disk
shape at the transition temperature.5)It is therefore suggested
that the cohesive/adhesive strength is strongly influenced
[image:6.595.48.289.334.529.2]byTs.
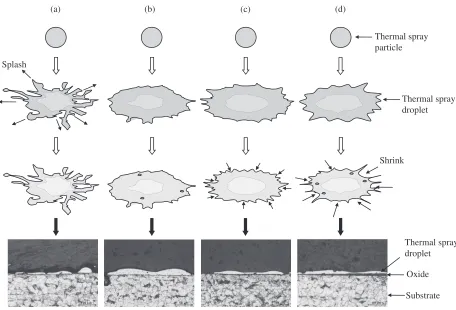
Figure 17 shows the morphological changes of a FeCo
thermal spray droplet on a flat SS400 substrate (90 mm©
90 mm©6 mm) at variousTsvalues. In this case, the thermal
spraying gun was scanned only one time. Figure 18 shows schematic descriptions of the shapes and cross-sectional optical micrographs of the thermal spray droplets represented
in Fig. 17. The droplet splashed irregularly at Ts¯249°C,
as shown in Figs. 17(a) and 17(b). The splat morphology
changed to a disk shape at Ts=300°C, the transition point.
At this temperature, the disk-shaped droplets showed very smooth surfaces with metallic luster, with some small spots that may be small crystallites (indicated by arrows in
Figs. 17(c) and 17(d)). AtTs=400°C, the droplet was also
disk-shaped, although many small branches were observed, as shown in Fig. 17(e). It has been reported that these branches can be formed when the relative wettability between
the droplet and the substrate increases.7)Small spots on the
surface of the droplet were rarely observed at Ts=400°C.
This temperature yielded the maximum volume fraction of the amorphous phase, as previously shown in Fig. 14. When
Tswas increased to 450°C, some spots were observed on the
surface of the droplet and many long branches which shrank by the surface tension effect were observed around it, as shown in Fig. 17(f ). This may be attributed to the decrease of
Intensity /arbitrary unit
2θ/degree
20 30 40 50 60 70 80
Ts= 451°C
Ts= 425°C
Ts= 376°C
Ts= 350°C Ts= 401°C
Ts= 323°C
Ts= 300°C
Ts= 274°C
Ts= 250°C Fe3B Fe2B
α-Fe
Fig. 12 XRD patterns of the as-sprayed FeCo coatingfilms at variousTs values (CuK¡radiation with a graphite monochrometer, 40 kV, 20 mA).
450
Powder
Temperature, Ts/°C
Exothermic /arbitrary unit
Peak
TX
ΔH= 49.1mJ/mg
ΔH= 47.6mJ/mg
ΔH= 46.9mJ/mg
ΔH= 47.3mJ/mg
ΔH= 48.0mJ/mg
ΔH= 46.5mJ/mg
ΔH= 46.6mJ/mg
ΔH= 44.5mJ/mg
ΔH= 44.6mJ/mg
ΔH= 44.9mJ/mg
Ts =451°C Ts =425°C Ts =350°C
Ts =401°C Ts =376°C Ts=274°C Ts=250°C
Ts=300°C
Ts=323°C
Ribbon ΔH= 48.6mJ/mg
650 600
[image:6.595.61.278.587.759.2]550 500
Fig. 13 DSC curves for the FeCo sprayed coatingfilms at various Ts values.
50 55 60 65 70 75 80 85 90 95 100
225
V
o
lume fraction of the amorphous phase (%)
Substrate temperature, Ts/°C
475 450 425 400 375 350 325 300 275 250
the relative wettability between the droplet and the substrate by oxide generation on the surface of the SS400 substrate and the sprayed particles, resulting in partial crystallization and embrittlement accompanying crystallization of the Fe-based amorphous phase. In this temperature region, the adhesion
failure by this droplet may be occurred in the sprayed coating
film, this resulting in the gradual increase in the porosity. On
[image:7.595.101.496.66.466.2]the basis of the results shown in Figs. 14 and 17, it can be concluded that 300°C is the transition temperature for the morphological change of the sprayed droplet, while the optimum temperature leading to a maximum volume fraction of the amorphous phase is about 400°C.
Figure 19 shows the relationships between the porosity (in
both the boundary and inside regions), cohesive/adhesive
strength, and volume fraction of the amorphous phase in the
FeCo sprayed coatingfilms as a function ofTs.
At Ts¯300°C, the volume fractions of the amorphous
phase in the sprayed coating films were high (²90%).
However, a high porosity (>4.3%) in the boundary region
between the sprayed coating film and the substrate was
observed. This may be the result of the low wettability of
the sprayed particles showing irregular splash shape.5,6) In
this temperature region, both the volume fraction of the
amorphous phase and the cohesive/adhesive strength
de-creased with increasing Ts.
AtTsvalues ranging from 300 to 375°C, the porosity in the
boundary region decreased to about 3%, and this can be
attributed to the increase in the wettability of the sprayed
(b) (c)
(d) (e) (f)
(a)
[image:7.595.63.277.514.674.2](g) (h) (i)
Fig. 15 Fracture surfaces of the four specimens around the K-thermocouple region after tensile tests at eachTsvalue: (a)Ts=250°C; (b)Ts=274°C; (c)Ts=300°C; (d)Ts=323°C; (e)Ts=350°C; (f )Ts=376°C; (g)Ts=401°C; (h)Ts=425°C; (i)Ts=451°C.
0 5 10 15 20 25 30 35 40
225
Cohesi
v
e/adhesi
v
e strength,
A
/
MP
a
Substrate temperature, Ts/°C
σ
475 450 425 400 375 350 325 300 275 250
particles as a result of the morphological change from splash
to disk shape.5,6)
At Ts values ranging from 375 to 400°C, the porosity in
both the boundary and inside regions dropped with decrease in viscosity of the sprayed particles, whereas the volume
fraction of the amorphous phase increased with Ts, this
resulting in an enhancement of the cohesive/adhesive
strength up to 27 MPa. In general, the volume fraction of the amorphous phase was found to be strongly dependent on
the cooling rate of the sprayed particles; whenTsis increased,
the cooling rate of the sprayed particles should decrease. In this temperature region, the amount of heat transfer may be substantially increased because of the lower porosity in both the boundary and inside regions, resulting in an improved
(e) (f)
(c)
(a) (b)
[image:8.595.71.526.70.297.2](d)
Fig. 17 Morphological changes of a FeCo thermal spray droplet on a flat SS400 substrate at various Ts values: (a) Ts=200°C; (b)Ts=249°C; (c)Ts=300°C; (d)Ts=349°C; (e)Ts=400°C; (f )Ts=450°C.
(a)
Shrink Splash
Substrate Thermal spray droplet Thermal spray particle
Thermal spray droplet
Oxide (d)
(c) (b)
[image:8.595.69.525.346.656.2]cooling rate of the sprayed particles.8) Therefore, the
optimum Ts value leading to a maximum cooling rate of
the sprayed particles was determined to be about 400°C.
At Ts²400°C, the increase in the porosity was
accom-panied with a drop in the volume fraction of the amorphous
phase with Ts, resulting in a decrease in the cohesive/
adhesive strength to about 20 MPa. In this temperature region, the heat transfer may be negatively affected by a lower wettability as a result of oxide generation on the surface of the SS400 substrate and the sprayed particles, this resulting in a partial crystallization and embrittlement accompanying crystallization of the Fe-based amorphous
phase.3,4)
5. Summary
Control of Ts is the most important point to achieve
Fe36Co36Si4B20Nb4metallic glass coatingfilms with superior
properties such as high hardness, high corrosion resistance, and soft magnetic properties.
The volume fraction of the amorphous phase of the
sprayed coatingfilms was found to be strongly dependent on
the cooling rate of the sprayed particles. The volume fraction
of the amorphous phase was found to increase forTsranging
from 375 to 400°C. In this temperature region, the heat
transfer may be substantially improved withTsas a result of
the lower porosity in both the boundary and inside regions, resulting in a faster cooling of the sprayed particles.
Therefore, the optimum Ts leading to a maximum cooling
rate of the sprayed particles was determined to be around
400°C at which cohesive/adhesive strength was also
maximum.
REFERENCES
1) M. Komaki, T. Mimura, R. Kurahashi, H. Odahara, K. Amiya, Y. Saotome and T. Yamasaki:Mater. Trans.53(2012) 681.
2) M. Fukumoto, C. Yokoi, M. Yamada, T. Yasui, M. Sugiyama, M. Ohara and T. Igarashi:Quarterly J. Japan Weld. Soc.25(2007) 323.
3) M. Douyama and R. Yamamoto:Amorphous Materials, (University of Tokyo Press, Tokyo, 1983) p. 42.
4) A. Inoue:New Functional Materials, Fundamentals of Metallic Glasses
and their Applications to Industry, (Technosystem, Tokyo, 2009) p. 79.
5) M. Fukumoto: Yosha39(2002) 172.
6) M. Fukumoto, Y. Okuwa, M. Yamada, T. Yasui, Y. Motoe, K. Nakashima and T. Igarashi:Quarterly J. Japan Weld. Soc.26(2008) 74.
7) K. Murakami, H. Nakajima, N. Fijita, Y. Hanatate and S. Adachi: J. Thermal Spray Tech.21(2001) 63.
8) K. Murakami: Yosha40(2003) 18.
0 5 10 15 20 25 30 35 40
50 55 60 65 70 75 80 85 90 95 100
225
0 1 2 3 4 5 6 7 8 9 10
Porosity in the boundary region Transition
temperature
Disk and
Splash Disk
Disk and crystallization
Volume fluctuation of the amorphous phase
Porosity in the inside region
Porosity (%)
Substrate temperature, Ts/°C
V
olume fraction of the amorphous phase (%)
Cohesive/adhesive strength
Cohesi
v
e/adhesi
v
e
strength,
A
/
MP
a
475 450 425 400 375 350 325 300 275 250
[image:9.595.48.287.73.250.2]σ