Salicylic Acid Complex Imprinted Polymer Membranes:
Preparation and Separation Characteristics
Yan Dong
*, Lifang He, Xiahong Zhang and Xiurong Jiang
College of Chemistry & Materials Science, Longyan University, Longyan, Fujian 364012, China
Salicylic acid complex imprinted polymeric membranes have been prepared by thermal polymerization using polyvinilidene fluoride membrane as a support membrane, acrylamide as a functional monomer and ethylene glycol dimethacrylate as a crosslinker. The imprinted membranes are characterized by Fourier Transform Infrared Spectrometer (FT-IR), thermogravimetric analysis (TGA) and scanning electron microscope (SEM). It can be found that the structure of imprinted membranes is different from the supporting membrane, and the surface of the supporting membrane is covered with an imprinted polymer layer after polymerization. Adsorption and permeation binding experiments indi-cate that imprinted membranes show high specific binding capacity of template molecule, the selectivity factor of the imprinted membrane for the salicylic acid was 26.4, The optimum polymerization condition is 0.3 mmol salicylic acid, 1.2 mmol acrylamide and 6.0 mmol ethylene glycol dimethacrylate in acetonitrile at 60 C for 24 h. [doi:10.2320/matertrans.M2016136]
(Received April 12, 2016; Accepted July 28, 2016; Published September 2, 2016)
Keywords: molecularly imprinted membranes, salicylic acid, polyvinilidene fluoride membranes, acrylamide, separation techniques
1. Introduction
Molecularly imprinted technology (MIT) has attracted considerable attention in the last few years1). This technique
requires functional monomers surrounding a template mole-cule in liquor, and the mixed liquor can be polymerized by thermal initiation or irradiation with UV light. As a result of the reaction, target molecule is surrounded by functional monomers, and a selected interaction is secured. Adding a crosslinker in the polymerization process provides the im-printed polymers with good mechanical strength, stability and rigidity. Finally, template molecule was removed by ex-traction with suitable solvents. The separation effect of mo-lecular imprinted polymers (MIP) is dictated by the highly specific binding of template molecules2). MIT has been
broadly used in various research fields, including sensors3,4),
drug separation5–7), chromatographic separation8,9) and
bio-logical receptors10).
Molecularly imprinted membrane (MIM) has the advan-tages of combining the selectivity and mechanical properties of the support membrane compared with MIP.
MIM which has micro-porous structure can ease template transport and MIM which has transmembrane macropores can be employed as adsorbing material. Typical MIM synthe-ses which had also been adapted to membrane preparations are based on in situ crosslinking polymerization of functional and crosslinker monomers yielding either self-supported11) or
thin layer composite MIM12). MIM was firstly prepared by
Piletsky et al13). And later, various approaches of preparing
MIM were reported, such as surface imprinting, in situ po-lymerization, dry or wet phase separation and particles com-posite membrane14). Hong15) prepared a composite imprinted
membrane by photo polymerization on the surface of a mi-croporous alumina support membrane. In their study, the re-sults showed that the flux was dramatically improved to 10−8 mol/(cm2·h) and high selectivity factor (α = 5.0) was
tested for the template relative to its analogue.
Salicylic acid (SA) is used as a topical keratolytic and as an external antiseptic and antifungal has been widely applied in many pharmaceutical and cosmetic formulations. It is very important to ensure the quality of SA in biological fluids, and a number of SA measured methods such as chromatographic method and ultraviolet spectrometry method have been devel-oped. However, there are some disadvantages of these meth-ods such as low selectivity, inconvenience and inefficiency. MIM can be characterized by selective transport of SA and rejection of other molecules, which is easier and more effi-cient.
The aim of this study is to prepare a molecularly imprinted membrane for selective SA recognition. The membrane was prepared using a polyvinilidene fluoride membrane as the support, SA as the template, acrylamide (AM) as the func-tional monomer and ethylene glycol dimethacrylate (EGD-MA) as the cross-linker. The chemical structures of the MIM were analyzed by FTIR spectrometry, the morphologies of MIM were characterized by SEM, and the thermal stability of MIM was analyzed by TGA. To evaluate the adsorption prop-erties and selectivity of MIM, adsorption experiments were investigated by UV-Vis spectrophotometry. Importantly, the optimal experimental conditions have been clearly studied.
2. Experimental
2.1 Materials
Acrylamide (AM), Salicylic acid (SA) and acetosalicylic acid were purchased from Sinopharm Chemical Reagent Co., Ltd (China), polyvinilidene fluoride (PVDF) membranes with a nominal pore size dn = 0.45 µm and a diameter of 20.5 mm were purchased from Linyi Zhengheng chemical Glass Instrument Co., Ltd (China), EGDMA (98%) was pur-chased from Sigma–Aldrich (China) and was purified by dis-tillation under vacuum. 2,2-Azobiisobutyronitrile (AIBN) was purchased from Shanghai No.4 Reagent & H.V Chemi-cal Co., Ltd (China). Acetonitrile, methanol and sodium hy-droxide (NaOH) were purchased from Xilong Chemical Co., Ltd (China).
*
2.2 Instruments and apparatus
To measure the UV spectrum of SA in aqueous solution, a UV-5600 spectrometer (Shanghai Yuanxi Analysis Instru-ment Factory, China) was used. The surface features of mem-branes were analyzed by an S-3400N SEM (Hitachi, Tokyo, Japan). FTIR spectra (4000–400 cm−1) were recorded using
an IS10 FTIR spectrometer (Nicolet, USA). TGA of the sam-ples was performed on a STA 449 F3 analyzer (Netzsch, Ger-many) over a temperature range of 25–800 C at 15 C min−1
under N2. X-ray diffraction (XRD) patterns were collected on
a Rigaku D/max-2700 powder X-ray diffractometer (0.08 step/s).
2.3 Synthesis of the imprinted membrane
Circular polyvinilidene fluoride (PVDF) membranes were precoated in a 0.0150 g/mL solution of AIBN in acetonitrile and dried under vacuum for further use. To a stirred solution of salicylic acid, the monomer (AM) and the crosslinker (EGDMA) in acetonitrile was degassed for 5 min with nitro-gen. The PVDF membrane precoated with initiator was coat-ed by the solution and dricoat-ed under nitrogen. The membrane was removed and clamped between two plates of glass, sealed and heated at 60 C for 24 h. The membrane was then treated with a methanol/0.1 molL−1 sodium aqueous hydroxide
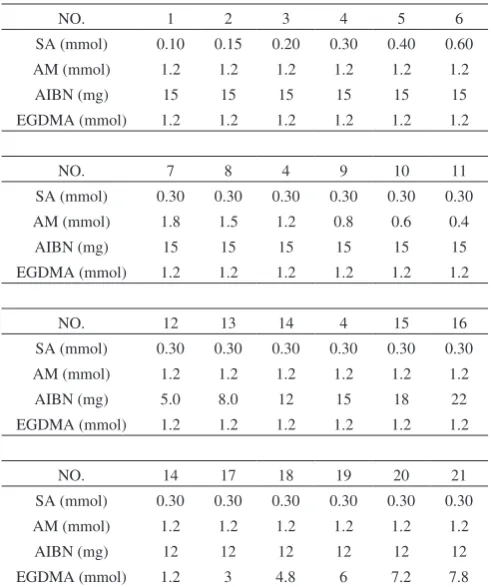
solu-tion (4/1, v/v) solution to remove salicylic acid, AIBN and EGDMA. Finally, the membranes were dried at room tem-perature. For a comparative purpose non-imprinted mem-brane (NIM) were also prepared under the same conditions without adding any salicylic acid during preparation. The prepared formulations are described in Table 1.
2.4 Swelling ratio of the membrane
Wet membrane was prepared by immersing the dry mem-brane in deionized water for 24 h at room temperature, and the membrane was centrifuged at 3000 rpm for 2 min and wiped water on filter paper. Swelling ratio (δ) of the mem-brane was calculated by eq. (1):16)
δ=V2−V1
V1 ×100% (1)
Where V1 and V2 are the volumes of the dry and wet
mem-brane, respectively.
2.5 Porosity of the membrane
Wet membrane was prepared by immersing the dry mem-brane in deionized water for 72 h at room temperature, the membrane was centrifuged at 3000 rpm for 2 min and weight. The porosity (Pr) of the membrane was calculated by eq. (2):16)
Pr=(w2−w1)/ρH2O
VMIM−VPVDF ×100% (2)
Where VMIM and VPVDF are volumes of MIM and PVDF, w1
and w2 are the weight of the dry and wet membrane,
respec-tively, and ρH2O is water density.
2.6 Binding tests
Static binding experiments were conducted to evaluate the recognition property of the membranes toward the target mol-ecule. Imprinted and blank control membrane samples were immersed in 10 ml acetonitrile containing 0.15 mg/mL of SA to test their capability to SA at room temperature for 24 h. The amount of SA adsorbed by the membrane Q is calculated from eq. (3):
Q= (C1−C2)
m ×V (3)
Where, C1 is the concentration of SA in the feed solution, C2
is the final concentration in the collected permeate, V is the volume and m is the mass of the dried membrane. Blank con-trol membranes were conducted for the same procedure.
The selectivity factor was calculated using the eq. (4)17):
α= Rtemplate
Ranalogue (4)
Where, α is the selectivity factor, Rtemplate is the amount of
template retained by imprinted the membrane and Ranalogue is
the amount of the structural analogue retained by the mem-brane imprinted with the template.
3. Results and Discussion
3.1 Swelling ratio
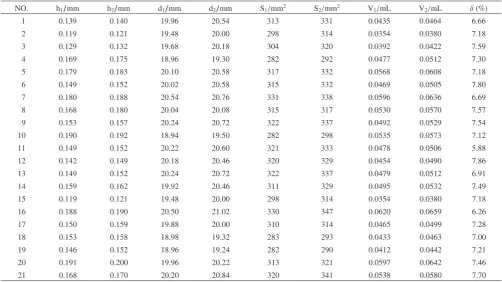
From all the data given in the Table 2, the average swelling ratio was 7.55%, which showed that the membrane can be used in distilled water with a long duration. The structure of membrane was not changed, which indicates that the separa-tion ability of the membrane is stable18).
3.2 Porosity
From all the data given in the Table 3, porosity (Pr) of the
Table 1 Formulation of the composite imprinted membranes.
NO. 1 2 3 4 5 6
SA (mmol) 0.10 0.15 0.20 0.30 0.40 0.60
AM (mmol) 1.2 1.2 1.2 1.2 1.2 1.2
AIBN (mg) 15 15 15 15 15 15
EGDMA (mmol) 1.2 1.2 1.2 1.2 1.2 1.2
NO. 7 8 4 9 10 11
SA (mmol) 0.30 0.30 0.30 0.30 0.30 0.30
AM (mmol) 1.8 1.5 1.2 0.8 0.6 0.4
AIBN (mg) 15 15 15 15 15 15
EGDMA (mmol) 1.2 1.2 1.2 1.2 1.2 1.2
NO. 12 13 14 4 15 16
SA (mmol) 0.30 0.30 0.30 0.30 0.30 0.30
AM (mmol) 1.2 1.2 1.2 1.2 1.2 1.2
AIBN (mg) 5.0 8.0 12 15 18 22
EGDMA (mmol) 1.2 1.2 1.2 1.2 1.2 1.2
NO. 14 17 18 19 20 21
SA (mmol) 0.30 0.30 0.30 0.30 0.30 0.30
AM (mmol) 1.2 1.2 1.2 1.2 1.2 1.2
AIBN (mg) 12 12 12 12 12 12
[image:2.595.46.292.83.377.2]membrane was calculated by eq. (2). The porosities of im-printed membrane were 76.90% which was greater than that of non-imprinted membrane (35.14%) due to template mole-cules. These data proved that the imprinting sites were creat-ed after removing template.
3.3 Polymer preparation and characterization
To confirm the presence of the co-monomers in the synthe-sized copolymers, the FTIR spectra of the polyvinilidene flu-oride (PVDF) membranes and imprinted membrane were performed. As shown in Fig. 1(a) the absorption peaks at 687, 1200, 1270, 1460, 1530 and 1640 cm−1 indicate the existence
of PVDF. The peak at 2940 cm−1 corresponds to dissymmetry
stretching vibration of –CH2– there are no apparent
adsorp-tion bands within 2960–2940 which shows that there is no –CH2– in the PVDF polymer. Due to the –C=O stretching
vibrations, a peak at 1720 cm−1 existed in imprinted
mem-brane does not present in the PVDF s spectrum (Fig. 1(b)). The features around 1140 cm−1 indicate the stretching
vibra-tion of C–N, and the absorpvibra-tion peak of 1473 and 1623 cm−1
are assigned to the carbon skeleton on phenyl ring of SA. It is inferred that the surface of the polyvinilidene fluoride (PVDF) membrane has been covered by the imprinted polymer layer, leading to the typical peaks of PVDF disappeared and the typical peaks of imprinted polymer appeared19,20).
Figure 2 shows the SEM images of the surface morpholo-gies of PVDF membrane, NIM and MIM. It can be inferred from Fig. 2(a) that the network PVDF membrane has obvious porous structure. Polymerization reaction makes a great mod-ification on the PVDF membrane. Figure 2(b) indicates that the surface of membrane was coated with polymer layer. There is no pore could be observed on the surface of the NIM. Figure 2(c) and 2(d) show that there are a large number of pores can be found on the surface of MIM, and these pores are different from those of the blank membrane. The surface porous property has a great effect on the ultimate capability of the imprint composite membranes21).
Table 2 Thickness and swelling of the imprinted membrane around immersion.
NO. h1/mm h2/mm d1/mm d2/mm S1/mm2 S2/mm2 V1/mL V2/mL δ (%)
1 0.139 0.140 19.96 20.54 313 331 0.0435 0.0464 6.66
2 0.119 0.121 19.48 20.00 298 314 0.0354 0.0380 7.18
3 0.129 0.132 19.68 20.18 304 320 0.0392 0.0422 7.59
4 0.169 0.175 18.96 19.30 282 292 0.0477 0.0512 7.30
5 0.179 0.183 20.10 20.58 317 332 0.0568 0.0608 7.18
6 0.149 0.152 20.02 20.58 315 332 0.0469 0.0505 7.80
7 0.180 0.188 20.54 20.76 331 338 0.0596 0.0636 6.69
8 0.168 0.180 20.04 20.08 315 317 0.0530 0.0570 7.57
9 0.153 0.157 20.24 20.72 322 337 0.0492 0.0529 7.54
10 0.190 0.192 18.94 19.50 282 298 0.0535 0.0573 7.12
11 0.149 0.152 20.22 20.60 321 333 0.0478 0.0506 5.88
12 0.142 0.149 20.18 20.46 320 329 0.0454 0.0490 7.86
13 0.149 0.152 20.24 20.72 322 337 0.0479 0.0512 6.91
14 0.159 0.162 19.92 20.46 311 329 0.0495 0.0532 7.49
15 0.119 0.121 19.48 20.00 298 314 0.0354 0.0380 7.18
16 0.188 0.190 20.50 21.02 330 347 0.0620 0.0659 6.26
17 0.150 0.159 19.88 20.00 310 314 0.0465 0.0499 7.28
18 0.153 0.158 18.98 19.32 283 293 0.0433 0.0463 7.00
19 0.146 0.152 18.96 19.24 282 290 0.0412 0.0442 7.21
20 0.191 0.200 19.96 20.22 313 321 0.0597 0.0642 7.46
21 0.168 0.170 20.20 20.84 320 341 0.0538 0.0580 7.70
Table 3 Main parameters of MIM and NIM.
NO. w1/g w2/g H/mm S/mm2 V/mL Pr (%)
SA-MIM 0.0324 0.0498 0.146 282 0.0412 76.9
NMIN 0.0262 0.0353 0.161 276 0.0445 35.1
PVDF 0.062 298 0.0185
[image:3.595.46.549.84.366.2] [image:3.595.309.548.396.606.2] [image:3.595.47.292.406.460.2]TGA22) plots of MIM and NIM were shown in Fig. 3.
There was a slight weight loss of the two samples at tempera-tures between 50 and 350 C, due to the loss of adsorbed wa-ter, acetonitrile, methanol and other volatile residuals. In the case of MIM, the large weight loss region between 350 and 450 C indicates a faster weight loss rate of MIM compared with that of NIM, which is because of the number of pores on the surface of MIM and the open structure of MIM. Thus, the thermal stability of MIM is poorer than that of NIM. After 480 C, both of the membranes are completely decomposed.
3.4 Optimization of reaction conditions
To investigate the effect of reaction conditions on the bind-ing capability of the molecularly imprinted membranes (MIMs), different amounts of SA, AM, EGDMA and AIBN were investigated, and the specific binding capacities were also analyzed.
Table 4 indicates that the quantity of the MIM increased as the elevated amount of SA, and the quantity of the MIM
in-creased to the highest value of 6.11 when the concentration of SA came to 0.30 mmol. After that, the adsorption quantity decreased with further increase of SA. This phenomenon can be explained as follow: at the initial stage of polymerization, a little amount of SA was put in, and then reacted with AM, which results in the imprinted membranes had low binding capacity. With the increase of SA, the binding capacity began to improve, until the amount of SA reached 0.30 mmol. How-ever, it was difficult to produce much more imprinted cavities when excessive SA was added, due to the amount of AINB and AM was constant. What s more, if excessive SA was used, SA would be imprinted on the same site which made the imprinted cavities incomplete, even resulting in the de-crease of adsorption quantity.
Table 5 illustrates that absorbability increased until the content of functional monomer came to 1.2 mmol. After that, absorbability decreased, possibly because AIBN, SA and EGDMA had already completely used up and an excessive amount of AM could not react with AIBN, SA and EGDMA, which resulted in the adsorption quantity decrease.
Table 6 shows that the absorbability of the MIM increased to 7.52 µg/g while the amount of AIBN reached 12 mg. The binding capacity decreased when higher concentrations of AIBN were used and the amounts of SA, AM and EGDMA were unchanged.
Table 7 indicates that while the amount of EGDMA comes to 6.0 mmol, the adsorption quantity of the MIM increased to 9.86 µg/g, at which the absorbability reached maximum and
Fig. 3 Thermogravimetric curves of MIM and NIM.
Table 4 Effects of dosage of template molecule on adsorption performance of the imprinted membranes.
NO. 1 2 3 4 5 6
SA (mmol) 0.10 0.15 0.20 0.30 0.40 0.60
Quantity (µg/g) 2.46 5.08 5.74 6.11 5.83 4.05
Table 5 Effects of amount of functional monomer on adsorption perfor-mance of the imprinted membranes.
NO. 7 8 4 9 10 11
AM (mmol) 1.8 1.5 1.2 0.8 0.6 0.4
Quantity (µg/g) 2.84 3.49 6.11 4.33 4.05 3.21
Table 6 Effects of dosage of initiator reagent on adsorption performance of the imprinted membranes.
NO. 12 13 14 4 15 16
AIBN (mg) 5 8 12 15 18 22
Quantity (µg/g) 4.99 7.24 7.52 6.11 5.27 4.90
Table 7 Effects of dosage of crosslinker on adsorption performance of the imprinted membranes.
NO. 14 17 18 19 20 21
EGDMA (mmol) 1.2 3 4.8 6 7.2 7.8
Quantity (µg/g) 7.52 7.80 9.20 9.86 7.61 7.14 Fig. 2 SEM images of the membranes: (a) PVDF membrane (10000×), (b)
then dropped down even EGDMA dosage increased. This is possibly because as the increase of EGDMA, imprinted cavi-ties increased gradually and became stable, moreover, it was not conductive to removal of template.
Overall, the maximum absorbability of the MIM was ob-tained when the reaction condition was optimized to 0.3 mmol SA, 12 mg AIBN, 6.0 mmol EGDMA and 1.2 mmol AM at 60 C for 24 h.
3.5 Binding isotherms
The binding performance of the imprinted membrane was studied using static binding tests and the Scatchard analysis.
Q
C =
Qmax−Q
Kd (5)
Where Kd is the equilibrium dissociation constant, Qmax is the
maximum adsorption capacity, C is the final equilibrium con-centration of SA in solution, Q is the adsorption capacity of caffeine adsorbed on the membrane at equilibrium.
The binding isotherms plots of MIM and NIM in Fig. 4(a) show that MIM can adsorb much more SA than NIM. The adsorption data were plotted using the Scatchard equation and shown in Fig. 4(b), indicating that the binding sites in the MIM were heterogeneous. The data points are nonlinear be-tween Q/C and Q. However, a straight line could be obtained for 0 ≤ Q ≤ 8.98 µg/g and 8.98 ≤ Q ≤ 11.45 µg/g. The linear-ized plots of the two straight lines were obtained. For 0 ≤ Q ≤ 8.98 µg/g, the equation of linear regression was y =
−0.0123x + 0.155, the related coefficient was 0.998. For 8.98 ≤ Q ≤ 11.45 µg/g, the equation of linear regression was y = −0.00651x + 0.103, and the related coefficient was 0.998. First dissociation constant Kd1 of the high-affinity sites was
81.5 µg/L and the corresponding Qmax1 was 12.6 µg/g. The
dissociation constant, Kd2 of the low-affinity sites was
153.6 µg/L, and Qmax2 was 15.8 µg/g. These results indicate
that there were two binding sites in the MIM, and they showed different affinities for SA when the concentration was the range of 0 0.40 g/L. The reason for this is because the im-printed SA has two binding sites18).
As shown in Table 8, the selective properties of SA im-printed membranes were evaluated by using solutions con-taining SA and aspirin. The concentration of each compound was 0.15 g/L. When the experiments were carried out with imprinted membranes, and imprinted membrane was able to distinguish SA from aspirin.
4. Conclusions
PVDF membrane substrate covered with a SA imprinted layer was successfully prepared by polymerization of AM as a functional monomer and EGDMA as a crosslinker. The op-timum polymerization condition for the preparation is SA:AM:EGDMA = 1:4:20 in acetonitrile at 60 C for 24 h. The Scatchard model described the adsorption behavior of the imprinted complex membrane suitably, and suggests that two binding sites exist in the membrane, Kd1 = 81.5 µg/L,
Qmax1 = 12.6 µg/g and Kd2 = 153.6 µg/L, Qmax2 = 15.8 µg/g,
and selectivity factor was 26.4. In brief, the complex imprint-ed polymeric membranes can be easily synthetizimprint-ed with the method and effectively applied in separating SA, which could be used in alternating the traditional methods for the selective removal of SA and it is significant to devise an efficient meth-od of testing the SA content.
Acknowledgements
This work was supported by the Innovation Experiment Program for university students of Fujian province (No. 201511312051), and School Research Program of Longyan University (LQ2013020).
REFERENCES
1) G. Vlatakis, L.I. Andersson, R. Muller and K. Mosbach: Nature 361 (1993) 645–647.
2) S.A. Piletsky, T.L. Panasyuk, E.V. Piletskaya, I.A. Nicholls and M. Ul-bricht: J. Membr. Sci. 157 (1999) 263–278.
3) P.A. Lieberzeit and F.L. Dickert: Anal. Bioanal. Chem. 391 (2008) 1629–1639.
4) A. Rachkov, S. McNiven, A. El skaya, K. Yano and I. Karube: Anal. Chim. Acta 405 (2000) 23–29.
5) Q.L. Deng, Z.H. Lun, R.Y. Gao, L.H. Zhang, W.B. Zhang and Y.K. Zhang: Electrophoresis 27 (2006) 4351–4358.
6) S.H. Son and J. Jegal: J. Appl. Polym. Sci. 104 (2007) 1866–1872. 7) S.A. Zaidi and W.J. Cheong: J. Sep. Sci. 31 (2008) 2962–2970. 8) F. Liu, C.H. Du, B.K. Zhu and Y.Y. Xu: Polymer 48 (2007) 2910–2918. 9) H.Y. Liu, K.H. Row and G.L. Yan: Chromatographia 61 (2005) 429– Fig. 4 Adsorption isotherms of MIM and NIM (a) and scatchard plots of MIM (b).
Table 8 Selective adsorption of the imprinted membrane.
Q (µg/g) α
SA 9.67
26.4
[image:5.595.144.455.71.198.2] [image:5.595.304.549.253.292.2]432.
10) S.A. Piletsky, H. Matuschewski, U. Schedler, A. Wilpert, E.V. Piletska, T.A. Thiele and M. Ulbricht: Macromolecules 33 (2000) 3092–3098. 11) T.A. Sergeyeva, S.A. Piletsky, A.A. Brovko, L.A. Slinchenko, L.M.
Sergeeva and A.V. El skaya: Anal. Chim. Acta 392 (1999) 105–111. 12) T.A. Sergeyeva, H. Matuschewski, S.A. Piletsky, J. Bendig, U. Schedler
and M. Ulbricht: J. Chromatogr. A 907 (2001) 89–99.
13) S.A. Piletsky, I.Y. Dubei, D.M. Fedoryak and V.P. Kukhar: Biopoly-mers Cell 6 (1990) 55–58.
14) D. Silvestri, C. Borrelli, P. Giusti, C. Cristallini and G. Ciardelli: Anal. Chim. Acta 542 (2005) 3–13.
15) J.M. Hong, P.E. Anderson, J. Qian and C.R. Martin: Chem. Mater. 10 (1998) 1029–1033.
16) C.H. Zhang, F.Y. Hu, H.B. Zhang, H. Li and S.Z. Yao: Acta Chimi. Sin. 67 (2009) 2121–2126.
17) L. Donato, M.C. Greco and E. Drioli: Desal&Wat. Treat. 30 (2011) 171–177.
18) M.Y. Hao, X.L. Hu, P. Guan and F. Yang: Polym. Bull. 6 (2007) 8–14. 19) X.J. Shi, B.J. Gao and X.L. Zhao: Acta Polymerica Sinica. 8 (2013)
1047–1056.
20) J.H. Gao: J. Shandong Ag. Admini. College. 1 (2011) 162–168. 21) X.J. Wang, Z.L. Xu, N.C. Bing and Z.G. Yang: J. Appl. Polym. Sci. 109
(2008) 64–73.