Memry Corporations, Bethel, CT, 06801, USA
4Plasma Physics and Materials Lab., Beijing Institute of Graphic Communication, Beijing 102600, P. R. China
A series of uni-axial tensile cycling tests were conducted at room temperature in superelastic NiTi strip specimens with nano-grain size. The NiTi superelastic strip specimen’s Apparent Young’s Modulus (AYM) and the critical stress decrease when the specimen is subjected to an external uni-axial stress and the strain being higher than 1.5%. Both of the AYM and the critical stress become steady after 10-time cycling. The number of the (111)½1443oriented grains increases with extending the strain value. The sub-grain size grows with increasing mechanical cycling number due to the annihilation of the small angle boundaries. The AYM-softening is related to the grain re-orientation (texture evolution) and the formation of irreversible-stabilized B190martensitic variants. The softness of the critical stress is principally attributed to the aspect that the grains re-orient to align along the two textural components (111)½1110and (111)½1443when the external stress being applied. The rotation of grains towards the observed orientation gives higher Schmid factor for the transformation and is one of the reasons for the decrease in AYM and critical stress. The orientation relationships between B2 parent phase and the strain-induced B190 martensite are observed to be:
½111B2==½1011M,ð1110ÞB2==ð010ÞMand½111B2==½1110Mandð1110ÞB2==ð001ÞM.
(Received September 20, 2005; Accepted January 13, 2006; Published March 15, 2006)
Keywords: Apparent Young’s Modulus (AYM), Critical stress, Mechanical Cycling, Softness, NiTi, texture, microstructure
1. Introduction
NiTi shape memory alloys are widely used for two excellent properties: shape memory effect and the super-elasticity (PE). The applications of NiTi alloys are largely based on the PE through mechanical cycling. But the stability of PE through mechanical cycling is a main concern of the applications of NiTi shape memory alloys in many fields. The PE stability is affected by many factors: test temperature, nickel content, strain rate, previous heat treatment as well as the external stress mode.1–5)The softness of the critical stress
and the AYM happens not only in the tension-torsion tests but also in the bending modes.6) The same phenomena
occurred in both NiTi poly-crystalline1–6)and single
crystal-line materials.7)The softness of some principle mechanical
properties is a universal degradation feature for the NiTi shape memory alloys, and this recess limits the NiTi alloy applications. It is important to decode the mechanisms of the degradation of the mechanical properties in the NiTi binary alloy, the intrinsic understanding for these phenomena was not comprehensive due to the complex impact on these properties regarding the temperature and microstructure factors. On the other hand, nano-science shines light in many fields and some outstanding mechanical properties could be achieved at nano-scale of the grain size. In this paper, we simplify the experimental mode by selecting the commercialized superelastic drawn strip specimens with a nano sub-grain micro-structure and conducted the uni-axial tensile experiments at room temperature. The texture component evolution, sub-grain size, dislocations, phase constituent and transformations are correlated to the me-chanical property degradation.
2. Experimental Details
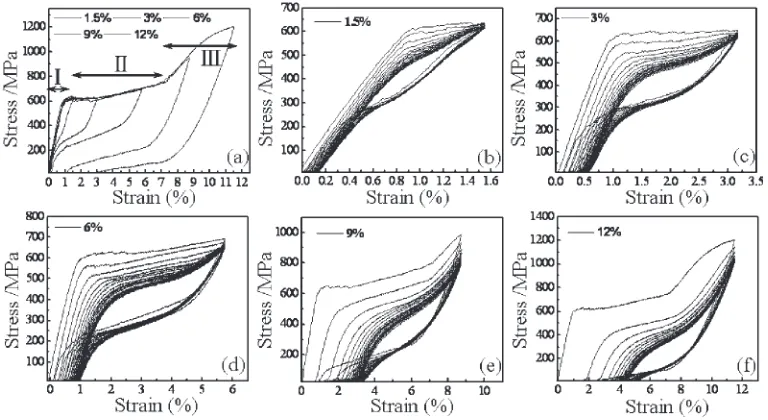
The specimens with a nominal composition of Ti–50.8 at% Ni were supplied by Memry Corporations, USA. The specimens were prepared with a uniform dimension of 0:6mm3:5mm100mm for the uni-axial tensile tests. The tensile tests were carried out on a MTS 810 equipment, with the loading direction being parallel to the rolling direction of the specimen. All of the tests were carried out with a strain rate of1:25103. The strain used in this paper is engineering strain:ðll0Þ=l0. All of the specimens were cycled in the hard cycling mode (with a same maximum strain in every cycle). Every specimen was cycled 20 times, the unloading positions were set up at 1.5, 3, 6, 9 and 12% strain in the strain–stress (S–S) curves, respectively. These unloading positions were picked up on the liner elastic deformation regions of parent to R/B190 martenstie
trans-formation (I) and martenstic variant re-orientation (II) and liner elastic deformation of the B190phase (III) stages. After the mechanical cycling tests, the specimens were firstly cut and mechanical polished to be 100 um followed by a twin-jet electrolyte polishing to the final quality for transmission electron microscopy (TEM) and high resolution electron microscopy (HREM) study. For the X-ray investigation the specimens were mechanical polished followed by a chemical polishing to eliminate the surface stress. The electrolyte solution was 25%HNO3 with 75% methanol. The electro-polish was conducted at40C with 18-volt voltage applied.
The TEM and HREM study were carried out on a JEOL 2010F HREM operated at 200 kv with a double-tilt holder. The X-ray investigations were conducted on a Bruker D8 Discover X-ray diffraction meters operated at 40 KV and 30 mA.
To differentiate the real Young’s modulus of the materials, the Apparent Young’s Modulus is defined to be the slope of *Correspondence authors,
the elastic region in the real S–S curve. AYM may contain grain rotation, dislocation movement and can also be the average effect of the austenite and the martensite phases. The critical stress is defined to be the stress to trigger the slip/ martensite phase transformations during the tensile tests. In the S–S curve it corresponds to the peak value following the elastic deformation region.
3. Results and Discussion
3.1 The microstructures and the texture characteristics of the pre-test specimens
3.1.1 The nano-subgrain structure of the tensile speci-mens
The lattice parameters used in this study are as following: a0¼0:3015nm8)for the parent phase, and a¼0:2889nm, b¼0:4120nm,c¼0:4622nm,¼96:8for the martensite
phase.9) To investigate the mechanisms of mechanical
cycling softness, the microstructures of the pre-test speci-mens were studied firstly. Figure 1 shows the bright field images and the corresponding select area electron diffraction patterns (SAEDP) with different size of selected area aperture: 250 nm for (d), 550 nm for (e) and 1200 nm for
(f). It is found that a quasi-single crystalline electron diffraction pattern is obtained with applying the smallest aperture though multiple ‘‘grains’’ were included. This demonstrates that the grain-like feature is in fact subgrains in which the neighboring disorientation angle varies from 1– Fig. 1 Bright field (BF) images (a, b, c) and the corresponding select area diffraction (SAD) patterns (d, e, f) of the pre-test specimens with
different size of select area aperture. Aperture size:d<e<f. See text for details.
Fig. 2 (a) The’2¼45 ODF section of the pre-test specimen, which shows that there are strong textural components of ½111==ND and
½1221==RD in the specimen. (b) Illustration of the relationship between RD and the LD (loading direction): LD==RD.
[image:2.595.147.452.73.205.2] [image:2.595.308.549.334.487.2] [image:2.595.106.490.548.758.2]5 degrees. Increasing the aperture size as shown in Figs. 1(b) and (c), the diffraction patterns change to be the features of polycrystalline rings and indicate that the high angle grain boundaries are involved. The subsequent investigation reveals that the small angle grain boundaries could be annihilated through the uni-axial tensile cycling.
3.1.2 The textural features of the pre-test superelastic specimens
The preferred grain orientation of the pre-test specimens were studied by X-ray texture analysis. The’2¼45section of the orientation distribution function (ODF) is shown in Fig. 2(a), strong textural components of the ½111==ND (normal direction) and ½1221==RD (rolling direction) are shown in the ’2¼45 ODF section. As can be seen in Fig. 2(b) the loading direction (LD) is parallel to the½1221 direction of most of the grains.
3.2 Tensile test at room temperature
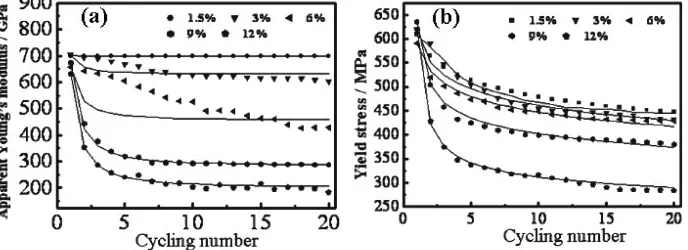
The specimens were cycled at room temperature for 20 times in hard cycling mode (constant maximum strain amplitude) to show the mechanical cycling softness. The stress-strain curves of the specimens unloaded at different positions are shown in Figs. 3(b)–(f). The curves with strain of 1.5, 3 and 6% belong to stage II. The ones of 9 and 12% belong to stage III. Figure 3(a) is the schematic illustration to interpret the distinctive deformation regions of the three stages. The corresponding AYM and the critical stress measured from Fig. 3 are shown in Fig. 4 (dotted lines). The empirical generalized functions of AYM and the critical stress are deduced. For critical stress, it is:
Fi¼AiCð0:1ÞþBiCð2Þ ð1Þ
WhereFiis the applied stress,Cis the cycling number, and
Ai, Bi are constants for specimens unloaded at different
positions. In this study the function of the critical stress evolution with the cycling number is generalized to be:
Fi¼AiCð0:1ÞþBiCð2Þ
¼
A1¼S110andB1¼10; strain¼1:5%
A2¼S230andB2¼30; strain¼3%
A3¼S325andB3¼25; strain¼6%
A4¼S4130 andB4¼130; strain¼9%
A5¼S5130 andB5¼230; strain¼12% 8 > > > > > > < > > > > > > :
ð2Þ
Si is the critical stress of the first mechanical cycling. It is
textural and micro-structural related.
The relationship of AYM with the mechanical cycling number is deduced as:
Yi¼aiCð0:001ÞþbiCð1:5Þ ð3Þ
WhereYiis the AYM and C is the cycling number andai,bi
are constants related to AYM of the first cycling.
Yi¼aiCð0:001ÞþbiCð1:5Þ
¼
a1¼E10 andb1¼0; strain¼1:5%
a2¼E270andb2¼70; strain¼3%
a3¼E3200 andb3¼200; strain¼6%
a4¼E4390 andb4¼390; strain¼9%
a5¼E5430 andb5¼430; strain¼12% 8 > > > > > > < > > > > > > :
ð4Þ
Ei is the AYM of first cycle.
Both of the experimental data (dotted lines) and the simulation data (solid lines) of AYM and the critical stress are plotted in the same figure of Fig. 4. The experimental data satisfy well with the simulated ones. It reveals that the AYM becomes steady after 10 cycles. For the specimens unloaded at 3 and 6%, the AYM becomes to be stabilized after 20 time mechanical cycling. For the critical stress: the experimental data and the simulated ones match very well for all of the specimens and the critical stress become steady after 10 cycles for all of the specimens.
3.3 The macro-texture evolution through mechanical cycling
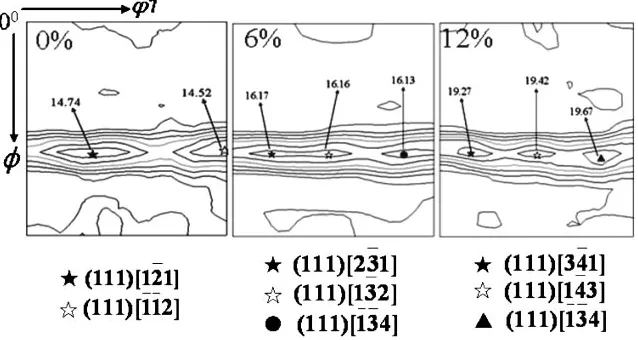
For the specimens unloaded at stage I, it is believed that grain re-orientation through loading is responsible for the softness of the critical stress and the moderate slip of the AYM. In this paper only the specimens unloaded at stage II and stage III are investigated in details. Figure 5 shows the ’2¼45 ODF section detected at room temperature of the three specimens. It reveals that during mechanical cycling process, the ½111==ND keeps invariant and the preferred orientation of the dominant grain population changes from (111)½1221to (111)½1443.
More details can be revealed and quantified from Fig. 6, which shows the fiber (’2¼45, ¼54:7, 0’1 90) andfiber (’2¼45,’1¼0,090) evolution through the mechanical cycling process. For the fiber the Fig. 4 Experimental data (dotted lines) and simulated data (solid lines) of (a) AYM and (b) critical stress for the specimens unloaded at
[image:3.595.128.472.76.201.2]preferred orientation shifts from (111)½11112 to (111)½11334. Forfiber, the textural component changes from (111)½1110 to (556)½1110. The orientation evolution derives from the mechanical cycling effect.
The maximum Schmid factor for triggering the B2–B190
transformation was calculated for 24 martensite variants10) with various loading axis as shown in Table 1. Both the theoretical and experimental habit planes and shear direc-tions were used for the calculation. The used experi-mental habit plane are n¼ f0:8684;0:2688;0:4138g and shear directionm¼ h0:458;0:7706;0:4432i. The used theo-retical ones are n¼ f0:8889;0:21523;0:40443g and m¼ h0:43448;0:75743;0:48737i.10) The rotation of grains
to-wards the observed orientation gives higher Schmid factor for the transformation and is one of the reasons of softening of the AYM and the critical stress.
3.4 Microstructure evolution through mechanical cy-cling
To decode the softness mechanisms unloaded at stages II and III, three specimens are investigated by TEM and HREM: pre-test specimen, specimens unloaded at 6 and 12%.
By studying the representative areas, the sub-grain size is
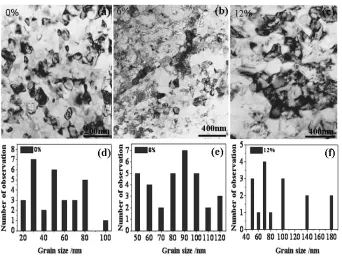
measured from three specimens. The disorientation angle of the neighboring distinguishable domains was measured in detail, the term ‘‘subgrain’’ is used in this study instead of grains. As revealed from Fig. 7, the average sub-grain size in the pre-test specimen is 51 nm. The subgrain size increases to be 83 and 94 nm when applied strain of 6 and 12% for 20 cycles. Increasing the subgrain size, the martensite nuclea-tion becomes easier.11)
Figures 8(a) and (b) shows an example of the residual stress-induced martensite after unloading. The electron dif-fraction pattern (EDP) in Fig. 8(b) can be indexed to be½1110 zone axis EDP of the martensite. The substructure of the martensite is (001) compound twins. Figure 8(c) shows dislocation features left in the matrix. These irreversible dislocation sites may provide nucleation sites for marten-site12–14) and lower the nucleation energy of martensite and
therefore drop the critical stress. The softness of the AYM may come from the residual martensite. Twinning and detwinning of the martensite lowers the AYM sharply. The increasing volume fraction of the residual stress-induced martensites is one of the principle reasons of softness of the AYM.
For the specimens unloaded at stage III, the deformation occurs in the liner elastic region of the B190 phase. Reasonable amount of irreversible deformation strain was Fig. 5 The’2¼45ODF section for the pre-test specimen, unloaded at 6 and 12%, respectively. It shows that through the mechanical
cycling the texture evolves fromf111gh112itof111gh134i.
[image:4.595.139.458.76.246.2] [image:4.595.134.459.298.452.2]kept when the specimen was unloaded. Large amount of dislocations and residual strain-induced martensite can be revealed by TEM and HREM observations. Figure 9(a) shows the low magnification image under TEM observation. Large amount of residual martensites co-exist with B2 parent phase. Figures 9(b) and (c) are the high magnification image taken from Fig. 9(a) to show the twinning structure of the
martensite. The EDP shown in Fig. 9(d) indicates the co-existence of the B2 parent phase and B190martensite and the
orientation relationship between B2 phase and the strain induced B190 martensite as: ½111
B2k ½1011B190. At this
stage, the softness of AYM primarily comes from high volume fraction of martensite in which the deformation largely depends on twinning. The dropping of the critical Fig. 7 The BF image of the specimens unloaded at (a) 0%, (b) 6%, (c) 12%, and the corresponding sub-grain size distributions (d) 0%,
(e) 6%, (f) 12%.
[image:5.595.44.549.94.190.2] [image:5.595.128.470.213.471.2] [image:5.595.102.494.519.652.2]stress comes from high density of dislocations/defects introduced from the irreversible deformation strain. The primary difference between stage II and III is the volume fraction of dislocations and the martensites. The intrinsic softening mechanisms of AYM and critical stress in these two stages keep invariant.
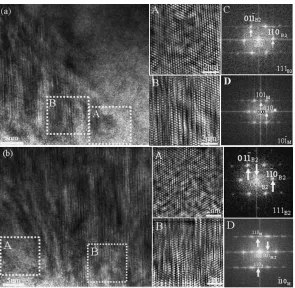
There is a common feature that for all of the specimens unloaded at three stages: both the AYM and the critical stress become steady after 10 cycles. This possibly comes from the fact that the density of defects introduced through the mechanical cycling go to be saturated and stabilized after the 10 time mechanical cycling. Figure 10. shows the HREM images of the specimen unloaded at strain of 12%. They show the microscopic features at the atomic scale of the severely deformed regions. The orientation relationships between B2 parent phase and the B190 martensite can be deduced from
these HREM images: ½111B2==½1011M and ð1110ÞB2==
ð010ÞM in (a) and in (b) ½111B2==½1110M and ð1110ÞB2==
ð001ÞM. Our results basically agree with the ones obtained by
others.9,15,16)Both orientation relationships between B2 and B190 martensite deduced by Otsuka9) and Mohamed15) are observed in this study though a 6.5 degree deviation angle was observed in study.9)
4. Conclusion
Based on the above research results, the following conclusions can be summarized:
(1) The NiTi superelastic strip specimen’s Apparent Young’s Modulus and the critical stress softens when the specimen is applied with external uni-axial stress and strain level higher than 1.5%.
(2) Both of the AYM and the critical stress become steady after 10-time cycling. The f111gh134i oriented grain population increases with increasing strain value. (3) The grain size grows to be bigger with increasing Fig. 9 The BF image (a) and the corresponding SAD pattern (d) of the
[image:6.595.60.278.160.379.2]specimen unloaded at a maximum strain of 12%, (b) and (c) are the enlarged images of the nano-martensite domains in the parent phase matrix with a diameter of about 100–400 nm.
Fig. 10 The HREM images of the specimen unloaded at the strain of 12% after 20 cycles, (a) and (b) show the HREM images and the corresponding fast Fourier transformed (FFT) diffraction patterns of framed regions. The martensite and the parent phases co-exist. The orientation relationship between the martensite and the parent phases can be deduced to be½111B2==½1011Mandð1110ÞB2==ð010ÞM
[image:6.595.152.447.449.737.2]Schmid factor for the transformation and is one of the reasons for the decrease in AYM and critical stress. (6) The orientation relationships between B2 parent phase
and the strain-induced B190martensite are determined to be: ½111B2==½1011M and ð1110ÞB2==ð010ÞM in (a)
and in (b)½111B2==½1110M andð1110ÞB2==ð001ÞM.
Acknowledgement
The investigation was supported by National 973 program under the number of 2002CD613500 and Beijing Education Committee Programs of 05102001200501 and KF050202 (98102001200601).
8) T. V. Philip and P. A. Beck: Trans AIME209(1957) 1269. 9) K. Otsuka, T. Sawamura and K. Shimizu: Phys. Status Solidi5(1971)
457.
10) O. Matsumoto, S. Miyazaki, K. Otsuka and H. Tamura: Acta Metal.35 (1987) 2137–2144.
11) T. Waitz, V. Kazykhanov and H. P. Karnthaler: Acta Mater.52(2004) 137–147.
12) I. W. Chen, Y. H. Chiao and K. Tsuzaki: Acta Metall.33(1985) 1827. 13) G. B. Olson: Metall Trans A7(1976) 1969.
14) T. Saburi and T. S. Nenno: Proceeding of the Internal Conference on Martensite Transformations. Japan: The Japan Inst. Metals, Japan (1986) p. 671.
15) H. A. Mohamed: Ph. D. Thesis, University of California, Berkeley (1976).