Isolation and Characterisation of Starch from Different
Barley and Oat Varieties
Drago Šubarić
1, Jurislav babić
1, alojzije LaLić
2, Đurđica ačkar
1and Mirela kopJar
11Faculty of Food Technology, university of J.J. Strossmayer in osijek, osijek, Croatia;
2agricultural institute, osijek, Croatia
Abstract
Šubarić D., Babić J., Lalić A., Ačkar Đ., Kopjar M. (2011): Isolation and characterisation of starch from different barley and oat varieties. Czech J. Food Sci., 29: 354–360.
Starches were isolated from three oat (Dzoker, Zvolen and Sampionka) and three barley (Barun, Zlatko and Vanessa) cultivars. The gelatinisation and retrogradation characteristics, pasting properties, swelling power, and solubility of the isolated starches were analysed. The gelatinisation onset temperatures varied from 59.4°C to 61.4°C for the oat starches (OS), and from 58.4°C to 62.2°C for the barley starches (BS). BS displayed a higher retrogradation enthalpy (ΔHr) than OS after 7 and 14 days storage at 4°C. OS-Sampionka had the lowest one while BS-Vanessa had the highest ΔHr after 7 and 14 days of storage. Significant differences in pasting properties were observed between the OS and BS. OS showed higher values of maximum viscosity than BS and followed the order: OS-Dzoker > OS-Sampionka > OS-Zvolen > BS-Vanessa > BS-Zlatko > BS-Barun. The breakdown viscosities of BS were considerably lower than those of OS. OS had higher swelling power and solubility values than BS. The higher swelling and solubility values of the oat starches in conjunction with lower retrogradation suggest different applications of these starches. The results showed that, while the barley starches are suitable for such applications where high stability is needed during heating and shearing (low breakdown values), the oat starches have a great potential for the applications where high stability during storage is needed (low ΔHr values). In addition, the barley starches are suitable for those applications where high water binding is undesirable, while the oat starches are applicable where low amounts of starch need to bind high proportions of water.
Keywords: oat; barley; isolation; starch properties
Supported by the Ministry of Science, Education and Sports of the Republic of Croatia, Project No. 113-1130473-0571.
Oat and barley are ones of the major sources of cereal starch. In normal covered oat and barley grain, starch is the major constituent accounting for about 60% of dry matter, followed by total dietary fibre and protein with about 10%, respectively (Asp et al. 1992; Song & Jane 2000; Wang et al. 2007; Vigier et al.
2009). Fat, ash, and low molecular weight sugars are minor components constituting about 0.20% of dry matter, respectively (Andersson et al. 1999). Oats have recently attracted research and commer-cial attention mainly due to their high contents of
β-glucan. The health effects of β-glucan are related to the cholesterol reduction, improved gastrointestinal function, and glucose metabolism (Pins & Kaur 2006). Barley grain is mainly used in the brewing and malting industries and for animal feeds.
has been reported that oat and barley starches from different genotypes vary in chemical composi-tions and properties (Hoover & Vasanthan 1992; Oscarsson et al. 1997; Tester 1997). Starch is widely used in food industry as a thickening agent or stabiliser in order to provide some properties such as favourable texture and appearance. The functional properties of starches are important for their use in food products and industrial ap-plications, especially the pasting properties and gelatinisation and retrogradation characteristics. Gelatinisation of starch is the phase transition of starch granules from an ordered to a disordered state during heating with excess water. It induces a number of changes in starch granules, such as swelling, exudation of amylose and amylopectin, granule disruption, loss of birefringence, and in-creased viscosity (Li et al. 2004; Šubarić et al.
2007; Babić et al. 2009b). The texture and accept-ability of starch-containing foods correlates with the starch retrogradation which has been mainly described as the recrystallisation process of gelati-nised starch. Retrogradation rate is affected by the ratio of amylose and amylopectin, molecular size, temperature, hydrocolloids, suga, and botanical sources (Aee et al. 1998; Babić et al. 2009b). The gelatinisation and retrogradation of starch have been intensively investigated with differential scanning calorimetry (DSC) (Sopade et al. 2004; Koo et al. 2005; Zhong & Sun 2005).
In this study, we isolated starches from three oat (Dzoker, Zvolen and Sampionka) and three barley (Barun, Zlatko and Vanessa) cultivars. The gelatinisation and retrogradation characteristics, pasting properties, swelling power, and solubility of the isolated starches were analysed.
MAterIAl AnD MethODS
Three cultivars of oat – Dzoker, Zvolen and Sam- pionka and three cultivars of barley – Barun, Zlatko and Vanessa were provided by the Agricultural Institute Osijek.
Whole oat and barley kernels were milled with a blender (type Ike Werke M20), for 1.5 min at full speed and suspended in distilled water at a 1:2 (w/v) ratio. The pH was adjusted to 11 with 1M NaOH and the dispersion was stirred for 20 h with a propeller. After the incubation, the slurry was filtered through a cheese cloth with additional distilled water. The starch suspension was allowed
to rest for 30 min and then the supernatant was decanted and centrifuged at 3000 rpm for 10 min-utes. The upper greyish layer was removed with a spatula, the residual starch was suspended in distilled water and passed through a flour sieve to remove the coarse bran. The starch milk was centrifuged at 3000 min–1 for 10 min and the top greyish layer was scraped off. This step was re-peated until the starch was visually clean. The residual starch was suspended in distilled water, neutralised with 1.0M HCl and centrifuged again. The resulting starch was air-dried overnight and than at 40–45°C for 7 hours.
The gelatinisation and retrogradation properties of the isolated starches were analysed using differential scanning calorimeter DSC 822e (Mettler Toledo, GmbH Im, Langacher, Switzerland) equipped with STARe software. The starch samples were weighed into standard aluminium pans (40 μl) and distilled water was added with the help of a Hamilton microsy-ringe to achieve a starch:water suspension containing 65% water. The samples were hermetically sealed and equilibrated for 24 h at room temperature before the heat treatment in the DSC apparatus. The heating was performed at a rate of 10°C/min from 25°C to 95°C. After the heat treatment, the samples were cooled to 25°C and removed from the DSC. The starch gels were aged at 4°C and monitored for retrogradation after 7 days and 14 days. The retrogradation experi-ments were conducted at a heating rate of 10°C/min from 25°C to 95°C. The changes in enthalpy (ΔH
in J/g of dry starch), onset temperature (To), peak temperature (Tp) and conclusion temperature (Tc) for gelatinisation and retrogradation were obtained from the exotherm DSC curves. The experiments were run in triplicates.
The pasting properties of the starch samples were determined using a Rapid Visco-Analyser (Model 803202, Brabender Gmbh & Co KG, Duis- burg, Germany). Starch was suspended in water in 7% concentration (dry basis). 100 g of starch suspension was equilibrated at 50°C for 1 min, heated at 7.5°C/min to 92°C, held at 92°C for 15 min, cooled at 7.5°C/min to 50°C, and held at 50°C for 10 minutes. The experiments were run in triplicates.
shaking water bath with constant shaking. Af-ter the heating, the samples were centrifuged at 4000 rpm for 30 minutes. The precipitated paste was separated from the supernatant and weighed (Wp). The supernatant was dried at 120°C for 4 h and weighed (Ws). The SOL is the percentage of dry mass of the solubles in the supernatant to the dry mass of the whole starch sample (W0).
SOL = (Ws/W0) × 100 (%)
SP is the ratio of the weight of the swollen starch granules after centrifugation (g) to their dry mass (g).
SP = Wp /(W0 – Ws) (g/g)
The experimental data were analysed by analysis of variance (ANOVA) and Fisher’s least signifi-cant difference (LSD) with significance defined at
p < 0.05. All statistical analyses were carried out using software program STATISTICA 7 (StatSoft, Inc., Tulsa, USA).
reSultS AnD DISCuSSIOn
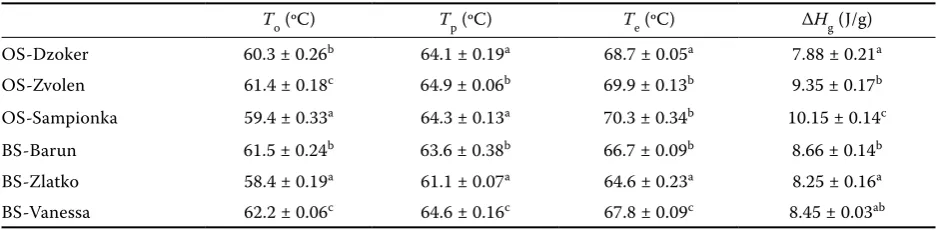
Differential scanning calorimetry (DSC) ther-mal properties of oat (OS) and barley (BS) starch suspensions (35%) are shown in Table 1. The ge-latinisation onset temperatures varied from 59.4°C to 61.4°C for OS, and from 58.4°C to 62.2°C for BS. The gelatinisation peak temperatures of the oat starches were higher than those of the barley starches. Among the OS, cv. Sampionka had the highest value of gelatinisation enthalpy (ΔHg = 10.15 J/g) followed by cv. Zvolen(9.35 J/g), while it was the lowest for cv. Djoker(7.88 J/g). For BS, ΔHg were in range 8.25–8.66 J/g and followed the
order: cv. Zlatko(8.25 J/g) < cv. Vanessa(8.45 J/g) < cv. Barun (8.66 J/g). These differences could be explained by the differences in the amylose contents present in the starches, total molecular dimensions, and internal mobilities as well as by the propor-tion of long chains in the amylopectin structure (BeMiller & Whistler 2009).
[image:3.595.63.532.611.726.2]It has been reported that retrogradation con-sists of two separable processes. The first stage is governed by the gelation of amylose solubi-lised during gelatinisation, and the second stage is induced by the recrystallisation of amylopectin within the gelatinised granules. The enthalpy of recrystallised starch melting is lower than that of gelatinisation, in agreement with the fact that the melting of recrystallised starch during storage is always easier than the melting of native starch granules (Duran et al. 2001). The retrogradation ratio increased with time and at lower temperature (Babic et al. 2006). The results for the retrogra-dation parameters of oat (OS) and barley (BS) starch gels are shown in Table 2. Barley starches displayed a higher retrogradation enthalpy (ΔHr) than oat starches after 7 days and 14 days storage at 4°C. The retrogradation enthalpies of BS varied from 3.36 J/g to 3.82 J/g for the storage period of 7 days, and from 4.24 J/g to 4.54 J/g for the storage period of 14 days. OS-Sampionka had the lowest ΔHr (2.3 J/g after 7 days and 3.76 J/g after 14 days), while BS-Vanessa had the highest ΔHr (3.83 J/g after 7 days and 4.54 J/g after 14 days) after 7 and 14 days of storage. The retrogradation enthalpy values of the OS samples after 7 days and 14 days of storage followed the order: Sampionka< Dzoker< Zvolen. These differences might be related to the sometimes unusually high lipid and protein con-tents in the starch, which may form complexes with these components, causing changes in the
Table 1. DSC gelatinisation properties of oat and barley starch (35%, w/w, db)
To (ºC) Tp (ºC) Te (ºC) ΔHg (J/g)
OS-Dzoker 60.3 ± 0.26b 64.1 ± 0.19a 68.7 ± 0.05a 7.88 ± 0.21a
OS-Zvolen 61.4 ± 0.18c 64.9 ± 0.06b 69.9 ± 0.13b 9.35 ± 0.17b
OS-Sampionka 59.4 ± 0.33a 64.3 ± 0.13a 70.3 ± 0.34b 10.15 ± 0.14c
BS-Barun 61.5 ± 0.24b 63.6 ± 0.38b 66.7 ± 0.09b 8.66 ± 0.14b
BS-Zlatko 58.4 ± 0.19a 61.1 ± 0.07a 64.6 ± 0.23a 8.25 ± 0.16a
BS-Vanessa 62.2 ± 0.06c 64.6 ± 0.16c 67.8 ± 0.09c 8.45 ± 0.03ab
transition temperature and increments in the ret-rogradation enthalpy (Frederikson et al. 1998). The onset, peak, and conclusion temperatures of recrystallised starch melting were similar for all samples after 7 days and 14 days storage at 4°C. The onset temperatures were in range 41.0–42.3°C, peak temperatures 51.0–52.7°C, and conclusion temperatures 59.3–61.0°C. The retogradation temperatures for all samples were lower than the gelatinisation temperatures which is due to the formation of small or imperfect crystals during retrogradation (Paredes et al. 1994; Yuan et al.
1993).
The RVA pasting properties of the oat and bar-ley starches are presented in Table 3. Significant differences were observed between the oat and barley starches and between different varieties in their behaviour during heating and cooling in excess water. The pasting properties of starch are affected by the starch granule size, amylose and lipid contents, and amylopectin structure. Amylopectin is primarily responsible for granule swelling, whereas amylose and lipid restrict the swelling (Tester & Morrison 1990).
Oat starches (OS) had higher values of maximum viscosity (Vmax) than the barley starches (BS): OS-Dzoker (910 BU), OS-Sampionka (797 BU), OS-Zvolen (787 BU), BS-Vanessa (568 BU),
BS-Zlatko (445 BU) and BS-Barun (432 BU). The characteristic difference between the oat and barley starch varieties can be attributed to their amylose and phospholipid contents. Phospholipids could form helical complexes with amylose and restrict granule swelling to a lower peak viscosity at a sub-stantially higher pasting temperature (Song & Jane 2000). The barley starches showed an increase in viscosity during the holding period at 92°C (20 min) which means that there was a starch granule frac-tion that was still swelling in this period. All starch samples showed an increase in viscosity during cooling down to 50°C, with respect to the holding period at 92°C. This increase is indicative of the tendency of starch to retrogradation. Among OS, cv. Dzoker had the highest viscosity at 50°C (1750 BU) followed by cv. Sampionka (1549 BU), while it was the lowest for cv. Zvolen (1068 BU). Viscosity for BS at 50°C followed the order: Zlatko (668 BU) < Barun (820) < Vanessa (887).
[image:4.595.70.533.101.343.2]The breakdown viscosities of the BS were con-siderably lower than those of the OS: BS-Zlatko (3) BS-Vanessa (14), BS-Barun(18), OS-Zvolen (105), OS-Sampionka (344) and OS-Dzoker (570). The ability of starches to withstand heating at high temperature and shear stress is an important fac-tor in many processes. High values of breakdown are associated with high peak viscosities, which in Table 2. Retrogradation properties of oat and barley starch starch gels after 7 days and 14 days at 4°C
To (ºC) Tp (ºC) Te (ºC) ΔHr (J/g)
Retrogradation after 7 days at 4°C (n = 3)
OS-Dzoker 41.3 ± 0.15a 52.0 ± 0.30b 60.3 ± 0.23a 2.50 ± 0.09c
OS-Zvolen 41.3 ± 0.24a 51.0 ± 0.24a 61.0 ± 0.27 4.09 ± 0.09b
OS-Sampionka 41.4 ± 0.08a 51.9 ± 0.35b 60.2 ± 0.23a 2.30 ± 0.07a
BS-Barun 41.9 ± 0.13a 51.3 ± 0.37a 59.3 ± 0.10a 3.36 ± 0.03a
BS-Zlatko 42.3 ± 0.27b 52.7 ± 0.35c 60.8 ± 0.33c 3.81 ± 0.07b
BS-Vanessa 41.9 ± 0.18a 52.0 ± 0.42b 60.0 ± 0.29b 3.83 ± 0.03b
Retrogradation after 14 days at 4°C (n = 3)
OS-Dzoker 41.0 ± 0.15ab 50.6 ± 0.30b 60.3 ± 0.23a 4.39 ± 0.09b
OS-Zvolen 40.8 ± 0.24a 50.3 ± 0.23 60.0 ± 0.27a 4.46 ± 0.08b
OS-Sampionka 41.1 ± 0.08b 51.6 ± 0.35c 60.1 ± 0.22a 3.76 ± 0.08a
BS-Barun 41.2 ± 0.06a a50.5 ± 0.37 60.2 ± 0.03a 4.52 ± 0.01b
BS-Zlatko 41.1 ± 0.01a a50.5 ± 0.36 60.1 ± 0.23a 4.24 ± 0.08a
BS-Vanessa 41.2 ± 0.22a b50.9 ± 0.26b 60.2 ± 0.19a 4.54 ± 0.14b
turn are related to the degree of the starch granules swelling during heating. The setback viscosity of OS was greater than that of BS. Hoover and Va-santhan (1992) explained that the setback values reflect the extent of water immobilisation around the charged centres of the starch components and those of free and helically complexed lipid mol-ecules, rather than starch paste retrogradation. The association of water molecules with these charged centres would decrease the effective water concen-tration in the continuous phase, resulting in a rise in viscosity during the cooling cycle. The extent of water immobilisation (setback) may be greater
in oat starches because of the presence of more charged centres (from the lipid) in the continuous phase (BeMiller & Whistler 2009).
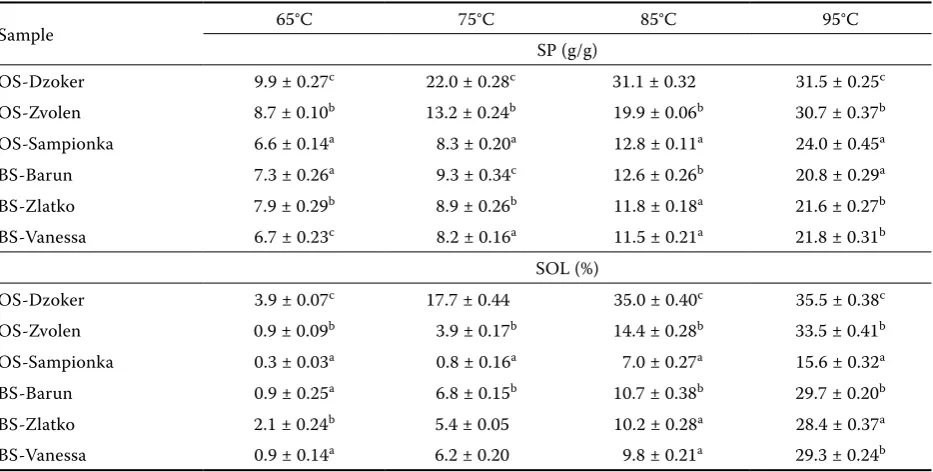
[image:5.595.64.536.100.244.2]Swelling power (SP) and solubility (SOL) of the oat (OS) and barley starches (BS) are presented in Table 4. When the temperature increased, all starches increased their SP and SOL values gradu-ally, up to 95°C, as expected. The SP and SOL of the oat starches differed significantly at all tem-peratures measured. Among OS, cv. Dzoker had the highest values of SP and SOL at all temperatures measured, while these were the lowest for cv. Sam-pionka. For the Dzoker starch, the most important Table 3. Pasting properties of oat and barley starches (7%, w/w, db)
OS-Dzoker OS-Zvolen OS-Sampionka BS-Barun BS-Zlatko BS-Vanessa
Pasting temperature (°C) 61.0 ± 0.3 62.3 ± 0.3 63.4 ± 0.4 71.9 ± 0.3 77.6 ± 0.4 73.2 ± 0.2
Vmax (BU) 910 ± 9.0 787 ± 5.0 797 ± 1.5 432 ± 3.0 445 ± 3.5 568 ± 5.0
Viscosity at 92°C (BU) 444 ± 4.0 740 ± 6.0 742 ± 1.5 393 ± 2.5 346 ± 1.5 465 ± 3.5
Hold 20 min at 92°C (BU) 340 ± 3.0 681 ± 6.5 453 ± 2.0 414 ± 4.5 442 ± 5.0 554 ± 2.5
Viscosity at 50°C (BU) 1750 ± 9.5 1068 ± 7.0 1549 ± 5.5 820 ± 9.5 668 ± 8.00 887 ± 8.5
Hold 20 min at 50°C (BU) 1182 ± 9.5 941 ± 7.5 1374 ± 7.7 732 ± 3.0 645 ± 2.5 861 ± 9.5
Breakdown 570 ± 12.0 105 ± 11.0 344 ± 0.6 18 ± 0.6 3 ± 1.5 14 ± 0.6
Setback 1410 ± 12.5 386 ± 9.5 1089 ± 5.8 405 ± 11.1 225 ± 9.2 332 ± 8.1
OS – oat starch; BS – barley starch; Vmax – maximum viscosity; Breakdown = Vmax – viscosity at 92°C after 20 min; Setback = viscosity at 92°C after 20 min – viscosity at 50°C before holding. Values are means ± SD of triplicate
Table 4. Swelling power (SP) and solubility (SOL ) of oat and barley starches
Sample 65°C 75°C 85°C 95°C
SP (g/g)
OS-Dzoker 9.9 ± 0.27c 22.0 ± 0.28c 31.1 ± 0.32 31.5 ± 0.25c
OS-Zvolen 8.7 ± 0.10b 13.2 ± 0.24b 19.9 ± 0.06b 30.7 ± 0.37b
OS-Sampionka 6.6 ± 0.14a 8.3 ± 0.20a 12.8 ± 0.11a 24.0 ± 0.45a
BS-Barun 7.3 ± 0.26a 9.3 ± 0.34c 12.6 ± 0.26b 20.8 ± 0.29a
BS-Zlatko 7.9 ± 0.29b 8.9 ± 0.26b 11.8 ± 0.18a 21.6 ± 0.27b
BS-Vanessa 6.7 ± 0.23c 8.2 ± 0.16a 11.5 ± 0.21a 21.8 ± 0.31b
SOL (%)
OS-Dzoker 3.9 ± 0.07c 17.7 ± 0.44 35.0 ± 0.40c 35.5 ± 0.38c
OS-Zvolen 0.9 ± 0.09b 3.9 ± 0.17b 14.4 ± 0.28b 33.5 ± 0.41b
OS-Sampionka 0.3 ± 0.03a 0.8 ± 0.16a 7.0 ± 0.27a 15.6 ± 0.32a
BS-Barun 0.9 ± 0.25a 6.8 ± 0.15b 10.7 ± 0.38b 29.7 ± 0.20b
BS-Zlatko 2.1 ± 0.24b 5.4 ± 0.05 10.2 ± 0.28a 28.4 ± 0.37a
BS-Vanessa 0.9 ± 0.14a 6.2 ± 0.20 9.8 ± 0.21a 29.3 ± 0.24b
[image:5.595.65.532.487.723.2]increase in SP and SOL (22.0 g water/g starch; 17.7%) was recorded already at 75°C, and the maximum SP and SOL (31.5 g water/g starch; 35.5%) occurred at 95°C. Among barley starches, SP and SOL values were similar for all varieties at the same temperature. The BS begin to swell gradually at 75°C and 85°C, and reach maximal value of SP and SOL at 95°C (in range 20.8–21.8 g water/g starch; 28.4–29.7%). These maximum SP data of the investigated starches are low if compared to the cassava starch; 60.7 g water/g starch (Babić et al. 2007), but higher compared to some maize varieties (13.7–20.7 g water/g starch) (Sandhu & Singh 2007).
The difference found in SP and SOL between the oat and barley starches could be due to the struc-tural differences, because amylose-amylopectin content, chain length, and chain length distribu-tion are important factors in this pattern. The swelling power of starch has also been reported to depend on the water holding capacity of starch molecules by hydrogen bonding (Lee & Osman 1991). Hydrogen bonds stabilising the structure of the double helices in crystallites are broken during gelatinisation and are replaced by the hydrogen bonds with water, and swelling is regulated by the crystallinity of the starch (Tester & Morrison 1990). Further research is needed to define the molecular structure of isolated starches, but so far, the results suggest a close relationship between solubility and structure.
COnCluSIOnS
The initial gelatinisation temperatures for dif-ferent varieties of oat starch (OS) were in the range of 59.4–61.4°C, and for barley starch (BS) of 58.4–62.2°C. The barley starches had higher ret-rogradation enthalpies (ΔHr) than the oat starches after 7 days and 14 days storage at 4°C. OS-Sam-pionka had the lowest, while BS-Vanessa had the highest ΔHr after 7 days and 14 days of storage. Significant differences in the pasting properties were observed between the OS and BS. The oat starches had higher values of maximum viscosity than the barley starches. The breakdown viscosi-ties of BS were considerably lower than those of OS. OS had higher swelling power and solubility values than BS. The higher swelling and solubil-ity values of the oat starches in conjunction with lower retrogradation suggest different applications of these starches.
references
Aee L.H., Hie K.N., Nishinari K. (1998): DSC and rheo-logical studies of the effect of sucrose on the gelatiniza-tion and retrogradagelatiniza-tion of acorn starch. Thermochimica Acta, 322: 39–46.
Andersson A.A.M., Elfverson C., Andersson R., Regne’r S., Aman P. (1999): Chemical and physical cha-racteristics of different barley samples. Journal of the Science of Food and Agriculture, 79: 979–986.
Asp N.G., Mattsson B., Onning G. (1992): Variation in dietary fibre, β-glucan, starch, protein, fat and hull content of oats grown in Sweden 1987–1989. European Journal of Clinical Nutrition, 46: 31–37.
Babić J., Šubarić D., Ačkar D., Piližota V., Kopjar M., Nedic Tiban N. (2006): Effects of pectin and carrageenan on thermophysical and rheological properties of tapioca starch. Czech Journal of Food Sciences, 5: 275–282.
Babić J., Šubarić D., Ačkar Ð., Kovacević D., Piližota V., Kopjar M. (2007): Preparation and characterization of acetylated tapioca starches. Deutsche Lebensmittel-Rundschau, 103: 580–585.
Babić J., Šubarić D., Milicević B., Ačkar D., Kopjar M., Nedic Tiban N. (2009a): Influence of trehalose, glucose, fructose and sucrose on gelatinization and retrogradation of corn and tapioca starch.Czech Journal of Food Sci-ences, 27: 151–157.
Babić J., Šubarić D., Ačkar Ð., Kopjar M., Nedic Tiban N. (2009b): Acetylation and characterisation of corn starch. Journal of Food Science and Technology, 46: 423-426.
BeMiller J., Whistler R. (2009): Starch: Chemistry and Te-chnology. 3rd Ed. Academic Press, New York: 332–597.
Duran E., Leon A., Barber B., Benedito de Barber C. (2001): Effect of low molecular weight dextrins on ge-latinization and retrogradation of starch. European Food Research and Technology, 212: 203–207.
Frederiksson H., Silverio J., Andersson R., Eliasson A.C., Aman P. (1998): The influence of amylose and amylopectin characteristics on gelatinization and retro-gradation properties of different starches. Carbohydrate Polymers, 35: 119–134.
Hoover R., Vasanthan T. (1992): Studies on isolation and characterization of starch from oat (avena nuda) grains. Carbohydrate Polymers, 19: 285–297.
Koo H.Y., Park S.H., Jo J.S., Kim B.Y., Baik M.Y. (2005): Gelatinisation and retrogradation of 6-year-old Korean ginseng starches studied by DSC. Lebensmittel-Wissen-schaft und -Technologie, 38: 59–65.
Li J.H., Vasanthan T., Hoover R., Rossnagel B.G. (2004): Starch from hull-less barley: IV Morphological and structural changes in waxy, normal and high-amylose starch granules during heating. Food Research Interna-tional,37: 417–428.
Oscarsson M., Parkkonen T., Autio K., Aman P. (1997): Composition and microstructure of waxy, normal and high amylose barley samples. Journal of Cereal Science,
26: 259–264.
Paredes-López O., Bello-Pérez L.A., López M.G. (1994): Amylopectin: structural, gelatinization and retrogradati-on studies. Food Chemistry, 50: 411–417.
Pins J.J., Kaur H. (2006): A review of the effects of barley β-glucan on cardiovasculat and diabetic risk. Cereal Foods World, 51: 8–11.
Sandhu S.K., Singh N. (2007): Some properties of corn starches II. Physicochemical, gelatinization, retrograda-tion, pasting and gel textural properties. Food Chemistry,
101: 1499–1507.
Song Y., Jane J. (2000): Characterization of barley starches of waxy, normal, and high amylose varieties. Carbohy-drate Polymers, 41: 365–377.
Sopade P.A., Halley P.J., Junming L.L. (2004): Gelatiniza-tion of starch in mixtures of sugars. II. ApplicaGelatiniza-tion of dif-ferential scanning calorimetry. Carbohydrate Polymers,
58: 311–321.
Šubarić D., Babić J., Ačkar Ð. Piližota V., Kopjar M., Jukić M. (2007): Effect of guar and pectin on rheologi-cal properties and solubility of corn starch. Works of the Faculty of Agriculture and Food Science, University of Sarajevo,58: 171–178.
Tester R.F. (1997): Influence of grown conditions on bar-ley starch properties. International Journal of Biological Macromolecules, 21: 37–45.
Tester R., Morrison W.R. (1990): Swelling and gelatiniza-tion of cereal starches. I. Effects of amylopectin, amylose and lipids. Cereal Chemistry, 67: 551–557.
Vigier B.J., Choo T.M., Fregeau-Reid J. (2009): Exploring associations between agronomic and chemical compo-sition traits for barley improvement. Cereal Research Communications. 37: 111–119.
Wang R., Koutinas A.A., Campbell G.M. (2007): Dry processing of oats – Application of dry milling. Journal of Food Engineering, 82: 559–567.
Yuan R.C., Thompson D.B., Boyer C.D. (1993): The fine structure of amylopectin in relation to gelatinization and retrogradation behavior of maize starches from three wx-containing genotypes in two inbred lines. Cereal Chemistry, 70: 81–89.
Zhong Z., Sun X. (2005): Thermal behavior and phase behavior of cornstarch studied by differential scanning calorimetry. Journal of Food Engineering 69: 453–459.
Received for publication August 9, 2010 Accepted after corrections September 16, 2010
Corresponding author:
Jurislav Babić, Ph.D., University of J.J. Strossmayer in Osijek, Faculty of Food Technology, Franje Kuhaca 18, P.O. Box 709, 31 000 Osijek, Croatia