Agricultural production differs from other sectors of the economy, such as industry and services, be-cause it is dependent on the life cycles of plants and animals, on the seasons and climate, on the fertility of the soil, water supplies etc. Agriculture is at the base of the food chain. This sector is thus fundamental. Summarizing, agriculture is one of the main contribu-tors of human welfare in different aspects (Villanyi and Singh 2008). Economic changes after 1989 have caused the relevant decrease of gross agricultural production in Slovakia. Our agriculture was signifi-cant in terms of national economy with a high rate of production, self-sufficiency as well as the share of subsidies in the GDP. The realized transforma-tion process in agriculture is characteristic with the decrease of this sector’s share in the GDP composi-tion (Bielik 2003). It is clear that the effects of the transformation process from the centrally planned economy into the market one has directly influenced also the fruit growing industry, what is significantly shown, first of all, by the drop of the natural fruit production. Fruit production has had a long tradi-tion in Slovakia, despite the fact that still less and less producers stick to it. The appropriate soil and climatic condition enable growing a wider diapason of fruit trees, mainly apple trees. It is apparent from the production data, that apples have a dominant position in the fruit production from the view of the production volume and growing areas.
The contemporary situation and level of fruit grow-ing in the Slovak Republic, except for a few special-ized enterprises, is not satisfactory. In comparison with other countries, there is a big lagging behind in the yields, the fruit quality and size as well as in the market layout. Nutritional value of fruit and their taste properties are comparable. The main reasons for the current situation are the failures in choosing the right stand and realization of planting (Gurčík et al. 2007).
The main goal of fruit growers in Slovakia should be to provide the inhabitants with an optimal home fruit production of a high quality in the suitable soil and climatic conditions. Many orchards are too old and cannot guarantee the high quality production. Hričovský et al. (2004) state that the Slovak fruit growing has up to 50% of old poorly treated orchards with only about a half of the potential production, a worse quality of fruits and a shortage of modern storehouses.
Also Kudová and Chládková (2008) confirm that the key task of fruit production is to grow, store and supply fruit in the sufficient amount and quality to satisfy the customers’ needs. Besides, fruit growing is a renewable resource of wealth, it helps sustainable development in the country, and it supports tourism and participates in landscaping.
The overall orchard’s area has a stagnant or decreas-ing trend (Figure 1). One of the possible changes of
Evaluation of economic efficiency of the orchards
investment project with respect to the risk
Zlata SOJKOVÁ, Izabela ADAMIČKOVÁ
Faculty of Economics and Management, Slovak University of Agriculture
in Nitra, Nitra, Slovak Republic
Abstract: Continuous elimination of the acreage of orchards in Slovakia has a negative impact on the overall fruit producti-on. Improvement of the conditions could be achieved by introducing new technological systems into orchards and suppor-ting the measures motivasuppor-ting farmers. Three investment strategies for plansuppor-ting apple orchards are presented in the paper: slim spindle, high density and extended orchards. Economic efficiency of the systems is evaluated through the return of investment, net current value and inner profit percentage. Within the assumption of the objective evaluation of input para-meters, we can expect an acceptable economic efficiency of the investment only in the “slim spindle” technological system. The simplified deterministic evaluation of economic efficiency is further deepened with the identification of the relevant risk factors, followed by its quantification by the simulation processes. Taking the risk into account leads to a significant decrease of the economic attractiveness of investments.
the present state is to implement new systems of fruit growing with the use of scientific knowledge as a guarantee of stable yields. The cause of the negative state are, apart from the biotechnological factors, also high investment costs on orchard establishment.
The problem of the fruit production has not been complexly solved; it is proved by the decrease of the ability to cover the consumption need of Slovak inhabitants, the decrease in the acreage of orchards as well as of per hectare yields and the decrease in the export of home fruit production onto foreign markets. Agricultural companies are forced to fol-low the changes in the market and to adjust their decisions accordingly. Thus, investment decisions can be significant assumptions of reaching and sus-taining the successful development of the company. The focus is also given to finding the most effective technological system of growing and the use of an appropriate opportunity, as well as to the way of its realization.
Only 40–60% of the fruit production potential in Slovakia is used. Based on the indicators like operating costs, we have found out that labour costs represent 29.1% of the total costs. These costs could be reduced through a rational distribution of the working time and by increasing labour productivity. Operating costs could be reduced also by introducing the varieties resistant to different diseases and insects. Reduced operating costs would create the necessary room for producers to increase their competitiveness (Porhajaš et al. 2009).
Economic efficiency of the fruit industry should be a strategic task of the farmers. The decrease of the average fruit production costs is a basic task of competitiveness of the farmers within Slovakia in the EU. It follows that the need of the farms to establish new orchards with a higher production per unit, is really imperative.
According to Pesteanu and Gudumac (2008), the amelioration of the economic efficiency of the yields depends considerably on the strict observance of the
economic regime and the diminution of the non-productive expenses. To fulfil all these tasks in the agricultural farm, it is necessary to systematically analyze all the production expenses, the price cost decrease of the yield production and the increase of labour productivity. The biggest influence on the economic efficiency is that of the yield. The average yield per 1 ha influences directly the income obtained from sales. The fruit yield influences also the costs of 1 kg of production.
It is possible to gain a relatively complex and variant approach to planning the investment projects of fruit orchards by comparison of the economic efficiency of the variant technological systems of planting apple orchards and choosing the most convenient techno-logical system. With regard to the biotechno-logical character of the type of such investment projects, naturally accompanied by the high risk rate, the attention is paid also to the risk analysis.
MATERIAL AND METHODS
From the methodological point of view, the dy-namic access based on the Payback Period (PP), the Net Present Value (NPV) and the Internal Rate of Return (IRR) are used for the evaluation of economic efficiency of the variant technological systems.
The base for the risk quantification by using the simulation techniques is a deterministic calcula-tion of the investment aim efficiency based on the investment project efficiency through projections of the cash-flow on the whole planning horizon of the life-span of the investment into the orchard estab-lishment (Sojková 1999). The simulation process is realized in several phases.
[image:2.595.72.399.72.223.2]In the first phase of the risk analysis, random vari-ables are identified from inputs depending on their character, or the information rate of the decision sub-ject. No all the input random variables predominantly influence the result investment determinants – PP,
Figure 1. Development of produc-tion orchards in Slovakia in the years 2003–2009
Source: VÚEPP, author’s own re-search
5000 5200 5400 5600 5800 6000 6200 6400 6600 6800
2003 2004 2005 2006 2007 2008 2009
NPV and IRR. Another phase of the risk analysis is thus the determination of those input random variables which can represent the decision risk factors. The helping instrument in the determination of the decisive risk factors is a sensitive analysis. This is realized as a sequence of changes of certain input random variables and searching of the impacts on result indicators – PP, NPV and IRR. The risk factors are usually considered to be those input variables, the change of which makes a crucial change of a result indicator, but also those, where it is possible to assume significant changes within the planning horizon. The most demanding phase of the simulation risk analysis is the choice of appropriate types of the probability distribution of risk factors and the assessment of their parameters. It usually requires a combination of the objective and subjective assessment. In our case, only the uniform distributions are used. The result of simulation is to gain the probability distribution of the output vari-ables NPV and IRR. Important output information is also the development of the Net Cash Flow (NCF) for the whole planning investment period.
Describing of technological systems
Regarding the current trends of apple orchards and good market possibilities, three technological systems of growing apple orchards are taken into consideration, and they are different with regard to the apple production, quality, investment and running costs, the number of trees and other input variables (Hričovský 2006). We suggest the conceived, quantified and from the point of view of economic efficiency mutually comparable three technological
systems of growing apple orchards: 1st technological
system – spindle – an intensive way of growing ap-ples (A alternative), 2nd technological system – high
density orchard – an intensive way of apple growing (B alternative), 3rd technological system – an extensive
orchard (C alternative).
The implementation of a new technological system of an orchard requires more phases, from the informa-tion gathering on the given problematic, through the preparation of the necessary materials when assessing all the economic, legislative, logic relations and rules, through the composition of statements necessary for the evaluation of the given technological procedure up to its filling with data. Mastering of the given phases is possible after the consultation with experts from fruit farms. For the objective investment project, it is necessary to analyze not only the economic infor-mation, but also the information on fruit industry, e.g. the consumption of planting material, fertiliz-ers, mechanical equipment, etc. Characteristics of orchards investment project show in Table 1.
In the terms of the input data preparation, it is necessary to come out, at the same time, from the calculation gained at the point of designing and reali-zation of analogical projects and from the up-to-date scientific knowledge on investment decision in terms of planting fruits, especially fruit orchards.
Economic parameters of the system are based on the current input prices (planting material, fertiliz-ers) as well as outputs prices (realization price of apples). When planning earnings, similarly as when planning costs and all the technological systems, it is not counted with the growth of prices in the time.
By the risk evaluation of investment project through simulation procedure, three alternatives of
techno-Table 1. Characteristics of the orchards investment project
Alternative Spindle A High density orchard B Extensive orchard C
Plantation (ha) 10 10 10
Trees per hectare (pc) 3 300 1 330 450
Period of life in years 15 18 25
Fertility period in the years 13 15 22
Capital Expenditure (€/ha) 31 390 20 573 8 576 Share of Crops According to Quality (%)
1st class 80 80 25
2nd class 15 15 35
Non-standard 5 5 40
Strike price per 1 kg in terms of quality (€)
1st class 0.40 0.40 0.40
2nd class 0.20 0.20 0.20
No-standard 0.07 0.07 0.07
[image:3.595.64.531.549.751.2]logical systems are used. The model of investment project – A alternative (technological system “spin-dle”) represents an intensive way of growing apples. The main advantage of a spindle is a simple care, a minimal cut as opposed to the classical shapes, and the harvest directly from the ground, as well as a simpler and much more effective protection. Reaching high yields, thanks to the ideal light condi-tions which shape it, are the coloured fruits, more ripe and mature. Weakly growing rootstock and the way of shaping results in a fast fertility, full fertility starts in the third or fourth year. The time estimation, from the orchard establishment to the first year of fertility connected with costs based on which the orchard is ranked into the use within the given technological system, is 2 years.
The technological system of high density orchard – B alternative – also represents an intensive way of apple growing. The first year of fertility is the fourth year from its establishment. The cost calculation for fencing the orchard is the same as in the A alterna-tive. The period of time estimated from the orchard establishment to the first yield, connected with the costs based on which the orchard is evaluated, is 3 years.
The model of investment project – C alternative (technological system of an extensive orchard) – rep-resents a traditional way of growing apple trees. The part of planting orchard is not drip irrigation which is an important advantage because of the lower invest-ment costs. The first year of fertility is the fourth year from the orchard establishment. The period of time
from the orchard foundation to the first yield where investment costs are calculated, is 3 years. Calculation of the costs needed for the fence of the orchard is the same as in the previous technological systems. The use of industrial fertilizers is annually planned in the volume of 0.40 tonnes per orchard. The costs for supplementary activities are planned for the height of average costs of the chosen companies. Capital expenditure at the options various show in Table 2.
RESULTS AND DISCUSSION
Deterministic evaluation of economic efficiency
Development of operating costs and incomes of eco-nomic activities are transparently shown in Figures 2 and 3. The costs for the orchard liquidation have not been included in the graph, estimated at 4000 € within all the technological system. In Figure 2, the differences in operation costs, which are in the pe-riods of reaching their maximum levels within the (A) alternative “slim spindles” approximately 2.6 times higher than extensive orchards (C), and ap-proximately 1.25 – times higher than high density orchards – C, Figure 2.
Diametrically higher differences can be seen in income (Figure 3), included in the A alternative in periods of the maximal fertilization more than 4 times higher than the C alternative, and 1.5 times higher than the high density orchards – B. Different results of management within the particular technological systems are seen due to a different level of income and cost development.
[image:4.595.62.291.85.143.2]Economic development of incomes and costs as well as investment costs is reflected into the gained level of cash-flow (CF). In this case, liquidation costs (4000 €) are also included in the last year of an or-chard. A different level of investment expenditures and different development of costs and incomes are
Table 2. Capital expenditure at the options various
Various 1st year 2nd year 3rd year Together
A 29 295 2 095 31 390
B 17 222 1 602 1 749 20 573 C 6 505 986 1 085 8 576 Source: author’s own research
Figure 2. Development costs of economic activities in different variants
Source: author’s own research
0 1000 2000 3000 4000 5000 6000 7000 8000
1 2 3 4 5 6 7 8 9 10 11 12 13 14 15 16 17 18 19 20 21 22 23
Euro
Year
A B c
[image:4.595.69.385.612.770.2]eventually reflected in a significantly different net cash-flow in the particular variants.
A positive value of net income is reached already in the 3rd year within the technological system “slim
spindle” (alternative A), there are no investment costs and the apple orchards start giving fruits (Figure 5). A positive value of management can be expected from 4th up to 14th year. In 15th year, a negative CF value
is reached as a consequence of the included orchard liquidation costs. A positive CF value can be reached in 4th year within the high density orchard (B
alter-native). Although the operating incomes in 4th year
are even lower than the costs, after the operating deduction by depreciation, a positive CF value can be expected up to 17th year of the orchard.
A traditional technological system – the extensive orchard (C alternative) can, even despite the low investment cost, reach a positive CF value from 6th
year up to 24th year. Liquidation costs are included
in 25th year. The economic result might be positive
in 7th year and higher operating earnings rather than
costs can be expected.
In Figure 3, there are shown potentially reachable expected values of the criteria of economic efficiency within the particular technological systems and their variants. Net present value (NPV) is considered to be the prior criterion, and then there comes the internal rate of return (IRR). Payment period (PP) is rather a supplementary criterion due to the fact that it does
not consider the time value of money (in case it is calculated from the non-discounted CF). Moreover, net cash-flows after the return period are not taken into account when it is calculated.
After comparing all three technological systems in apple orchards, presuming the investment from own sources, it comes out that the positive NPV can be expected at the A alternative – spindles (NPV = 8148 €) and the high density orchard – B (NPV = 2050 €). Both investment projects are considered to be effec-tive, however, with a different rate of profitability. As it has been mentioned, at spindles the internal rate of return can reach 14.24%, the high density orchard only 10.72%. Within the B alternative, the IRR exceeds the discount rate only by 0.72%.
In case the discount rate was higher than 10.72%, which is highly probable after the increases of risk premium, the NPV would reach a negative value. The investment projects of the high density apple orchard financed from own sources are principally effective, how-ever, with a relatively low rate of profitability. Under the unfavourable conditions – low yields, high maintenance costs, etc., the NPV could decrease below zero.
[image:5.595.65.368.68.243.2]The alternative C – extensive orchards – cannot be counted with a positive NPV due to the fact that its expected value represents – 2565 € with an internal rate of profitability of 6.08%. The IRR reaches a lower level than the considered discounted rate. A positive NPV could be expected only under the assumption
Figure 3. Development of operating income in various alternatives Source: author’s own research
0 2000 4000 6000 8000 10000 12000 14000 16000
Euro
Year
A B c
1 3 5 7 9 11 13 15 17 19 21 23 25 (€)
Table 3. Criterion comparison of the economic efficiency of technologies and their variants. Financed from own re-sources
A B C
NPV (€) IRR PP (years) NPV (€) IRR PP (years) NPV (€) IRR PP (years) Value 8 148 14.24% 7.15 2 050 10.72% 9.10 –2 565 6.08% 12.91 Points 100 100 100 25.16 75.28 78.58 –31.48 42.72 55.35
Average points 100.00 59.67 22.20
[image:5.595.66.534.677.751.2]that we would count with a discount rate lower than 6.08%, and that would mean a critical decrease of the risk premium and thus an underestimation of the investment risk.
We would get analogical results also by compar-ing the return rate of investment costs within the particular variants. The lowest return rate can be expected in the A alternative (PP = 7.1 year), in the B alternative, it is higher (9.1 years). Within the al-ternative C, the return of investment costs can be expected after almost 13 years (12.91).
Based on the value comparison of all three criteria – the NPV, IRR and PP (Table 3), it seems that the A alternative is dominant to the B, the C alternative and the B alternative are dominant in comparison with the C alternative. If an investor were to decide between the A, B and C alternatives, he/she should choose the A alternative – spindles. This type of deci-sion making is reasonable in case he/she is provided with no more information and thus does not know the risks of the particular investment projects.
Figure 4 provides the NPV development for the particular alternatives of investment projects A, B and C in dependence with the changing discount rate.
Not only the differences in the NPV level at a different discount rate, but also the different decreasing NPV tendencies for the particular alternatives are evident in the graph. The NPV development is not linear, at lower levels of the discount rate, it drops down faster and the fall is very slight at a higher discount rate. In Figure 5, there is evident also the different profit percentage, reached within the particular al-ternatives, as follows: 14.24% – A, 11.34% – B and 6.08% – C. At the discount rate equal to the IRR, the NPV starts reaching negative values. Internal rates of profit stand for the discount rate and by its increase, an investment would become ineffective. A graphic display shows the NPV sensitivity within the particular alternatives, a discount rate and it also proves the results of the previous analysis.
[image:6.595.67.413.72.262.2]Figure 5 shows the development of the non-dis-counted cash flow (CF) for all three alternatives (variant A, B and C – financed from own sources) during the whole life-span of apple orchards, which is different. It clearly points out at the diametrically different tendencies in the CF growth and their dis-tinct maximal value in the last but one year of the orchards’ life-span. Within all the alternatives, the
Figure 4. Effect of the discount rate on the NPV development – Comparison of the alternatives A, B and C
Source: author’s own research
Figure 5. Development of the cash-flow comparison of the alternatives A, B and C Source: author’s own research
-35,000 -30,000 -25,000 -20,000 -15,000 -10,000 -5,000 0 5,000 10,000 15,000
1 2 3 4 5 6 7 8 9 10 11 12 13 14 15 16 17 18 19 20 21 22 23 24 25
Euro
Year
cF A cF B cF c
-20000 -10000 0 10000 20000 30000 40000 50000 60000
n
PV
Discount rate
A B c
14.24% 11.34%
6.08%
60 000
50 000
40 000
30 000
20 000
10 000
0
–10 000
–20 000
[image:6.595.64.407.614.761.2]CF falls rapidly down in the last year as a conse-quence of the orchard liquidation costs. Analogical tendencies show also the discounted CF, however, at a lower level. The NPV significantly depends on the chosen discounted rate. Its increase fundamentally influences the investment projects with a low NPV level where also its low increase has a result in the negative NPV.
Risk analysis
When analyzing the investment project risk of spindle, which appeared to be economically the most efficient, in the first phase we identified the criti-cal risk factors. Mostly, the risk factors are those, where 10% change evokes more than 10% change of the NPV, IRR.
First of all, the yields and prices were proved by the selection. Increasing one or the other determinant by 10% leads to the increase of the NPV by 5375 €, which means by 65.9%. The second decisive risk factor is the investment costs, where an increase of either one determinant by 10% leads to the NPV increase by 5.9%. The second crucial risk factors are investment costs where 10% increase could cause the NPV drop by almost 32.24%. Other important risk factors are personal costs where 10% increase could lead to the NPV drop by 12.16%. Significant risk factors could
also be caused by the “supporting activities” (NPV decreases by 8.74%).
As a result of the simulation, we do not get one NPV value but the whole probable distribution. In comparison with the deterministic calculation, the mean NPV value significantly differs. It reaches the value of approximately 4175 €, as opposed to 8148 € at the deterministic modes as a result of the expectation of rather negative assumptions in comparison with the positive ones, mainly with yields, which together with prices mostly influence the NPV and IRR. The NPV variability, expressed by the standard deviation represents 6 386 € and thus the variable coefficient reaches the value of 153%.
Out of the gained outputs, we can expect with 90% probability that the NPV can move within the interval from –5820 € up to a positive border 14 240 €. Such an assumption is basically different in comparison with the deterministically assumed positive NPV. Based on the interval, it can be expected that an investment can be non-efficient but also efficient. Such a result is a consequence of a high variability of the final NPV, caused mainly by a high assumption of the probable variability of yields and prices.
[image:7.595.304.530.471.750.2]From the more detailed analysis of graphical view of the NPV distribution, as well as from the calcula-tion of critical values of division, it is evident that the probability of not reaching the positive clear current value mildly exceeds 30%, which means a really high
Table 4. Summary statistics for the NPV
Statistics Percentile Minimum –9 887.93 5% –5 815.96
Maximum 19 902.85 10% –4 427.63
Mean 4 175.01 15% –3 274.51
Std Dev 6 386.50 20% –2 219.35
Variance 40 787 389 25% –1 111.36
Skewness 0.0172 30% –72.52
Kurtosis 1.9639 35% 907.40 Median 4 089.61 40% 1 994.88 Mode 10 469.24 45% 3 030.85 Left X –5 815.96 50% 4 089.61
Left P 5% 55% 5 189.14
Right X 14 244.35 60% 6 295.58 Right P 95% 65% 7 394.71 Diff X 20 060.31 70% 8 469.57 Diff P 90% 75% 9 542.05 80% 10 552.16 85% 11 581.21 90% 12 850.79 95% 14 244.35 Source: author’s own research
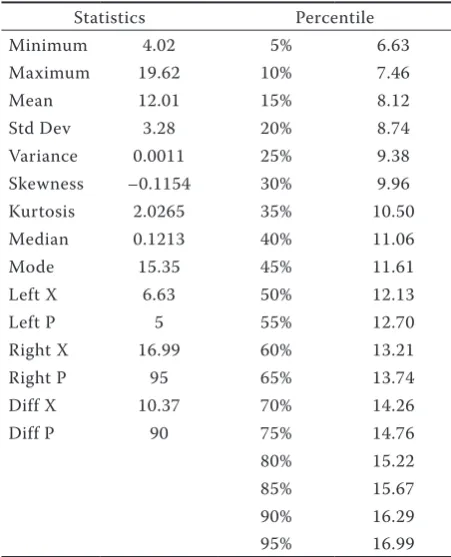
Table 5. Summary statistics for the internal rate of return (%)
Statistics Percentile
Minimum 4.02 5% 6.63
Maximum 19.62 10% 7.46
Mean 12.01 15% 8.12
Std Dev 3.28 20% 8.74
Variance 0.0011 25% 9.38 Skewness –0.1154 30% 9.96 Kurtosis 2.0265 35% 10.50 Median 0.1213 40% 11.06
Mode 15.35 45% 11.61
Left X 6.63 50% 12.13
Left P 5 55% 12.70
Right X 16.99 60% 13.21
Right P 95 65% 13.74
Diff X 10.37 70% 14.26
Diff P 90 75% 14.76
[image:7.595.65.288.472.750.2]risk (Table 4). Based on the assumption that the risk assumptions for the particular factors in simulation model were highly probable, not very many investors would be willing to bear such a high risk.
Analogically, the IRR distribution can be used, shown in Table 5. The mean IRR value represents 12% which is by 1.76% lower than the deterministic model (12.24%). The distribution of an indicator accompanied by the middle variability rate with the standard deviation 3.28% with variable coefficient of 27%.
A visible contribution of the application of the simulation procedure within the quantification in-vestment risk projects lies in the identification of the decisive risk factors, i.e. those random variables, which significantly contribute to not reaching the expected NPV. Another contribution is to gain the estimated values of destination variables (CF in cer-tain years, NPV and IRR) and the provision of the complex probable value distribution of the given destination variables.
Based on the mentioned NPV or IRR distributions, the decision making subject can dispose of other fundamental information which can contribute to the quality of the decision making process. Firstly, these are the information on the probability distribution of the destination variables, the information on the possible reaching of an unpleasant result as well as the potential possibilities for the entrepreneurial success.
CONCLUSIONS
After comparing the results of economic efficiency in the particular technological systems, it comes out that an investor should not decide among spindles in apple orchards and the high density orchard (B), or extensive orchards (C); he/she should prefer a project of apple orchard – spindles. The decision of the investor should concentrate on the choice of appropriate varieties, not only according to the expected average yield, but also the risk.
Lowering the risk could be reached by a better work management and the input of scientific knowledge into production (fertilisation, mulching, etc). Farmers, who use irrigations in the full extent, have a real chance to reach higher realization prices due to the higher production quality, reaching thus adequate profits. By a proper harvest management we can increase the costs on the harvest technology, however, decrease the labour costs.
Out of the results proving that the NPV exceeds the level, under the presupposition that the risk factors considered in the simulation models are highly
prob-able; hardly any investor would be willing to bear (in our opinion) the relatively high risk. These results correspond with the deterministic estimations, in which, as we say, in the case of financing investments from own sources, the project of apple orchard – the A variant – is effective, but with a relatively low rate of economic efficiency. The investment risk of apple orchards lies mainly in the fact that the decision of the investor is irreversible.
The choice of the technological system of apple orchard growing becomes a crucial decision which must be made professionally, based on the objective economic criteria. The investment project “models” of apple orchards can be inspiring and helpful also when evaluating economic efficiency of other in-vestments, not only in the agricultural sector. The input information, necessary for the quantification of efficiency, has always been a decisive factor in the qualified evaluation of the investment projects regarding their economic efficiency. The objectivity of inputs destinations, basically, determines the qual-ity, thus the value of the output information for the evaluation of the project efficiency. Very significant is also the analysis of the gained results and the choice of a particular investment project – the final deci-sion. The decision making process on the choice of an investment project must be a decision of a more interdisciplinary character. In the case of planting apple orchards, at least an expert from a fruit industry is needed, as well as an economist and an expert in the use of quantitative instruments. Only such a team decision can meet the conditions of a qualified deci-sion. The so- called “model instrument for qualified investment decision” is valuable for an investor, in a deterministic as well as a stochastic form.
Application possibilities of the estimated investment projects on the apple orchards technological systems are significant in the given context. The decision mak-ing process is possible through input parameters, as for example investment costs, the orchard acreage, running costs, yields, the real product price, etc. Thus, investment project models have become a methodo-logical instrument, applicable in different conditions (economic, climatic, etc.) in a certain period as well as by a prediction instrument. From the application aspect, the input parameter objectivity, needed for economic efficiency, becomes very demanding. Input data are deterministically estimated based on the analysis of the present state in the fruit industry, as well as the estimated future expectations. From this point of view, input data are to a certain extent also “expert” estimations.
common to encounter a pessimistic and optimistic variant, presenting the realization of extreme condi-tions. This problem can be avoided by the application of the simulation processes, and thus it provides a more-dimensional view on the economic efficiency of investment. An investor thus does not consider only the expected net current value, but takes into account also the expected risk of the investment. Thus, the decision making process becomes more professional, objective, however, more demanding, at the same time, with regard to the decision making subjects. The assumption of the investment project preparation, at present time in our opinion, still remains optimistic.
REFERENCES
Bielik P. (2003): Štrukturálne zmeny v slovenskom po�nohos-trukturálne zmeny v slovenskom po�nohos-podárstve (Structural changes in the Slovak agriculture). In: Zborník prác z medzinárodnej vedeckej konferencie. PEF ČZU, Praha, pp. 26–30; ISBN 80-213-1085-5. Gurčík Ľ., Adamičková I., Felixová I. (2007): Fruit
grow-ing in Slovakia under condition of the European union. In: The Path of Internationalization and Integration in the Europe of Regions. Editura Ceres, Bucuresti, pp. 160–166; ISBN 978-973-709-322-6.
Hričovský I., Paulen O., Šimala D., Horčín V. (2004): Ovo-cinárstvo (Fruit Growing). Ústav vedecko-technických
informácií pre pôdohospodárstvo, Nitra, Ministerstvo pôdohospodárstva SR (CD).
Hričovský I., Hronec O., Kováč K. et al. (2006): Environ-mentálne aspekty po�nohospodárskych technológií (En-vironmental Aspects of Agricultural Technology). SPU, Nitra; ISBN 80-8069-694-2.
Kudová D., Chládková H. (2008): Barriers to the entry into the fruit producing industry in the Czech Republic Agricultural Economics – Czech, 54: 413–418. Pesteanu A., Gudumac O. (2008): Economic efficiency of
apples production in case of plantation fondation with crowned apple trees. Bulletin UASVM, Horticulture,
65: 519.
Porhajaš V., Bielik P., Adamičková I. (2009): Produkčné schopnosti slovenského ovocinárstva v podmienkach trhovej ekonomiky (Production potential of Slovak fruit sector). Acta Oeconomica et Informatica, 12: 6–10. Sojková Z. (1999): Aplikácia analýzy rizika v investičnom
rozhodovaní (Application of risk analysis in investment decisions). In: Zborník príspevkov z odbornej konfe-rencie k aktuálnym otázkam rozvoja českej ekonomiky a univerzitného ekonomického vzdelávania. Konvoj, MZLU, Brno, pp. 142–148; ISBN 80-85615-87- 8. The Research Institute of Agricultural and Food
Econom-ics. Available at http://www.vuepp.sk
Villanyi L., Kumar Singh M. (2008): Agriculture productiv-ity indicators and impact of environmental change on CEECS agriculture. Acta Oeconomica et Informatica,
11: 35–39.
Arrived on 31st May 2011
Contact address:
Zlata Sojková, Izabela Adamičková, Slovak University of Agriculture in Nitra, Tr. A. Hlinku 2, 949 76 Nitra, Slovak Republic