With 8 text-figures Printed in Great Britain
IONIC DISTRIBUTION IN AMOEBA PROTEUS
BY ROBERT D. PRUSCH* AND PHILIP B. DUNHAM Department of Zoology, Syracuse University, Syracuse, New York
(Received 18 October 1971)
INTRODUCTION
In amoebae the concentration of K greatly exceeds that of Na, but both are generally greater than the external concentrations. The factors determining the distribution of inorganic ions and maintenance of ionic gradients in protozoa are by no means clear. Klein (1959, 1961, 1964) showed in a series of studies with Acanthamoeba sp. that both Na and K were actively accumulated from the environment as well as being bound intracellularly. Chapman-Andresen & Dick (1962) postulated the active expulsion of Na and passive distribution of Cl ions in Chaos chaos. They felt that ion binding, especially of Na, played little in the role of ionic regulation of this animal. On the other hand, Bruce & Marshall (1965) discount the active transport of any ionic species across the plasmalemma of Chaos chaos. The present study was undertaken to in-vestigate the distribution of inorganic ions across the plasmalemma of Amoeba proteus and how this distribution is maintained.
The results of this study demonstrate that both Na and K are actively transported in Amoeba proteus. K is actively accumulated from the environment and Na is actively eliminated from the cell, although other factors are probably partially responsible for the distribution of both Na and K. The effect of Ca on Amoeba proteus in a high-Na medium is to decrease the internal concentration of Na by decreasing the Na per-meability of the plasmalemma. Ca acts by associating with binding sites, perhaps in the plasmalemma.
MATERIALS AND METHODS Culture techniques
Samples of Amoeba proteus were obtained from mass cultures grown in Prescott-James medium (1955) and fed on Tetrahymenapyriformis. The composition of freshly made Prescott-James medium (control medium) and that from which the amoebae have been harvested is given in Table 1. The cultures were kept at 17 °C in the dark, and were fed and washed every 48 h. The generation time of the amoebae under these conditions was approximately 48 h; 1 g of amoebae could be harvested from a culture dish (14 x 9 in.) after 4 days. Before being used in an experiment the amoebae were starved for 24 h and washed twice in fresh culture medium.
Cell weight and volume
After experimental treatment a 25 ml suspension of cells was concentrated by gentle centrifugation for 1 min. The cells were then packed into pre-weighed 10 ml Kolmer
• Present address: Division of Biological and Medical Sciences, Brown University, Providence, Rhode Island 03912.
Table i . Intracellular K, Na, Ca and Cl concentrations of Amoeba proteus and Prescott-James medium, both fresh (control medium) and that from which the cells have been harvested
(Standard errors and number of determinations are given.)
Cells mM/kg cells
K 24-8310-43(63) Na i-o8±o-O7 (60) Ca 2-93 ±0-03 (26) Cl 973 ±0-13 (45) mM/1
Medium Control Culture
K 008 o i 4 ± o - o s (35) Na o-o o-o2±o-o2 (45) Ca 0-03 o-io±o-O4 (20) Cl 008 0 1 6 ± 0 0 8 (20)
tubes by centrifugation at i6oog for 5 min. Wet weight of each sample was at least 100 mg. Since sample volume and thus the number of cells per sample was kept con-stant throughout each experiment, changes in the wet weight of the packed pellets were proportional to changes in cell volume.
Extracellular space
Extracellular space of the packed cell pellets was determined by adding 0-02 fiCi of [14C]inulin (New England Nuclear Corp.) to the Kolmer tube containing the cells just prior to centrifugation. Exposure of the cells to inulin for up to 30 min did not change the apparent extracellular space. Therefore the cells did not accumulate inulin to a degree that would give erroneous estimates of the extracellular space. Radioactivities of samples of the cell extracts (see below) and dried samples of the supernatant were determined in a gas-flow counter. The mean extracellular space used in all experiments to calculate intracellular concentration was 8-3 ± 1-4 (s.D., N = 65).
Chemical analyses
Cell pellets were extracted for chemical analysis in 10 ml of distilled water plus 2 drops of glacial acetic acid. These suspensions were heated near boiling in a water bath for 10 min and allowed to stand overnight. Cellular debris was then removed by centrifugation. Na, K and Ca concentrations were analysed with a Coleman flame photometer. Cl concentrations were determined with an Amino-Cotlove Cl titrator. Amounts were expressed as mM/original kg cells, after correction for extracellular space. In most experiments cell volume was constant within 10%.
Flux measurements
Electrical measurements
Membrane potentials were measured using glass micropipettes filled with 3 M-KC1. Resistance of these micropipettes ranged from 15 to 30 MO. The recording chamber consisted of a glass slide with a circular depression 3 mm deep and 16 mm across. An Ag-AgCl wire circled the base of the chamber and served as the indifferent elec-trode. No means were employed to restrict the movement of the amoebae.
Resistance of the plasmalemma was determined using two of the micropipettes inserted into a cell. Current in the form of a depolarizing or hyperpolarizing ramp (5 x io"9 A/sec) of about 3 sec duration was applied to one micropipette through a 100 MXi resistor from a modified Tektronix 162 waveform generator. The ramp voltage also served to trigger and drive the horizontal sweep of a Tektronix 564 storage oscilloscope. The other micropipette, used to record changes in membrane potential, was connected through a d.c.-pre-amplifier to the vertical amplifier of the oscilloscope. The resulting current-voltage tracings on the oscilloscope were photo-graphed with a Polaroid camera. The slopes of the tracings were used to calculate the resistance of the plasmalemma.
Surface-area measurements
The surface area of the amoeba was determined after mechanical stimulation of the slide containing the amoebae until they assumed a roughly spherical shape. The diameter of the amoeba was then measured with a calibrated ocular micrometer. The resistance of the plasmalemma in Mii per cell was converted into specific resistance by multiplying by the surface area of the cell to give kii. cm2. The mean surface area (25 measurements) of Amoeba proteus was 5 x io~* cma and the mean volume of a single cell was 1 x io"6 cm8.
Calculations
(a) Unidirectional fluxes. In a closed two-compartment system the rate coefficients, &! and k0, of unidirectional efflux, Mo and influx, M,, respectively in moles/time are:
where [C]o and [C]l are the outside and inside concentrations of the substance and Vo
and Fj are the volumes of the two compartments. At steady state where M = M, = Mo,
The rate of change in isotope concentration in the inside compartment is (Sheppard & Martin, 1950):
d[C]t _
dt ~ V0[C]0
where [C]f and [C]* are the isotope concentrations in the inside and outside compart-ments.
With constant volume, equation (2) can be rearranged and integrated between t = 0 and t = 00 to
[CIV, = [Ctf(»,(i-«-*)• (3)
Equation (3) is used to determine the value of (^1 + ^,).100
80
IT 60 s
40
20
20 40 60
[Na]u(mM/l)
80 100
Fig. i. [Na]j as a function of [Nal,. Cells were equilibrated for 4 h in control medium plus the Na,, indicated. Each point represents the mean of 12 determinations in mM/kg cells, and the brackets are the S.E. of the mean. The broken line connects points of equal cellular and external Na concentration.
From £j + k0, and the known volumes and concentrations, the unidirectional influx
in moles/time. volume, Ml[V1, can be calculated by rearranging equation (1):
(4)
RESULTS Intracellular concentrations
The intracellular concentrations of K, Na, Ca and Cl in Amoeba proteus are given in Table 1. The cells were grown in Prescott-James medium, the composition of which is also given in Table 1. Concentrations of K, Na, Ca and Cl are all higher in the medium in which the cells were grown than in the fresh medium, probable due to the addition of Tetrahymena to the culture medium. All of the measured internal con-centrations are higher than those of the medium, but as in most other cells K is the predominant inorganic cation.
Net Na influx
Co.
555
1 2 3 4 5 6
Time (h)
Fig. 2. Kinetics of change in (Na)i when the NaCl concentration of the control medium is increased by 20 mM at zero time. Closed points: [Ca]0 increased to 5 n m at 3 h. Open points: (Ca)0 increased to 5 mM at time zero. Points represent single determinations from one experiment.
the steady-state [Na]t in cells equilibrated in various [Na]0 in the control medium for 4 h. Internal [Na] varied linearly with [Na]0 and was always slightly higher than [Na]0.
Effect of [Ca]0 on [Na]{
Fig. 2 demonstrates the effect of Ca on [Na]j during a net Na influx. External Na was increased to 20 mM initially, with Na, increasing to 25 mM/kg. CaCla was added to 5 mM after 3 h while keeping [Na]0 constant. Internal [Na] fell to approximately 13 mM 2 h after the addition of Ca^ If 5 mM-CaCl2 is added at the same time as the NBQ (lower curve in Fig. 2), [Na], increases to only 11 mM. When either MgClj (3 mM) or KC1 (10 mM) was added instead of CaCla there was no reduction in [Na]t.
The effect of various concentrations of Ca,, on the steady-state [Na], is shown in Fig. 3. The cells were equilibrated in 30 mM-NaCl in the control medium with various concentrations of CaCl^ from 003 to 5-0 mM for 3 h. [Na]0 decreases with increasing [Ca]0. The [Ca]0 at half maximal effect is o-i mM. In the following experiments 3 mM CaCls was used to assure a maximum Ca effect.
Effect of inhibitors on [Na\ and \K\
[image:5.451.95.336.45.312.2]30
25
20
15
10
j _ JL
0-1 0-3 0-5 0-7 1 0
[Gi]o(mM/l)
1-5 20
Fig. 3. Steady-state [Na]i as a function of [Ca]o. Cells were equilibrated for 4 h in control medium with 30 mM Na» and the Ca<, indicated. Each point represents the mean of 8 determi-nations ±S.E.M.
- C N
30 r
1 2 3 4 S 6 Time (h)
557
5040
a, 30
c
20
10
10 12 14 Time (h)
[image:7.451.40.405.51.292.2]16 18 20 22 24
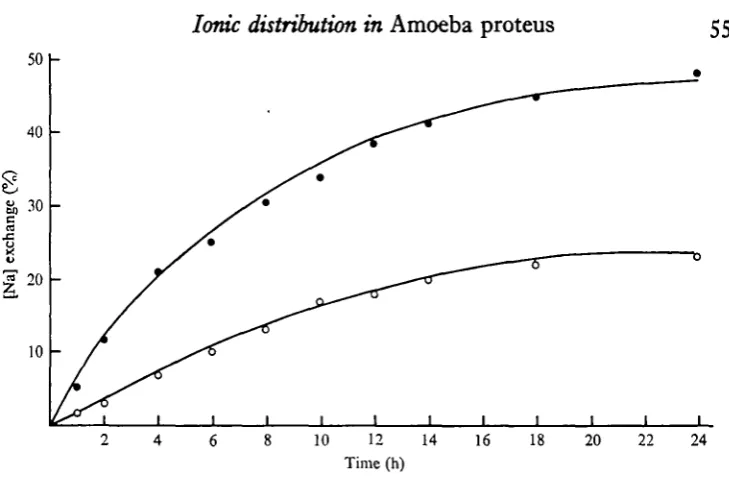
Fig. 5. Unidirectional Na influx in Amoeba prottus in steady state. laNa was added to the control medium at zero time. Closed points, exchange in control medium with 3 miu-Ca; open points, exchange in the control medium. Curves were calculated from the expression C, «= C«o(i —«"**)• Each point represents the meon of two determinations.
the medium and [Na], and [K], returned close to their previous levels. It should be noted that, as shown above, during a net Na influx when Ca,, is low, [K], decreases. When Ca,, is increased, a net Na influx is accompanied by an increase of [K],. Ouabain and DNP, both in concentrations up to io"1 M, had no observable effect on either [Na], or [K], under the conditions described above.
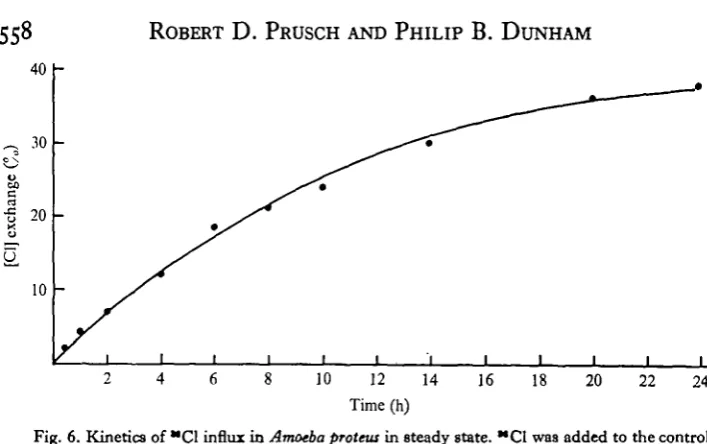
Unidirectional Na, K and Cl influxes
The unidirectional influx of Na was measured in steady state by the addition of 15 /iCi of ^Na to approximately 1 1 of control medium, or to 1 1 of control medium with 3 iriM-Ca, and taking cell samples at various times, as shown in Fig. 5. The maximum percentage exchange [CJ was approximated by finding the C^ which gave the best fit to the data. The curves in Fig. 5 were calculated using these values of C^ from the expression Ct = C^i — e~u). A good fit for Na exchange was obtained
using a Cm of 48-4 in the control medium and 24-3 in the high-Ca medium.
30
I
•5 20
u
10
2 4 6 8 10 12 14 16 18 20 22 24
Time (h)
[image:8.451.40.394.39.261.2]Fig. 6. Kinetics of "Cl influx in Amoeba protein in steady state. "Cl was added to the control medium at zero time. The curve was calculated from the expression, C< => C<o(i — e~*'). Each point represents the mean of two determinations.
Table 2. Unidirectional influxes and percentage exchange of K, Na and Cl in the control medium and in control medium with 3 mM Ca0
K Af, (mM/kg.h) % exchangeable
Control 1-55 76-5 Control + Ca I - I O 49-1 Na
Control 0-07 48-4 Control+ Ca C025 24-3 a
Control 0-43 45-4
Membrane potentials
The membrane potential (Em) of Amoebaproteus in the control medium is — 89-5 mV
(mean, 45 measurements). The membrane potential decreases when either Na or K is added to the control medium. Increasing [Na]0 to 20 mM causes an immediate decrease in the potential from 89-5 to 25 mV, followed by a further depolarization to 17 mV over the following 3 h period.
Addition of Ca to the control medium, to 3 mM, causes the membrane potential to depolarize from 89-5 to 20 mV. However, after cells have been equilibrated in a high-Na medium, the addition of Ca causes a hyperpolarization of Em. Fig. 7 shows the
membrane potential of cells equilibrated in 30 mM-[Na]0 with various Ca concen-trations. Under these conditions the membrane potential increases with increasing Ca concentration in the medium. The Ca concentration at half maximal effect is 0-2 mM.
Membrane resistance
559
22 r20
18
14
12
10
0-2 0-4 0-6 0-8 10
[Ca]o(mM)
[image:9.451.67.374.51.336.2]2 0
Fig. 7. Effect of [Ca]0 on the membrane potential of Amoeba proteus in 30 mM [Na]0. Cells were equilibrated for 3 h in the control medium with 30 mM-Nao and [Ca]0 from o to 3 mM. Each point represents the mean of 11 measurements ± s.E.
decreases the resistance to 1 x io7 Q. (Fig. 8). In the presence of both 3 mM-Ca and 5 mM-Na in the control medium the resistance of the plasmalemma was 3'3 x io7 Q.
DISCUSSION
The evidence indicates that both Na and K are actively transported in Amoeba proteus. Evidence for active K influx consists of the reversible decrease of [K]t caused
by CN and the fact that K, is not distributed according to its equilibrium potential. The K equilibrium potential in the control medium, as calculated from the Nernst equation, is —145 mV while the measured potential is about —90 mV. Glynn (1959) has pointed out that the discrepancy between the calculated and experimentally determined membrane potential may be due to either ion binding or active transport. Recalculation of the K equilibrium potential, assuming that 25% of K, is bound (Table 2), gives a value of —135 mV which is still considerably higher than the measured potential.
100
60
6 4
20
/ Control
5niM-NaCl
1 1
2 4 6 8 x l O - ' A
60
Hyperpolarizing JQO L
Fig. 8. Current-voltage relationships of the plaamalemma of Amoeba proteus. Abscissa, polariz-ing current in io~* A. Ordinate, membrane potential. Closed points, cells in control medium; open points, cells in high-Ca medium; crossed points, cells in control medium with 5 mM-NaCl. Points were taken from photographed oscilloscope tracings of continuous current—voltage plots as described in the Materials and Methods. Each point represents the mean of six determinations.
K influx is reduced only 30%, probably due for the most part to the depolarization of the membrane potential which was observed after the addition of Ca to the control medium. The greater reduction in Na influx caused by Ca when both [K]o and [Na]0 are constant indicates a decrease in PNa. The addition of Na to the high-Ca medium fails to decrease the membrane resistance while in low-Ca medium Na does decrease the membrane resistance. This is consistent with a reduction of PN& by Ca.
The membrane potential in high-Na medium is hyperpolarized by the addition of Ca. This can be interpreted to indicate a reduction in PNa by Ca, if the hyperpolarization
reflects an approach of the membrane potential toward the equilibrium potential for K. A hyperpolarization would be expected if PNa were decreased and Em approached the
K equilibrium potential. In addition, the effect of Ca on the membrane resistance would appear to be a specific effect on PNa. The reduction of P$a by Ca may be brought about
Paramecium caudatum has been shown by Naitoh & Yasumasu (1967). The effect of Ca by association with binding sites is consistent with the saturation effect of Ca on (Na), and Em, both of which incidentally showed a half-maximal effect at a (Ca)0 of O-I-O-2 mM.
While it is clear that there is an active Na efflux in the amoeba, which is particularly manifest when .PNa is reduced by Ca, there are obviously additional mechanisms involved in the Na regulation in these animals. In the control medium, as well as in medium with elevated [Na]0, [Na][ can exceed [Na]0 when [Ca]0 is low. It is possible that this relatively high [Na], under these conditions due to a high PNa and to the electrical potential difference across the membrane (inside negative in respect to the outside). However, active Na influx in addition to active Na efflux cannot be ruled out, as has been suggested in a ciliated protozoan (Kropp & Dunham, 1971). The active efflux of Na may be associated with the expulsion of Na by the contractile vacuole of Amoeba proteus. Riddick (1968) has shown that the contractile vacuole of Pelomyxa carolinensis (= Chaos chaos) eliminates Na and conserves K. The active transport of Na out of the amoeba may therefore be necessary for the osmotic regulation of this animal.
Bruce & Marshall (1965) state that there is no active transport of any ionic species directly across the plasmalemma of Chaos chaos. It was stated that Na and K are distributed according to a Donnan equilibrium and that the plasmalemma of C. chaos was impermeable to Cl. Chaos presumably obtains its Cl from its food. In Amoeba proteus Na and K are both actively transported and intracellular Cl exchanges with
36
C1 added to the medium. The differences in the ionic distribution between A. proteus and C. chaos may be due to basic differences between species, or the differences may only be apparent due to differences in experimental techniques used to evaluate the ionic distribution in the two animals. For example, Bruce and Marshall failed to follow net fluxes or determine permeability by the use of isotopes.
In Amoeba proteus, equilibrated in the control medium, considerable fractions of Naj, K, and Cl, are unexchangeable with their isotopes in the external medium. These unexchangeable compartments may represent ion binding or restriction to various impermeable intracellular structures. However, bound substances could conceivably exchange. An additional compartment of Na, is indicated by the two kinetic com-ponents observed during a net N influx. In Tetrahymena pyriformis ionic regulation may be accomplished in part by the compartmentalization of Na, and K, (Dunham & Child, 1961). According to Klein (1961) one of the mechanisms for regulating internal cation levels in Acanthamoeba is a shift between bound and free ions in response to external osmotic conditions. This has also been shown for amino acids in Miamiensis avidus, a marine ciliate (Kaneshiro, Holz & Dunham, 1969), and in Tetrahymena (Stoner & Dunham, 1970). It should be pointed out that the addition of Ca to the control medium reduces both the exchangeable compartments for both Na and K in the amoeba. It is not known how this is brought about.
\K\, or [Na]0 and the [Ca]0 at which the potentials were recorded Paramecium Opalina Chaos chaos Amoeba proteus K (mV) 26 2 9 7 40 44 2 0 40 57 Na (mV) 26 0 0 0 — 35 57 [Ca]. (mil) o-o o-6
0 8 5
o-s 0-07 o-o o-o Reference Yamaguchi (i960) Ueda (1961)
Bruce & Marshall (1965) Riddle (1962)
Bingley (1962)
Josefeson (1966)
Batueva & Lev (1967)
Changes in the membrane potential are more variable for a tenfold change in Na0. Included in Table 3 are the concentrations of Ca present when the membrane potential, as a function of Na,,, was recorded. In the presence of relatively high Ca (> 0-05 mM) the membrane potential is insensitive to changes in Na,,. At lower concentrations of Ca (< 0-05 mM) the membrane potential is sensitive to changes in Na0. This provides additional evidence that Ca reduces the Na permeability of the plasmalemma.
Brandt & Freeman (1967) were able to correlate changes in the structure of the plasmalemma of Chaos chaos with resistance decreases and pinocytosis by the addition of Na to the external medium. Ca blocked the permeability change and the pinocytosis generally caused by increased (Na)0. Josefsson (1968) also demonstrated that the amount of Na required to ehcit pinocytosis in Amoeba proteus was increased as the Ca concentration of the medium was increased. These findings are consistent with reduction of the permeability of the plasmalemma to Na caused by Ca. This correlation suggests that a specific increase in Na permeability may be associated with pinocytosis.
SUMMARY
1. The intracellular concentrations of K, Na, Ca and Cl in Amoeba proteus are 24-83, 1-08, 2-93 and 9-73 mM/kg cells respectively.
2. Intracellular Na is always slightly higher than that of the external medium when external Ca is low.
3. Addition of Ca to the medium reduces the intracellular concentration of Na by decreasing the permeability of the plasmalemma to Na.
4. The membrane potential of Amoeba proteus in Prescott-James medium is -89-5 mV and is sensitive to changes in both external K and external Na when external Ca is low.
5. Intracellular Na and K are both sensitive to the addition of CN to the external medium.
6. Both Na and K are actively transported in the amoeba; K is actively accumulated from the external medium and Na is actively expelled from the cell.
7. It has been suggested that the effects of Ca on Amoeba proteus, i.e. reduction of i^ja, reduced internal concentration of Na, reduced unidirectional Na and K influxes,
REFERENCES
BATUEVA, I. V. & LBV, E. (1967). Electrochemical properties of the plasmalemma of Amoeba proteus. I. The dependence of membrane potential on concentration of potassium and sodium in chloride and sulphate solutions. Ttitologiya 9, 680-91.
BINGLBY, M. S. & THOMPSON, C. M. (1962). Bioelectric potentials in relation to movement in amoebae.
Jf. theoret. Biol. a, 16-32.
BRANDT, P. W. & FREEMAN, A. R. (1967). Plasma membrane: sub-structural changes correlated with electrical resistance and pinocytoais. Science, N.Y. 155, 582-3.
BRUCE, D. L. & MARSHALL, J. M. (1965). Some ionic and bioelectric properties of the amoeba Chaos
chaos, jf. gen. Physiol. 49, 151-78.
CHAPMAN-ANDRESEN, C. & DICK, D. A. T. (1962). Sodium and bromine fluxes in the amoeba Chaos
chaos. C. r. Trav. Lab. Carlsberg 3a, 445-60.
DUNHAM, P. B. & CHILD, F. M. (1961). Ion regulation in Tetrahymena. Biol. Bull. mar. biol. Lab.,
Woods Hole iai, 129-40.
GLYNN, I. M. (1959). Sodium and potassium movements in nerve, muscle and red cells. Int. Rev.
Cytol. 8, 449-80.
JOSHFSSON, J. O. (1966). Some bioelectric properties of Amoeba proteus. Acta physiol. Scand. 66, 395-405. JOSBFSSON, J. O. (1968). Induction and inhibition of pinocytosis in Amoeba proteus. Acta physiol. Scand.
73. 481-90.
KANBBHIRO, E. S., HOLZ, G. G. & DUNHAM, P. B. (1969). Osmoregulation in a marine ciliate, Miamiensis avidus. II. Regulation of intracellular free amino acids. Biol. Bull. mar. biol. Lab., Woods Hole 137,
161-9.
KLEIN, R. L. (1959). Transmembrane flux of " K in Acanthamoeba sp. y. Cell. Comp. Physiol. 53, 241-58.
KLEIN, R. L. (1961). Homeostatic mechanisms for cation regulation in Acanthamoeba sp. Expl Cell Res. as.
571-84-KLEIN, R. L. (1964). Effects of active transport inhibitors on K movements in Acanthamoeba sp. Expl
Cell Res. 34, 231-8.
KROPP, D. L. & DUNHAM, P. B. (1971). The mechanism of sodium influx in Tetrahymena. y. Protozool.
18 (suppl.). (In the Press.)
MORRILL, G. A. & ROBBINS, E. (1967). The role of calcium in the regulation of the steady-state levels of sodium and potassium in the HeLa cell. y. gen. Physiol. 50, 781-92.
NAITOH, Y. & YASUMASU, I. (1967). Binding of Ca ions by Paramecium caudatum. y. gen. Physiol. 50
1303-10.
PRESCOTT, D. M. & JAMBS, T. W. (1955). Culturingof Amoeba proteus on Tetrahymena. Expl Cell Res. 8,
256-8-RIDDICK, D. H. (1968). Contractile vacuole in the amoeba Pelomyxd carolinensis. Am.y. Physiol. ai5, 736-40.
RIDDLE, J. (1962). Studies on the membrane potential of Pelomyxa carolinensis. Expl Cell Res. a6,158-67. SHEPPARD, C. W. & MARTIN, W. R. (1950). Cation exchange between cells and plasma of mammalian
blood. I. Methods and application to potassium exchange in human blood. J'. gen. Physiol. 33, 703-22. STONER, L. C. & DUNHAM, P. B. (1970). Regulation of cellular osmolarity and volume in Tetrahymena.
y. exp. Biol. S3, 391-400.
UEDA, K. (1961). Electrical properties of Opalina. I. Factors affecting the membrane potential. Annot.
Zool.yap. 34, 99-110.
YAMAOUCHI, T. (i960). Studies on the modes of ionic behavior across the ectoplasmic membrane of
 Kinetics of change in (Na)i when the NaCl concentration of the control medium is0 increased to 5 nm at 3 h](https://thumb-us.123doks.com/thumbv2/123dok_us/1202824.643751/5.451.95.336.45.312/increased-closed-kinetics-change-concentration-control-medium-increased.webp)
![Fig. 7. Effect of [Ca]point represents the mean of0 on the membrane potential of Amoeba proteus in 30 mM [Na]0](https://thumb-us.123doks.com/thumbv2/123dok_us/1202824.643751/9.451.67.374.51.336/fig-effect-point-represents-membrane-potential-amoeba-proteus.webp)
