Contents lists available atScienceDirect
Journal of Magnetism and Magnetic Materials
journal homepage:www.elsevier.com/locate/jmmm
Controlling DC permeability in cast steels
Aaran Sumner
a, Chris Gerada
b, Neil Brown
c, Adam Clare
d,⁎aUniversity of Nottingham, Nottingham University Park Campus, Nottingham NG7 2RD, England, United Kingdom bElectrical Machines, University of Nottingham, Tower Building, Nottingham NG7 2RD, England, United Kingdom
cAdvanced Electrical Machines Research and Technology at Cummins Power Generation, Peterborough PE2 6FZ, England, United Kingdom dAdvanced Manufacturing, University of Nottingham, University Park Campus, Nottingham NG7 2RD, England, United Kingdom
A R T I C L E I N F O
Keywords: Cast steel Microstructure Optical microscopy Permeability Electrical machines Manufacture
A B S T R A C T
Annealing (at multiple cooling rates) and quenching (with tempering) was performed on specimens of cast steel of varying composition. The aim was to devise a method for selecting the steel with the highest permeability, from any given range of steels, and then increasing the permeability by heat treatment. Metallographic samples were imaged using optical microscopy to show the effect of the applied heat treatments on the microstructure. Commonly cast steels can have DC permeability altered by the careful selection of a heat treatment. Increases of up to 381% were achieved by annealing using a cooling rate of 6.0 °C/min. Annealing was found to cause the carbon present in the steel to migrate from grain boundaries and from within ferrite crystals into adjacent pearlite crystals. The migration of the carbon resulted in less carbon at grain boundaries and within ferrite crystals reducing the number of pinning sites between magnetic domains. This gives rise to a higher permeability. Quenching then tempering was found to cause the formation of small ferrite crystals with the carbon content of the steel predominately held in the martensitic crystal structures. The results show that with any given range of steel compositions the highest baseline DC permeability will be found with the steel that has the highest iron content and the lowest carbon content. For the samples tested in this paper a cooling rate of 4.5 °C/min resulted in the relative permeability of the sample with the highest baseline permeability, AS4, increasing from 783 to 1479 at 0.5 T. This paper shows how heat treatments commonly applied to hypoeutectoid cast steels, to improve their mechanical performance, can be used to also enhance electro-magnetic properties of these alloys. The use of cast steels allows the creation of DC components for electrical machines not possible by the widely used method of stacking of electrical grade sheet steels.
1. Introduction
The use of cast steel components in the production of rotating electrical machines (REMs) is limited to machines that use direct current (DC) driven electromagneticfields or permanent magnets as part of their magnetic structure.
The rotating element (rotor) of electrical machines typically sees DC fields for synchronous machines or relatively low frequencyfields in case of asynchronous machines. The aim of this study is investigate the potential of using cast steel for rotors of synchronous (PM orfi eld-wound) machines.
The primary reason for not using solid elements for the stationary side of an electrical machine is the large circulating eddy currents[1] that would form in the low resistivity steel when alternating current (AC) driven electromagneticfields are applied. This results in adverse heating which serves to reduce overall machine efficiency. Hence
electrical machines typically use laminated electrical steel to mitigate circulating eddy currents.
Currently the main methodology to reduce eddy current losses in steel components is to increase the resistivity of the steel by alloying it with 1–6% silicon (Si), however the use of Si in cast steel results in a material with lower machinability [2] and hence cost of machine manufacture will be higher. To produce REMs with high silicon content steel, their production uses stamped laminates of silicon steel with an inter-layer coating which provides electrical insulation. These are stamped for high volume production but are laser or water-jet cut in smaller volumes[3]. The use of these coated silicon steels limits the size of circulating eddy currents whilst maximizing the iron (Fe) content of thefinished part.
As understanding of the effects of impurities and domain micro-structure on magnetic performance has developed, new production processes have been developed that produce steels with a
microstruc-http://dx.doi.org/10.1016/j.jmmm.2016.12.137
Received 28 July 2016; Received in revised form 21 November 2016; Accepted 29 December 2016 ⁎Corresponding author.
E-mail addresses:[email protected](A. Sumner),[email protected](C. Gerada),[email protected](N. Brown), [email protected](A. Clare).
Available online 05 January 2017
0304-8853/ © 2017 The Authors. Published by Elsevier B.V.
This is an open access article under the CC BY license (http://creativecommons.org/licenses/BY/4.0/).
ture tailored to the role the REM is designed to carry out[4–7]. These new production processes enable REMs to operate with greater efficiency meeting new European and global efficiency standards[8].
The production of electrical grade sheet steels use continuous casting methods with particular focus being given to cooling rates and annealing atmosphere content [9–13]. To produce high quality electrical steels the atmospheric composition, pressure, and tempera-ture of the production processes needs to be precisely controlled. The level of precision required is an order of magnitude above the precision required for the production of non-electrical grade steels and results in a significant increase in production costs.
Permeability, resistivity, magnetostriction, coercivity, remanence, saturation magnetization, and anisotropy are all considered when selecting a material for electromagnetic applications. Saturation mag-netization and resistivity depend on material composition and operat-ing temperature.
The remaining characteristics are dependent on composition, temperature, grain size, and strain [14]. This paper focuses on the manipulation of DC permeability by the use of heat treatments as it is the most important variable, in non-AC applications, to improve machine performance.
Carbon content has a direct effect on the steel’s magnetic proper-ties. The carbon content of all the steels tested for this paper was below 0.4% and therefore considered to be hypoeutectic.
This paper builds upon prior work in thisfield to show how, given a range of cast steels, the steel best suited to DC magnetic applications can be selected. It goes on to show how the performance of the steel can be enhanced with the application of heat treatments.
2. Experimental
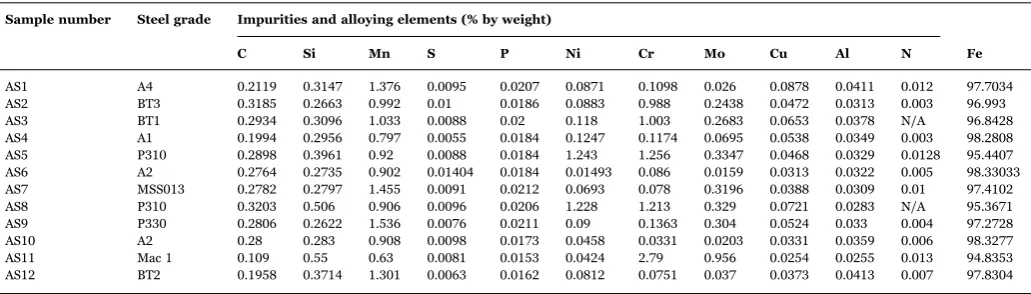
Twelve samples of commonly cast steels, to BS3100:1991[14], in the form of billets were produced. The composition of each billet is shown inTable 1. Three 10 mm thick specimens were extracted from these for additional heat treatment and permeability measurements.
2.1. Permeability samples
To evaluate the permeability of the cast steels; a toroid (28 mm outer diameter x 20 mm inner diameter) was machined from each of the three 10 mm thick billet slices. To provide a baseline permeability for all the samples and remove any effects of prior heat treatments and machining[15], the samples were placed into a furnace at 950 °C for 20 min for normalization. The samples were removed from the furnace and allowed to cool in air. The samples then had 30 turns of 0.1 mm2 wire wrapped around the circumference of the toroid, this formed the sensor coil. Another 30 turns of 1.0 mm2wire were wrapped on top of the sensor wire; this provided the source for the applied
electromag-neticfield.
The coils were then connected to a test apparatus and a DC current was applied to the source coil. The effect of the applied magneticfield was detected by the sensor coil and the baseline permeability of the cast steel samples was calculated[15].
2.2. Baseline permeability testing
Each of the three normalized toroids for each billet were tested three times non-sequentially. The three sets of results for each toroid were then averaged to give the permeability for each material. The average permeability for the three toroids from each billet was then averaged to produce an overall permeability for each of the cast steel billets. The uncertainty for the data was taken to be the range of the total of the nine data sets (for each billet).
Once the initial testing was completed, sample 1 from each billet was removed to be used as a control. The control sample remained in the normalized state until all the required heat treatments had been carried out on the two remaining samples. After all the required heat treatments had been carried out the heat treated samples were normalized in order to assess the effect of multiple heat treatments on baseline permeability.
2.3. Applying heat treatments
To carry out annealing and quenching heat treatments, samples 2 and 3 from each billet were heated above their upper critical temperature (Ac3), the point at which all ferrite has undergone a complete eutectoid transformation to austenite. The Ac3 temperature varies depending on carbon content and the quantities of impurities and alloying elements present, but can be taken as 900 °C for steels with < 0.1% carbon decreasing to less than 800 °C for steels with < 0.4% carbon. All the samples in this paper were between 0.1–0.4% carbon content therefore the use of 950 °C as the heating temperature for the annealing and quenching process was deemed to be suitable.
2.3.1. Annealing
Sample 2 from each billet was annealed by placing in a furnace at 950 °C for 20 min. When the heating cycle was completed the furnace was switched offand the cooling rate of the furnace was recorded using a thermocouple attached to a data logger. These samples had been annealed using the cooling rate of the furnace; providing the fastest annealing cooling rate of 6.33 °C/min. Upon reaching room tempera-ture the samples had their permeability tested, and the results plotted compared with normalized state testing.
[image:2.595.41.557.598.745.2]Once tested the samples were returned to the furnace at 950 °C for 20 min to return the microstructure to a pure austenitic state. The annealing process was then carried out at cooling rates of 3 °C/min,
Table 1
The composition of the 12 billets. There are two grades of steel, A2 and P310, which have duplicates but were produced in different foundries.
Sample number Steel grade Impurities and alloying elements (% by weight)
C Si Mn S P Ni Cr Mo Cu Al N Fe
AS1 A4 0.2119 0.3147 1.376 0.0095 0.0207 0.0871 0.1098 0.026 0.0878 0.0411 0.012 97.7034
AS2 BT3 0.3185 0.2663 0.992 0.01 0.0186 0.0883 0.988 0.2438 0.0472 0.0313 0.003 96.993
AS3 BT1 0.2934 0.3096 1.033 0.0088 0.02 0.118 1.003 0.2683 0.0653 0.0378 N/A 96.8428
AS4 A1 0.1994 0.2956 0.797 0.0055 0.0184 0.1247 0.1174 0.0695 0.0538 0.0349 0.003 98.2808
AS5 P310 0.2898 0.3961 0.92 0.0088 0.0184 1.243 1.256 0.3347 0.0468 0.0329 0.0128 95.4407
AS6 A2 0.2764 0.2735 0.902 0.01404 0.0184 0.01493 0.086 0.0159 0.0313 0.0322 0.005 98.33033
AS7 MSS013 0.2782 0.2797 1.455 0.0091 0.0212 0.0693 0.078 0.3196 0.0388 0.0309 0.01 97.4102
AS8 P310 0.3203 0.506 0.906 0.0096 0.0206 1.228 1.213 0.329 0.0721 0.0283 N/A 95.3671
AS9 P330 0.2806 0.2622 1.536 0.0076 0.0211 0.09 0.1363 0.304 0.0524 0.033 0.004 97.2728
AS10 A2 0.28 0.283 0.908 0.0098 0.0173 0.0458 0.0331 0.0203 0.0331 0.0359 0.006 98.3277
AS11 Mac 1 0.109 0.55 0.63 0.0081 0.0153 0.0424 2.79 0.956 0.0254 0.0255 0.013 94.8353
4.5 °C/min, and 6.0 °C/min and the permeability tested after each applied heat treatment.
2.3.2. Quenching and tempering
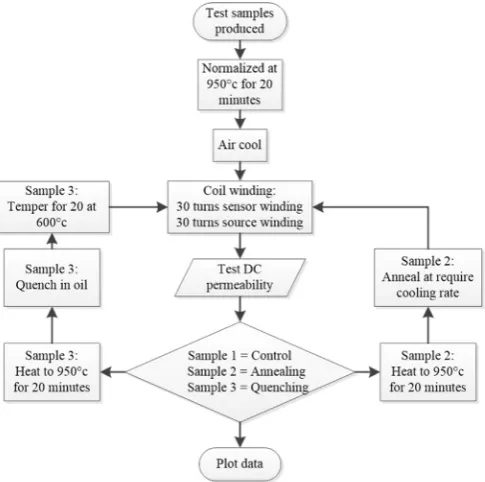
Sample 3 from each billet was placed into the furnace and heated to 950 °C for 20 min. These were immediately removed from the furnace and quenched in oil at room temperature (approx. 21 °C). The furnace was cooled to 600 °C and the samples returned to the furnace for 20 min to temper the steel. After tempering the samples were removed from the furnace and cooled in open air. These samples were also subject to permeability testing and the results were plotted against the results from before they were quenched.Fig. 1is a schematic diagram of the complete testing procedure.
2.4. Optical microscopy
Optical imaging of the specimen microstructures was required in order to identify microstructure changes before and after the applica-tion of heat treatments. Cylinders 10 mm in diameter were machined from the remainder of the billet slices. These cylinders were normalized alongside the toroidal samples. After normalization sample 1 from each billet was set aside as a control, so an image of the crystal structure after normalization could be obtained.
The remaining two samples were given heat treatments at the same time as the toroids, and were used to compare the effects of heat treatments on crystal structure with that of the set aside normalized cylinder. Sample 2 from each billet was annealed at the cooling rate of the furnace (6.33 °C/min) and sample 3 was quenched at the same
time as the toroidal samples.
2.4.1. Grain sizing
In electrical steels the sizing of grains using software, such as the open source software ImageJ, is common practice and has good accuracy and reproducibility. The software works by converting an image into an 8-bit greyscale image, and then using a range of pre-developed algorithms turning the 8-bit image into a black and white image. This process works very well on steels that have very low carbon content (below 0.02 %wt) as the etchant used to image the crystal structure can be tailored to attack the carbon at the grain boundaries [16]. This method clearly shows the individual ferrite crystals. In higher carbon content steels (above 0.02 %wt) the crystal structure is a mixture of ferrite and pearlite. Pearlite is made of 88 %wt ferrite and 12 %wt cementite, cementite is made from 6.67% carbon and 93.3 %wt iron. Pearlite is formed of layers of ferrite separated by layers of cementite.
When a steel which contains pearlite is etched with the same etchant used for electrical steels the cementite is dissolved out of the pearlite resulting in the crystal structure becoming a mixture of the original large ferrite grains and smaller ferrite grains that had previously formed 88%wt of the pearlite. Imaging software cannot separate the two sources of ferrite so takes an average of the crystal sizes, resulting in an average ferrite grain size which is not accurate. By manually altering the images it is possible to exclude the smaller ferrite grains but the alteration also greatly increases the apparent size of the grain boundaries resulting in poor accuracy of the grain size measure-ment. The authors of this paper explored other techniques to image the samples, such as using a scanning electron microscope (SEM).
[image:3.595.43.286.56.297.2]Fig. 2a) shows the best optical image of all the samples under test. The grain boundaries are clearly visible, this image is the best image obtained for any of the steels under test so was selected to test the accuracy of ImageJ software (Table 2). The SEM imageFig. 2b) shows the structure of the same sample shown inFig. 2a). Theflat grey areas are ferrite whilst the areas with differing shades of grey are the laminar pearlite, no boundaries between ferrite crystals are visible.
Table 2shows that whilst the areas of the crystal structure covered by pearlite and ferrite changes, which is to be expected, the crystal sizes alters dramatically depending upon the magnification of the image. The scale settings in the software were recalibrated for each magnification, so the error is not in the scaling. The use of optical imaging and software is not therefore an accurate or reproducible method to size the grains of ferrite in a mixed ferrite and pearlite steel.
[image:3.595.307.557.83.141.2]Fig. 3a) is an SEM image of an individual pearlite crystal, as well as the laminar structure of cementite and ferrite layers large ferrite crystal Fig. 1.A summary of the permeability testing process used in this study.
Fig. 2.a) Optical image of pearlite at 50x magnification b) SEM image at 50x magnification. Table 2
Computed crystal sizes from the same crystal structure under different magnifications.
Magnification Area of pearlite (%)
Area of ferrite (%)
Crystal size (microns)
x20 57 43 234
x50 51 49 37
[image:3.595.119.477.637.732.2]inclusions can also be seen in the pearlite grain.Fig. 3b) shows the laminar structure of the cementite and ferrite. If the cementite is removed during etching the ferrite inclusions and ferrite laminations are left behind and make determining an average crystal size
sub-jective.
Neither optical nor SEM imaging is suitable for the grain size measurement of a pearlite/ferrite steel. Due to the number of samples for testing and the limitations of other methods of grain sizing this paper will infer grain size alteration through comparison of DC permeability with optical images but will not give absolute crystal sizes. For the optical images in this paper the samples were prepared using standard polishing procedures, laid out in the ASTM standard E117[17], and etched using 2% Nital (4 ml Nitric acid, 96 ml ethanol), this etchant was chosen because it gives a good contrast between the principle crystal component for the samples, a mix of ferrite, pearlite and martensite[18].
3. Results and discussion
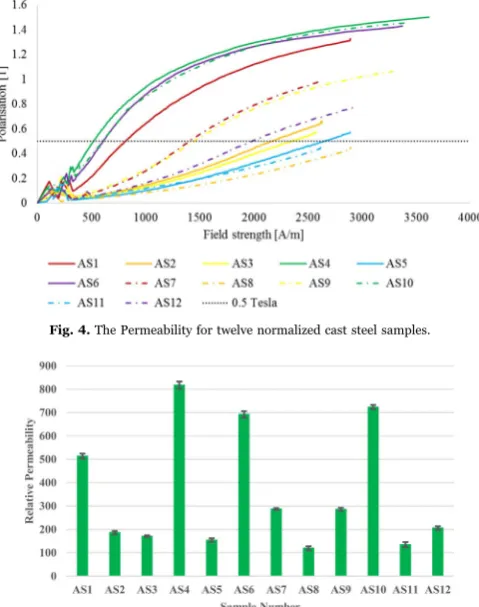
Fig. 4shows the B-H curve of the absolute permeability for each of the as cast steel samples. The variation between the samples is due to carbon content and the use of alloying elements to control crystal structure during normalization. The amounts of additives and impu-rities has considerable variation in the test samples as each of the steel grades are formulated to produce a given mechanical performance for its intended application.
In order to be able to draw accurate analysis of the performance of heat treatments it is necessary to select a value offield strength or polarization and use that value as a comparison point across all the results. For this study the permeability will be quoted at 0.5 Tesla.
InFig. 4the absolute permeability for all the tested cast steel grades is shown along with a dotted black line to indicate the point at which the relative permeability (µr) for the samples will be calculated. Samples AS8 and AS11 do not cross the 0.5 tesla line so their permeability will be calculated from the highest polarization they achieved, in their normalized state which is 0.4493 T and 0.4428 T respectively.
3.1. Comparisons at 0.5 T
[image:4.595.114.480.56.149.2] [image:4.595.43.283.176.480.2]Fig. 5 shows the differences between the 12 sample’s baseline Fig. 3.SEM images of a individual pearlite grain a) an individual pearlite grain has large ferrite crystal inclusions b) ferrite is also present between layers of cementite.
Fig. 4.The Permeability for twelve normalized cast steel samples.
[image:4.595.39.558.597.734.2]Fig. 5.Permeability of normalized cast steels, at 0.5 T allowing for a direct comparison of alloys.
Table 3
Permeability of normalized (Norm) verses annealed cast steel (with different cooling rates) tested at 0.5 T.
Sample number
Normalized 3.0 °c/min % diff 3.0 °c/min*
4.5 °c/min % diff 4.5 °c/min*
6.0 °c/min % diff 6.0 °c/min*
6.3 °c/min % diff 6.3 °c/min*
Heat treatment with greatest effect
AS1 495 324 −35% 763 54% 735 48% 723 46% 4.5 °c/min
AS2 184 161 −12% 376 104% 370 101% 366 99% 4.5 °c/min
AS3 169 152 −10% 376 122% 363 115% 372 120% 4.5 °c/min
AS4 776 541 −30% 1479 90% 1240 60% 1258 62% 4.5 °c/min
AS5 151 68 −55% 206 36% 192 27% 175 16% 4.5 °c/min
AS6 666 394 −41% 986 48% 870 31% 913 37% 4.5 °c/min
AS7 284 160 −44% 471 66% 182 −36% 411 44% 4.5 °c/min
AS8 121 65 −46% 181 50% 203 68% 155 28% 6.0 °c/min
AS9 279 162 −42% 417 49% 419 50% 397 42% 6.0 °c/min
AS10 688 419 −39% 968 41% 973 42% 961 40% 6.0 °c/min
AS11 135 231 71% 596 343% 609 352% 394 192% 6.0 °c/min
AS12 208 212 2% 508 144% 443 113% 438 110% 4.5 °c/min
permeability, at 0.5 T, along with error bars showing the uncertainty of the measurements. At this stage all the samples had been normalized, but no other heat treatments had been applied.
Table 3shows the four different annealing cooling rates and their effects on permeability. The 3.0 °C/min cooling rate does not produce the best permeability for any of the steels under test. The 4.5 °C/min cooling rate produces the best permeability for eight of the steel samples (AS1, AS2, AS3, AS4, AS5, AS6, AS7, and AS12). The 6.0 °C/min cooling rate produces the best permeability for the re-mainder of the steel samples (AS8, AS9, AS10, and AS11).
Table 3shows the results for quenched and tempered samples with the percentage change when compared to the normalized relative permeability. Tempering has an effect on permeability but without tempering, after quenching, the cast component is too brittle for any further manufacturing processes to be carried out on it. Out of the 12
samples only seven showed an improvement with the heat treatment applied (AS1, AS2, AS3, AS5, AS8, AS11, and AS12). The permeability of the five remaining samples (AS4, AS6, AS7, AS9, and AS10) was reduced.
3.2. Optical imaging
A selection of micrographs are presented here which show the crystal structures of samples that had the largest increase in perme-ability due to the applied heat treatments.
Thefirst sample, AS4, has the highest permeability in the normal-ized state; the second, AS11, has the greatest increase after annealing; and the third sample, AS8, has the greatest improvement in perme-ability after quenching then tempering.
[image:5.595.52.266.51.531.2]Sample AS4 has the highest permeability, in its normalized state, of Fig. 6.A comparison of crystal structures and their effect on permeability a) graph of
permeability of sample AS4 in three heat treated states; b) normalized, c) annealed, and d) quenched then tempered.
[image:5.595.327.532.58.538.2]any of the steel samples tested. In Fig. 6a) the permeability of the sample is shown in three states: normalized, annealed, and quenched. Fig. 6a) shows that the permeability of the quenched sample is much lower than that of the normalized sample, and that the annealed sample has a much greater permeability than either the normalized or quenched samples. The crystal shown inFig. 6b) is visibility smaller than the annealed sample shown inFig. 6c) The annealed pearlite is darker than the normalized sample, which indicates that the laminar structure of the pearlite has changed from a coarse pearlite (Fig. 6b) to afine pearlite (Fig. 6c), which appears darker. Pearlite develops when the austenitic structure of a steel heated above its eutectoid tempera-ture undergoes a eutectoid transformation during cooling. If a steel is cooled in air a coarse pearlite is formed. If the steel is cooled gradually, as happens during annealing, afine pearlite is formed. Both forms of pearlite contain the same quantity of carbon in the form of cementite (Fe3C).
The ferrite crystals shown inFig. 6b) have small pearlite inclusions whereas the ferrite shown inFig. 6c lack any pearlite inclusions. This indicates that the slow cooling during annealing has allowed the carbon contained in the ferrite crystals to migrate out of the ferrite crystal structure. The carbon migrating out of the ferrite joins with the existing pearlite crystals enlarging them, as can be seen in Fig. 6c. The migration of the pearlite from the ferrite results in an increase in permeability as the inclusions cause pinning sites within the ferrite crystals [19]. The quenched sample (Fig. 6d) has a very fine lathe martensitic structure. Martensite is a ferromagnetic phase in steel but has a lower permeability than ferrite due to the number of dislocations cause by the inability of the carbon to migrate out of the crystal structure during the rapid cooling. The tempering of the martensite allows some carbon migration, reducing the number of dislocations in the crystal structure, causing a slight increase in permeability in tempered martensite.
Sample AS11 has the second to lowest normalized permeability (Table 3) but has the best increase in performance once a heat treatment has been applied. InFig. 7a) the large increase in perme-ability is clear when the annealed sample is compared with the normalized or quenched samples. In the normalized sample (Fig. 7b) the crystal structure is coarse pearlite with occasional large ferrite crystals. The large amount of small pearlite and ferrite crystals increases the number of grain boundaries reducing the sample's permeability. The crystal structure of the annealed sample (Fig. 7c) has much larger crystals of both ferrite andfine pearlite. The larger crystal size reduces the number of crystal boundaries, increasing the permeability of the sample. The annealed sample (Fig. 7b) has ferrite crystals that have no pearlite inclusions reducing the number of pinning sites in the ferrite crystal. The quenched sample (Fig. 7c) has a coarse lathe martensitic structure with occasional large ferrite crystals. When compared with the normalized sample (Fig. 7b) the overall volume of ferrite has been increased. This increase in ferrite results in a slight improvement in permeability when compared with the normalized sample.
Sample AS8 has the lowest permeability in the normalized state (Table 3) of all the steel samples tested.Fig. 8a) shows a comparison of permeability affected by the applied heat treatments. It shows that the largest improvement in performance is the result of the quenching and tempering heat treatment. The improvement in performance is modest with an increase from 137 to 325 at 0.5 T (Table 4).
Fig. 8b) shows AS8 in its normalized state showing a mixture of pearlite and ferrite with very small grain size resulting in low permeability due to the large number of grain boundaries.
The ferrite also contains significant amounts of pearlite inclusions increasing pinning sites, reducing the permeability of the sample. After annealing the ferrite crystals are larger (Fig. 8c) this results in an improved permeability due to a reduction in grain boundaries. The larger ferrite crystals also contain fewer pearlite inclusions, reducing pinning sites. The crystal structure ofFig. 8d) is similar to that ofFig. 8b) but it Fig. 8.A comparison of crystal structures and their effect on permeability a) graph of
permeability of sample AS8 in three heat treated states, b) normalized, c) annealed, and d) quenched then tempered.
Table 4
Permeability of normalized (Norm) verses quenched (then tempered) cast steel tested at 0.5 T.
Sample number µr Quenched % diff*
AS1 494 526 6%
AS2 181 401 121%
AS3 171 401 134%
AS4 794 425 −46%
AS5 151 348 130%
AS6 643 510 −21%
AS7 290 255 −12%
AS8 127 325 155%
AS9 285 279 −2%
AS10 653 518 −21%
AS11 133 188 41%
AS12 207 407 96%
contains larger ferrite crystals, with less inclusions, resulting in a larger permeability. The pearlite ofFig. 8b) is replaced with martensite (Fig. 8d) which holds the carbon in solution within the martensite crystal structure stopping it from migrating out of the martensite and into the grain boundaries, further improving permeability.
4. Conclusions
The rate at which steel is cooled below the Ac1 temperature, the point at which austenite transforms to ferrite and pearlite, determines how the carbon is accommodated in the microstructure, and the crystal grain size. The finer (darker) pearlite contains the same amount of carbon as coarse pearlite. The presence offine pearlite is an indication of gradual cooling which allows more time for carbon, held within ferrite crystals as pearlitic inclusions, to migrate out of the ferrite and join with adjacent pearlite crystals. Pearlite formation is the primary mechanism for reducing the amount of carbon present at grain boundaries and within ferrite crystals, which reduces pinning sites therefore increases permeability[18].
The cooling rate also determines crystal size, the larger the individual crystals in the steel the fewer crystals present in a given volume. The larger crystals result in fewer grain boundaries meaning an increase in permeability[19].
In their normalized state the steels tested have a large variation in the permeability, this is due to the additional alloying elements that are added to form a certain crystal structures as the steel cools. These alloying elements reduce the amount of iron in the steel which reduces the saturation magnetization of thefinished components.
This paper shows that by controlling the cooling rates both the crystal size, hence number of grain boundaries, and the amount of carbon at the grain boundaries themselves can be reduced. By selecting the heat treatment based on the composition of the steels alloying elements the permeability can be increased by up to 381%. Two sets of samples (AS5, AS8 and AS6, AS10) were produced to the same standard, BS3100:1991 [14], but at different foundries. They showed a similar performance in both their baseline permeability and their response to heat treatments. The steel with the highest permeability in its normalized state was found to be sample AS4 (A1 grade) with a baseline permeability, at 0.5 T, of 750 with annealing at a cooling rate of 4.5 °C/min the permeability of AS4 can be raised to around 1479 an increase of 89%.
If presented with a selection of steel compositions, the steel with the highest iron content and lowest carbon content will have the highest baseline performance. The increase in iron content alone does not result in the higher permeability, it is the reduction of alloying elements that causes the increased baseline permeability. It is also possible to increase the permeability of the steel significantly with an annealing heat treatment, the cooling rate required to produce the highest increase in DC permeability is difficult to predict due to the number of additives and impurities in steel produced for structural applications.
Acknowledgements
A. B. Sumner would like to thank Dr. J. M, Bearcock for the review of early revisions of this paper. The authors of this paper would like to thank H.I. Quality Castings Ltd for the supply of cast steel billets. We
would also like to thank Tom Buss and Max Mason at the University of Nottingham’s Department of Mechanical, Materials, and Manufacturing Engineering department for the use of their laboratories to optically image the samples. The authors would also like to thank the Cummins Innovation Centre, also based at the University of Nottingham, for the use of their equipment to test the permeability of the samples. This work was supported by the Engineering and Physical Sciences Research Council [grant number EP/I017933/1], by a studentship to Adam Clare which was sponsored by Cummins Generator Technologies.
References
[1] B.C. Mecrow, A.G. Jack, The modelling of segmented laminations in three dimensional eddy current calculations, IEEE Trans. Magn. 28 (1992) 1122–1125. [2] H.J.A. García, M.H. Cruz, A.A. Balandra, F.G. González, Y. Houbaert, Effect of
silicon on the cast macrostructure of Fe-Si alloys, Mater. Res. Soc. Symp. Proc. 1372 (2012) 167–172.
[3] G. Madescu, I. Boldea, T.J.E. Miller, The optimal lamination approach to induction machine design global optimization, IEEE Trans. Ind. Appl. 34 (1998) 422–428. [4] M. Popescu, T. Jokinen, E. Demeter, V. Navrapescu, Magnetic materials in design and construction of electrical motors, in: Proceedings of the 9th Mediterranean Electrotechnical Conference, MELECON’98. (Cat. No. 98CH36056), vol. 1, pp. 125–128, 1998.
[5] V.L. Zakarian, M.J. Kaiser, Computer-aided design of synchronous generators with comb rotors, Appl. Math. Model. 23 (1) (1999) 1–18 (Jan.).
[6] W.M. Arshad, T. Ryckebush, A. Broddefalk, F. Magnussen, H. Lendenmann, M. Lindenmo, Characterization of electrical steel grades for direct application to electrical machine design tools, J. Magn. Magn. Mater. 320 (20) (2008) 2538–2541 (Oct.).
[7] M. Persson, B. Chalmers, A. Mulki, R. Carlson, N. Sadowski, L.O. Grander, New manufacturing methods for electric motors using different soft magnetic material combinations, in: Proceedings of 2nd International Electrical Drives Production Conference, vol. 1995, 4, 2012, pp. 1–7
[8] S.-M. Lu, A review of high-efficiency motors: specification, policy, and technology, Renew. Sustain. Energy Rev. 59 (2016) 1–12 (Jun.).
[9] E.J. Hilinski, Recent developments in semiprocessed cold rolled magnetic lami-nation steel, J. Magn. Magn. Mater. 304 (2006) 172–177.
[10] A. Sonboli, M.R. Toroghinejad, H. Edris, J.A. Szpunar, Effect of deformation route and intermediate annealing on magnetic anisotropy and magnetic properties of a 1 wt% Si non-oriented electrical steel, J. Magn. Magn. Mater. 385 (2015) 331–338 (Jul.).
[11] H.-T. Liu, Z.-Y. Liu, Y. Sun, Y.-Q. Qiu, C.-G. Li, G.-M. Cao, B.-D. Hong, S.-H. Kim, G.-D. Wang, Formation of {001} < 510 > recrystallization texture and magnetic property in strip casting non-oriented electrical steel, Mater. Lett. 81 (2012) 65–68 (Aug.).
[12] H.-T. Liu, J. Schneider, H.-L. Li, Y. Sun, F. Gao, H.-H. Lu, H.-Y. Song, L. Li, D.-Q. Geng, Z.-Y. Liu, G.-D. Wang, Fabrication of high permeability non-oriented electrical steels by increasing〈001〉recrystallization texture using compacted strip casting processes, J. Magn. Magn. Mater. 374 (2015) 577–586 (Jan.). [13] A.J. Moses, Electrical steels: past, present and future developments, Physical
Science, Measurement and Instrumentation, Management and Education, IEEE Proceedings A, vol. 137, no. 5. 1990, pp. 233–245.
[14] E. Lamprecht and R. Graf, Fundamental investigations of eddy current losses in laminated stator cores created through the impact of manufacturing processes, in: Proceedings of the 1st International Electric Drives Production Conference 2011, EDPC-2011, 2011, pp. 29–35.
[15] S. W, Bh Curve and Iron Loss Measurements for Magnetic Materials (Adelaide) (2008), 2008.
[16] C.-K. Hou, Effect of silicon on the loss separation and permeability of laminated steels, J. Magn. Magn. Mater. 162 (2) (1996) 280–290.
[17] Standard Practice for Microetching Metals and Alloys, ASTM International, STAND 2015.
[18] E. Girault, P. Jacques, P. Harlet, K. Mols, J. Van Humbeeck, E. Aernoudt, F. Delannay, Metallographic methods for revealing the multiphase microstructure of TRIP-assisted steels, Mater. Charact. 40 (2) (1998) 111–118 (Feb.). [19] H. Kikuchi, F. Ito, T. Murakami, K. Takekawa, Relationship between magnetic