ScienceDirect
Available online at Available online at www.sciencedirect.comwww.sciencedirect.com
ScienceDirect
Energy Procedia 00 (2017) 000–000
www.elsevier.com/locate/procedia
1876-6102 © 2017 The Authors. Published by Elsevier Ltd.
Peer-review under responsibility of the Scientific Committee of The 15th International Symposium on District Heating and Cooling.
The 15th International Symposium on District Heating and Cooling
Assessing the feasibility of using the heat demand-outdoor
temperature function for a long-term district heat demand forecast
I. Andrić
a,b,c*, A. Pina
a, P. Ferrão
a, J. Fournier
b., B. Lacarrière
c, O. Le Corre
c aIN+ Center for Innovation, Technology and Policy Research - Instituto Superior Técnico, Av. Rovisco Pais 1, 1049-001 Lisbon, PortugalbVeolia Recherche & Innovation, 291 Avenue Dreyfous Daniel, 78520 Limay, France
cDépartement Systèmes Énergétiques et Environnement - IMT Atlantique, 4 rue Alfred Kastler, 44300 Nantes, France
Abstract
District heating networks are commonly addressed in the literature as one of the most effective solutions for decreasing the greenhouse gas emissions from the building sector. These systems require high investments which are returned through the heat sales. Due to the changed climate conditions and building renovation policies, heat demand in the future could decrease, prolonging the investment return period.
The main scope of this paper is to assess the feasibility of using the heat demand – outdoor temperature function for heat demand forecast. The district of Alvalade, located in Lisbon (Portugal), was used as a case study. The district is consisted of 665 buildings that vary in both construction period and typology. Three weather scenarios (low, medium, high) and three district renovation scenarios were developed (shallow, intermediate, deep). To estimate the error, obtained heat demand values were compared with results from a dynamic heat demand model, previously developed and validated by the authors.
The results showed that when only weather change is considered, the margin of error could be acceptable for some applications (the error in annual demand was lower than 20% for all weather scenarios considered). However, after introducing renovation scenarios, the error value increased up to 59.5% (depending on the weather and renovation scenarios combination considered). The value of slope coefficient increased on average within the range of 3.8% up to 8% per decade, that corresponds to the decrease in the number of heating hours of 22-139h during the heating season (depending on the combination of weather and renovation scenarios considered). On the other hand, function intercept increased for 7.8-12.7% per decade (depending on the coupled scenarios). The values suggested could be used to modify the function parameters for the scenarios considered, and improve the accuracy of heat demand estimations.
© 2017 The Authors. Published by Elsevier Ltd.
Peer-review under responsibility of the Scientific Committee of The 15th International Symposium on District Heating and Cooling.
Keywords:Heat demand; Forecast; Climate change
Energy Procedia 145 (2018) 64–69
1876-6102 Copyright © 2018 The Authors. Published by Elsevier Ltd.
Selection and peer-review under responsibility of the scientific committee of the Applied Energy Symposium and Forum, Renewable Energy Integration with Mini/Microgrids, REM 2017
10.1016/j.egypro.2018.04.011
10.1016/j.egypro.2018.04.011 1876-6102
Copyright © 2018 The Authors. Published by Elsevier Ltd.
Selection and peer-review under responsibility of the scientific committee of the Applied Energy Symposium and Forum, Renewable Energy Integration with Mini/Microgrids, REM 2017
Available online at www.sciencedirect.com
ScienceDirect
Energy Procedia 00 (2018) 000–000
www.elsevier.com/locate/procedia
1876-6102 Copyright © 2018 Elsevier Ltd. All rights reserved.
Selection and peer-review under responsibility of the scientific committee of the Applied Energy Symposium and Forum, Renewable Energy Integration with Mini/Microgrids, REM 2017.
Applied Energy Symposium and Forum, Renewable Energy Integration with Mini/Microgrids,
REM 2017, 18
–
20 October 2017, Tianjin, China
CFD modeling and simulation of PEM fuel cell using OpenFOAM
Jean-Paul Kone
a, Xinyu Zhang
a,b,*, Yuying Yan
b,c, Guilin Hu
d, Goodarz Ahmadi
e aInternational Doctoral Innovation Centre, University of Nottingham Ningbo China,199 Taikang East Road, 315100 Ningbo, China bResearch Center for Fluids and Thermal Engineering, University of Nottingham Ningbo China, 199 Taikang East Road; 315100 Ningbo, China cFluids & Thermal Engineering Research Group,University of Nottingham,
University Park, NG7 2RD Nottingham, United Kingdom
dSchool of Mechanical and Automotive Engineering, Zhejiang University of Science and Technology, No 318, Liuhe Rd, 310023 Hangzhou, China
eDepartment of Mechanical and Aeronautical Engineering, Clarkson University, Potsdam, New York, USA
Abstract
A proton exchange membrane (PEM) fuel cell is an electrolytic cell that converts chemical energy of hydrogen reacting with oxygen into electrical energy. To meet increasingly stringent application needs, improved performance and increased efficiency are paramount. Computational fluid dynamics (CFD) is an ideal means for achieving these improvements. In this paper, a comprehensive CFD-based tool that can accurately simulate the major transport phenomena which take place within a PEM fuel cell is presented. The tool is developed using OpenFOAM and it can be used to rapidly gain insights into the cell working processes. The base case results are compared with previous model results and experimental data. The present I-V curve shows better agreement with the experimental trend at low current densities. The simulation data also indicate that the chosen concentration constant has very significant impact on the concentration overpotential.
Copyright © 2018 Elsevier Ltd. All rights reserved.
Selection and peer-review under responsibility of the scientific committee of the Applied Energy Symposium and Forum, Renewable Energy Integration with Mini/Microgrids, REM 2017.
Keywords: Computational fluid dynamics; modelling; numerical; OpenFOAM; proton exchange membrane fuel cell; simulation
* Corresponding author. Tel.: +86-18058261662; fax: +86(0)574 8818 0175.
E-mail addresses: [email protected] (X. Zhang), [email protected] (J. P. Kone).
2 Jean-Paul Kone, Xinyu Zhang, Yuying Yan, Guilin Hu, Goodarz Ahmadi / Energy Procedia 00 (2018) 000–000
1.Introduction
Over the past several decades, fuel cells have become an important low or zero emission energy devices, and thereby an attractive choice for succeeding some of the conventional power devices which depend on fossil fuels. PEM fuel cells have high efficiency and operate at lower temperatures, which make them suitable for automotive power supply, as well as power generation devices for portable electronics and stationary units [1]. The application in the stationary sector covers a wide range of scales going from minigrid-connected combined heat and power systems for residential use, to backup power systems (e.g. e.g. uninterruptible power systems (UPS) for buildings, etc.), to main power supply for buildings.
The vast majority of current research work on PEM fuel cells is concern with improving the cell performance by increasing its efficiency meanwhile decreasing the costs associated with manufacturing and test through the CFD technique; and thereby, further promote their rapid integration with mini/microgrid systems. However, until now, truly comprehensive and open-source code PEM fuel cell models are inexistent in the published literature. This work is an attempt to fill this gap.
The model presented in this work is a single-phase flow and non-isothermal model. It is partly an adaptation of the open-source computational model of a solid oxide fuel cell (SOFC) presented by Beale et al. [2] to a PEM fuel cell. This model is different from that of Beale et al. [2] because: it is a different type of fuel cell, the geometry is different, the boundary conditions are different, and the electrochemistry is different.
Nomenclature
cp specific heat capacity (J kg-1 K-1) δ thickness (m)
F Faraday’s constant (96485 C mol-1 e-)
I current density (A m-2)
k thermal conductivity (W m-1 K-1)
K permeability (m2) μ dynamic viscosity (Pa s) ni number of electron of species i
p pressure (Pa)
ρ density (kg m-3)
∆S entropy of formation (J mol-1 K-1)
T temperature (K)
U⃗⃗ velocity (m s-1)
y mass fraction
2.Mathematical Model
2.1. Assumptions
The model assumptions are listed as follows:
• The fuel cell components are isotropic and homogeneous;
• The membrane is assumed to be fully humidified;
• The membrane is impermeable to reactant gases;
• Steady-state operating condition is assumed;
• The gas flow is laminar and incompressible due to low velocities;
• Ideal individual gases and gas mixture are assumed;
Jean-Paul Kone et al. / Energy Procedia 145 (2018) 64–69 65
ScienceDirect
Energy Procedia 00 (2018) 000–000
www.elsevier.com/locate/procedia
1876-6102 Copyright © 2018 Elsevier Ltd. All rights reserved.
Selection and peer-review under responsibility of the scientific committee of the Applied Energy Symposium and Forum, Renewable Energy Integration with Mini/Microgrids, REM 2017.
Applied Energy Symposium and Forum, Renewable Energy Integration with Mini/Microgrids,
REM 2017, 18
–
20 October 2017, Tianjin, China
CFD modeling and simulation of PEM fuel cell using OpenFOAM
Jean-Paul Kone
a, Xinyu Zhang
a,b,*, Yuying Yan
b,c, Guilin Hu
d, Goodarz Ahmadi
e aInternational Doctoral Innovation Centre, University of Nottingham Ningbo China,199 Taikang East Road, 315100 Ningbo, China
bResearch Center for Fluids and Thermal Engineering, University of Nottingham Ningbo China, 199 Taikang East Road; 315100 Ningbo, China cFluids & Thermal Engineering Research Group,University of Nottingham,
University Park, NG7 2RD Nottingham, United Kingdom
dSchool of Mechanical and Automotive Engineering, Zhejiang University of Science and Technology, No 318, Liuhe Rd, 310023 Hangzhou, China
eDepartment of Mechanical and Aeronautical Engineering, Clarkson University, Potsdam, New York, USA
Abstract
A proton exchange membrane (PEM) fuel cell is an electrolytic cell that converts chemical energy of hydrogen reacting with oxygen into electrical energy. To meet increasingly stringent application needs, improved performance and increased efficiency are paramount. Computational fluid dynamics (CFD) is an ideal means for achieving these improvements. In this paper, a comprehensive CFD-based tool that can accurately simulate the major transport phenomena which take place within a PEM fuel cell is presented. The tool is developed using OpenFOAM and it can be used to rapidly gain insights into the cell working processes. The base case results are compared with previous model results and experimental data. The present I-V curve shows better agreement with the experimental trend at low current densities. The simulation data also indicate that the chosen concentration constant has very significant impact on the concentration overpotential.
Copyright © 2018 Elsevier Ltd. All rights reserved.
Selection and peer-review under responsibility of the scientific committee of the Applied Energy Symposium and Forum, Renewable Energy Integration with Mini/Microgrids, REM 2017.
Keywords: Computational fluid dynamics; modelling; numerical; OpenFOAM; proton exchange membrane fuel cell; simulation
* Corresponding author. Tel.: +86-18058261662; fax: +86(0)574 8818 0175.
E-mail addresses: [email protected] (X. Zhang), [email protected] (J. P. Kone).
2 Jean-Paul Kone, Xinyu Zhang, Yuying Yan, Guilin Hu, Goodarz Ahmadi / Energy Procedia 00 (2018) 000–000
1.Introduction
Over the past several decades, fuel cells have become an important low or zero emission energy devices, and thereby an attractive choice for succeeding some of the conventional power devices which depend on fossil fuels. PEM fuel cells have high efficiency and operate at lower temperatures, which make them suitable for automotive power supply, as well as power generation devices for portable electronics and stationary units [1]. The application in the stationary sector covers a wide range of scales going from minigrid-connected combined heat and power systems for residential use, to backup power systems (e.g. e.g. uninterruptible power systems (UPS) for buildings, etc.), to main power supply for buildings.
The vast majority of current research work on PEM fuel cells is concern with improving the cell performance by increasing its efficiency meanwhile decreasing the costs associated with manufacturing and test through the CFD technique; and thereby, further promote their rapid integration with mini/microgrid systems. However, until now, truly comprehensive and open-source code PEM fuel cell models are inexistent in the published literature. This work is an attempt to fill this gap.
The model presented in this work is a single-phase flow and non-isothermal model. It is partly an adaptation of the open-source computational model of a solid oxide fuel cell (SOFC) presented by Beale et al. [2] to a PEM fuel cell. This model is different from that of Beale et al. [2] because: it is a different type of fuel cell, the geometry is different, the boundary conditions are different, and the electrochemistry is different.
Nomenclature
cp specific heat capacity (J kg-1 K-1) δ thickness (m)
F Faraday’s constant (96485 C mol-1 e-)
I current density (A m-2)
k thermal conductivity (W m-1 K-1)
K permeability (m2) μ dynamic viscosity (Pa s) ni number of electron of species i
p pressure (Pa)
ρ density (kg m-3)
∆S entropy of formation (J mol-1 K-1)
T temperature (K)
U⃗⃗ velocity (m s-1)
y mass fraction
2.Mathematical Model
2.1. Assumptions
The model assumptions are listed as follows:
• The fuel cell components are isotropic and homogeneous;
• The membrane is assumed to be fully humidified;
• The membrane is impermeable to reactant gases;
• Steady-state operating condition is assumed;
• The gas flow is laminar and incompressible due to low velocities;
• Ideal individual gases and gas mixture are assumed;
66 Jean-Paul Kone et al. / Energy Procedia 145 (2018) 64–69
Jean-Paul Kone, Xinyu Zhang, Yuying Yan, Guilin Hu, Goodarz Ahmadi / Energy Procedia 00 (2018) 000–000 3
2.2.Governing equations
The conservation equations are expressed by for mass
𝛻𝛻 ∙ (𝜌𝜌𝑈𝑈⃗⃗ ) = 0 (1)
for momentum
𝛻𝛻 ∙ (𝜌𝜌𝑈𝑈⃗⃗ 𝑈𝑈⃗⃗ ) = −𝛻𝛻𝛻𝛻 + 𝛻𝛻 ∙ (𝜇𝜇𝛻𝛻𝑈𝑈⃗⃗ ) + 𝑆𝑆𝑀𝑀 (2)
where SM is the momentum source term. SM is equal to zero in the gas flow channels. In the porous media (gas diffusion
layers and catalyst layers), SM is equal to Darcy resistance given by
𝑆𝑆𝑀𝑀= −𝜇𝜇𝑈𝑈⃗⃗ 𝐾𝐾 (3)
for chemical species
𝛻𝛻 ∙ (𝜌𝜌𝑈𝑈⃗⃗ 𝑦𝑦𝑖𝑖) = (𝛻𝛻 ∙ 𝜌𝜌𝜌𝜌𝛻𝛻𝑦𝑦𝑖𝑖) (4)
where D is the effective diffusivity of species i in m2 s-1. The mass fraction of the inert species on each electrode is
calculated from the solution of the other species, 𝑦𝑦𝑛𝑛= 1 − ∑𝑛𝑛−1𝑖𝑖=1𝑦𝑦𝑖𝑖
for energy
𝛻𝛻 ∙ (𝜌𝜌𝑐𝑐𝑝𝑝𝑈𝑈⃗⃗ 𝑇𝑇) = 𝛻𝛻 ∙ (𝑘𝑘𝛻𝛻𝑇𝑇) + 𝑆𝑆𝐸𝐸 (5)
where SE is the energy source term. SE is essentially due to the heat released by the electrochemical reaction given by
𝑆𝑆𝐸𝐸=𝛿𝛿𝑀𝑀𝑀𝑀𝑀𝑀𝐼𝐼 (𝜂𝜂 −𝑇𝑇∆𝑆𝑆𝑛𝑛𝑖𝑖𝐹𝐹) (6)
The cell voltage is expressed by
𝑉𝑉𝑐𝑐𝑐𝑐𝑐𝑐𝑐𝑐 = 𝐸𝐸𝑁𝑁𝑐𝑐𝑁𝑁𝑛𝑛𝑁𝑁𝑁𝑁− 𝜂𝜂 (7)
where E is Nernst potential and η is the combined voltage loss, also known as overpotential.
2.3.Boundary conditions
Dirichlet boundary conditions are applied at the fluid inlets. The outlet value is prescribed for pressure at the outlets and Neumann boundary conditions are applied at the fluid outlets for all other variables. The membrane-electrode interfaces are insulated against the flow of mass and chemical species. Impermeability, no-slip, and no-flux boundary conditions are applied at all solid-fluid interfaces. A zero-gradient temperature is applied at all the external surfaces of the cell.
3.Numerical Implementation
The present model has been developed using OpenFOAM, a highly flexible open-source CFD software package.
Almost every component of the software can be customized to suit the users’ needs. Nevertheless, one shortcoming
4 Jean-Paul Kone, Xinyu Zhang, Yuying Yan, Guilin Hu, Goodarz Ahmadi / Energy Procedia 00 (2018) 000–000
of the code is that it has no PEM fuel cell module. The pemfcModels-4.0 toolbox developed here is an attempt to provide such a module.
The geometry and mesh of the fuel cell are shown in Fig. 1. A three-dimensional (3D) description of a complete single cell is used. This consists of a membrane electrode assembly (MEA) placed between two bipolar plates (BP). The MEA has two electrodes (i.e. anode and cathode) which are electrically insulated from each other by the membrane. Each electrode has a gas diffusion layer (GDL) and a catalyst layer (CL). For feeding the cell with hydrogen at the anode side and oxygen at the cathode side, gas flow channels (GFC) are cut into the bipolar plates.
Fig. 1. Geometry and mesh of a single cell PEM fuel cell.
Thus, the modeling domain has multiple regions with multi-physics phenomena existing. This requires different conservation equations to be solved in the different fuel cell components. The solution algorithm follows a specific procedure. After the initialization, several iterations are completed until convergence. For the potentiostatic case the voltage is fixed, whereas for the galvanostatic case the voltage is adjusted until the current density is equal or very close to the initial value. The base case operating conditions are given in Table 1.
Table 1. Base case operating conditions.
Quantity Symbol Value Unit Source Cellvoltage V 0.6 V - Celltemperature Tcell 353 K -
Air outlet pressure pair 101325 Pa -
Fuel outlet pressure pfuel 101325 Pa -
Airinletvelocity Uair 3.082 m s-1 Calculated [3]
Fuelinletvelocity Ufuel 1.1055 m s-1 Calculated [3]
Massfractionofoxygen yO2 0.2 - -
Massfractionofwatervaporinair yH2O 0.15 - -
Massfractionofnitrogen yN2 0.65 - -
Massfractionofhydrogen yH2 0.2 - -
Fractionofwatervaporinfuel yH2O 0.8 - -
Stoichiometryratio - cathodeair ξair 2.0 - -
2.2.Governing equations
The conservation equations are expressed by for mass
𝛻𝛻 ∙ (𝜌𝜌𝑈𝑈⃗⃗ ) = 0 (1)
for momentum
𝛻𝛻 ∙ (𝜌𝜌𝑈𝑈⃗⃗ 𝑈𝑈⃗⃗ ) = −𝛻𝛻𝛻𝛻 + 𝛻𝛻 ∙ (𝜇𝜇𝛻𝛻𝑈𝑈⃗⃗ ) + 𝑆𝑆𝑀𝑀 (2)
where SM is the momentum source term. SM is equal to zero in the gas flow channels. In the porous media (gas diffusion
layers and catalyst layers), SM is equal to Darcy resistance given by
𝑆𝑆𝑀𝑀 = −𝜇𝜇𝑈𝑈⃗⃗ 𝐾𝐾 (3)
for chemical species
𝛻𝛻 ∙ (𝜌𝜌𝑈𝑈⃗⃗ 𝑦𝑦𝑖𝑖) = (𝛻𝛻 ∙ 𝜌𝜌𝜌𝜌𝛻𝛻𝑦𝑦𝑖𝑖) (4)
where D is the effective diffusivity of species i in m2 s-1. The mass fraction of the inert species on each electrode is
calculated from the solution of the other species, 𝑦𝑦𝑛𝑛= 1 − ∑𝑛𝑛−1𝑖𝑖=1 𝑦𝑦𝑖𝑖
for energy
𝛻𝛻 ∙ (𝜌𝜌𝑐𝑐𝑝𝑝𝑈𝑈⃗⃗ 𝑇𝑇) = 𝛻𝛻 ∙ (𝑘𝑘𝛻𝛻𝑇𝑇) + 𝑆𝑆𝐸𝐸 (5)
where SE is the energy source term. SE is essentially due to the heat released by the electrochemical reaction given by
𝑆𝑆𝐸𝐸=𝛿𝛿𝑀𝑀𝑀𝑀𝑀𝑀𝐼𝐼 (𝜂𝜂 −𝑇𝑇∆𝑆𝑆𝑛𝑛𝑖𝑖𝐹𝐹) (6)
The cell voltage is expressed by
𝑉𝑉𝑐𝑐𝑐𝑐𝑐𝑐𝑐𝑐 = 𝐸𝐸𝑁𝑁𝑐𝑐𝑁𝑁𝑛𝑛𝑁𝑁𝑁𝑁− 𝜂𝜂 (7)
where E is Nernst potential and η is the combined voltage loss, also known as overpotential.
2.3.Boundary conditions
Dirichlet boundary conditions are applied at the fluid inlets. The outlet value is prescribed for pressure at the outlets and Neumann boundary conditions are applied at the fluid outlets for all other variables. The membrane-electrode interfaces are insulated against the flow of mass and chemical species. Impermeability, no-slip, and no-flux boundary conditions are applied at all solid-fluid interfaces. A zero-gradient temperature is applied at all the external surfaces of the cell.
3.Numerical Implementation
The present model has been developed using OpenFOAM, a highly flexible open-source CFD software package.
Almost every component of the software can be customized to suit the users’ needs. Nevertheless, one shortcoming
of the code is that it has no PEM fuel cell module. The pemfcModels-4.0 toolbox developed here is an attempt to provide such a module.
[image:4.544.118.424.419.622.2]The geometry and mesh of the fuel cell are shown in Fig. 1. A three-dimensional (3D) description of a complete single cell is used. This consists of a membrane electrode assembly (MEA) placed between two bipolar plates (BP). The MEA has two electrodes (i.e. anode and cathode) which are electrically insulated from each other by the membrane. Each electrode has a gas diffusion layer (GDL) and a catalyst layer (CL). For feeding the cell with hydrogen at the anode side and oxygen at the cathode side, gas flow channels (GFC) are cut into the bipolar plates.
Fig. 1. Geometry and mesh of a single cell PEM fuel cell.
Thus, the modeling domain has multiple regions with multi-physics phenomena existing. This requires different conservation equations to be solved in the different fuel cell components. The solution algorithm follows a specific procedure. After the initialization, several iterations are completed until convergence. For the potentiostatic case the voltage is fixed, whereas for the galvanostatic case the voltage is adjusted until the current density is equal or very close to the initial value. The base case operating conditions are given in Table 1.
Table 1. Base case operating conditions.
Quantity Symbol Value Unit Source Cellvoltage V 0.6 V - Celltemperature Tcell 353 K -
Air outlet pressure pair 101325 Pa -
Fuel outlet pressure pfuel 101325 Pa -
Airinletvelocity Uair 3.082 m s-1 Calculated [3]
Fuelinletvelocity Ufuel 1.1055 m s-1 Calculated [3]
Massfractionofoxygen yO2 0.2 - -
Massfractionofwatervaporinair yH2O 0.15 - -
Massfractionofnitrogen yN2 0.65 - -
Massfractionofhydrogen yH2 0.2 - -
Fractionofwatervaporinfuel yH2O 0.8 - -
Stoichiometryratio - cathodeair ξair 2.0 - -
68 Jean-Paul Kone et al. / Energy Procedia 145 (2018) 64–69
Jean-Paul Kone, Xinyu Zhang, Yuying Yan, Guilin Hu, Goodarz Ahmadi / Energy Procedia 00 (2018) 000–000 5
4.Base Case Results
Fig. 2 (a) and 2 (b) show the distribution of hydrogen and oxygen mass fractions, respectively. The mass fractions decrease from the cell inlet to the cell outlet and from the GFCs to the CLs as the electrodes are depleted of the reactants by the electrochemical reaction.
Fig. 2. Species mass fraction distribution (a) Hydrogen; (b) Oxygen.
[image:5.544.154.392.142.287.2]Fig. 3 (a) illustrates the distribution of the Nernst potential. This decreases from the cell inlet to the cell outlet as the anode is depleted of the fuel due to the combined effects of the consumption of hydrogen and the production of water vapor, which result in a decrease in the observed local current density as shown in Fig. 3 (b). Fig. 3 (c) shows the distribution of the local temperature. Reduced heat sources such as Joule heating and the heat released by the electrochemical reaction under the ribs are the origin of the non-uniform nature of the temperature field. The reduced reaction heat under the ribs is due to lower current densities in these areas due to reduced mass transfer.
Fig. 3. Membrane cathode interface showing the distribution of (a) Nernst potential; (b) Local current density; (c) Temperature.
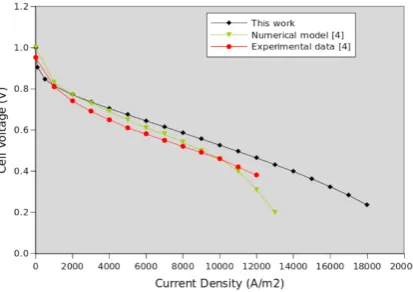
Fig. 4 plots the cell polarization or I-V curve. The results of the present work are compared to the results of the numerical model and experimental data reported in Yuan et al. [4] since some of the parameters and properties used in the present model were borrowed from Yuan et al. [4]’s multiphase flow model. The present I-V curve shows better agreement with the experimental trend at low current density, which confirms the validity of the present model. The difference between the present and experimental I-V curves can be attributed to, amongst other things, the combined effects of concentration losses, the cell inlet flow rates, and the consideration of multiphase flow phenomenon. The effective value of the concentration constant is often much larger than its theoretical value, leading to a much larger drop in the current density. Therefore, this constant is often obtained empirically [5]. As for multiphase flow, the
6 Jean-Paul Kone, Xinyu Zhang, Yuying Yan, Guilin Hu, Goodarz Ahmadi / Energy Procedia 00 (2018) 000–000
existence of liquid water blocks gas diffusion passages, reduces the diffusion rate and the effective reaction surface area, and hence leads to a deterioration in fuel cell performance.
Fig. 4. Polarization curve.
5.Conclusion and Outlook
A toolbox for the numerical simulation of single-phase flow in a PEM fuel cell has been developed using OpenFOAM. The toolbox includes a main program, relevant library classes, and a constructed simulation case for a co-flow gavanostatic simulation.
The base case results are as expected. The plotted polarization curve agrees better with the experimental trend at low current densities compared to a known previous numerical model. Moreover, the simulation data indicate that the value of the concentration constant has significant effects on the cell potential at high current densities.
The provided solver can serve as a basis to develop other features, such as improved catalyst and membrane models, or multiphase flow. Arrangements are being made to make the toolbox available.
Acknowledgements
The authors acknowledge the financial support from the International Doctoral Innovation Centre, Ningbo Education Bureau, Ningbo Science and Technology Bureau, and the University of Nottingham. This work was also supported by the UK Engineering and Physical Sciences Research Council [grant numbers EP/G037345/1 and EP/L016362/1], Faculty of Science and Engineering at University of Nottingham Ningbo China [SRG code 01.03.05.04.2015.02.001], Ningbo Natural Science Foundation Program [project code 2013A610107] and Ningbo Science and Technology Bureau Technology Innovation Team [Grant No. 2016B10010].
References
[1] Kone JP, Zhang X, Yan Y, Hu G, Ahmadi G. Three-dimensional multiphase flow computational fluid dynamics models for proton exchange membrane fuel cell: A theoretical development. The Journal of Computational Multiphase Flows. 2017;9:3-25.
[2] Beale SB, Choi H-W, Pharoah JG, Roth HK, Jasak H, Jeon DH. Open-source computational model of a solid oxide fuel cell. Computer Physics Communications. 2016;200:15-26.
[3] Liu Z. Fuel cell performance. New York: Nova Science Publishers; 2012.
[4] Yuan W, Tang Y, Pan MQ, Li ZT, Tang B. Model prediction of effects of operating parameters on proton exchange membrane fuel cell performance. Renewable Energy. 2010;35:656-66.
[image:5.544.80.466.407.550.2]4.Base Case Results
Fig. 2 (a) and 2 (b) show the distribution of hydrogen and oxygen mass fractions, respectively. The mass fractions decrease from the cell inlet to the cell outlet and from the GFCs to the CLs as the electrodes are depleted of the reactants by the electrochemical reaction.
Fig. 2. Species mass fraction distribution (a) Hydrogen; (b) Oxygen.
Fig. 3 (a) illustrates the distribution of the Nernst potential. This decreases from the cell inlet to the cell outlet as the anode is depleted of the fuel due to the combined effects of the consumption of hydrogen and the production of water vapor, which result in a decrease in the observed local current density as shown in Fig. 3 (b). Fig. 3 (c) shows the distribution of the local temperature. Reduced heat sources such as Joule heating and the heat released by the electrochemical reaction under the ribs are the origin of the non-uniform nature of the temperature field. The reduced reaction heat under the ribs is due to lower current densities in these areas due to reduced mass transfer.
Fig. 3. Membrane cathode interface showing the distribution of (a) Nernst potential; (b) Local current density; (c) Temperature.
Fig. 4 plots the cell polarization or I-V curve. The results of the present work are compared to the results of the numerical model and experimental data reported in Yuan et al. [4] since some of the parameters and properties used in the present model were borrowed from Yuan et al. [4]’s multiphase flow model. The present I-V curve shows better agreement with the experimental trend at low current density, which confirms the validity of the present model. The difference between the present and experimental I-V curves can be attributed to, amongst other things, the combined effects of concentration losses, the cell inlet flow rates, and the consideration of multiphase flow phenomenon. The effective value of the concentration constant is often much larger than its theoretical value, leading to a much larger drop in the current density. Therefore, this constant is often obtained empirically [5]. As for multiphase flow, the
existence of liquid water blocks gas diffusion passages, reduces the diffusion rate and the effective reaction surface area, and hence leads to a deterioration in fuel cell performance.
Fig. 4. Polarization curve.
5.Conclusion and Outlook
A toolbox for the numerical simulation of single-phase flow in a PEM fuel cell has been developed using OpenFOAM. The toolbox includes a main program, relevant library classes, and a constructed simulation case for a co-flow gavanostatic simulation.
The base case results are as expected. The plotted polarization curve agrees better with the experimental trend at low current densities compared to a known previous numerical model. Moreover, the simulation data indicate that the value of the concentration constant has significant effects on the cell potential at high current densities.
The provided solver can serve as a basis to develop other features, such as improved catalyst and membrane models, or multiphase flow. Arrangements are being made to make the toolbox available.
Acknowledgements
The authors acknowledge the financial support from the International Doctoral Innovation Centre, Ningbo Education Bureau, Ningbo Science and Technology Bureau, and the University of Nottingham. This work was also supported by the UK Engineering and Physical Sciences Research Council [grant numbers EP/G037345/1 and EP/L016362/1], Faculty of Science and Engineering at University of Nottingham Ningbo China [SRG code 01.03.05.04.2015.02.001], Ningbo Natural Science Foundation Program [project code 2013A610107] and Ningbo Science and Technology Bureau Technology Innovation Team [Grant No. 2016B10010].
References
[1] Kone JP, Zhang X, Yan Y, Hu G, Ahmadi G. Three-dimensional multiphase flow computational fluid dynamics models for proton exchange membrane fuel cell: A theoretical development. The Journal of Computational Multiphase Flows. 2017;9:3-25.
[2] Beale SB, Choi H-W, Pharoah JG, Roth HK, Jasak H, Jeon DH. Open-source computational model of a solid oxide fuel cell. Computer Physics Communications. 2016;200:15-26.
[3] Liu Z. Fuel cell performance. New York: Nova Science Publishers; 2012.
[4] Yuan W, Tang Y, Pan MQ, Li ZT, Tang B. Model prediction of effects of operating parameters on proton exchange membrane fuel cell performance. Renewable Energy. 2010;35:656-66.
[image:6.544.179.386.106.252.2]