This article was downloaded by: [University of St Andrews] On: 22 December 2014, At: 05:05
Publisher: Taylor & Francis
Informa Ltd Registered in England and Wales Registered Number: 1072954 Registered office: Mortimer House, 37-41 Mortimer Street, London W1T 3JH, UK
Autophagy
Publication details, including instructions for authors and subscription information:
http://www.tandfonline.com/loi/kaup20
Cutting a fine figure
John Milton Lucocqa & Christian Hackeraa
Nanomorphomics Group; School of Medicine; University of St. Andrews; North Haugh, Fife UK
Published online: 10 Jul 2013.
To cite this article: John Milton Lucocq & Christian Hacker (2013) Cutting a fine figure, Autophagy, 9:9, 1443-1448, DOI: 10.4161/auto.25570
To link to this article: http://dx.doi.org/10.4161/auto.25570
PLEASE SCROLL DOWN FOR ARTICLE
Taylor & Francis makes every effort to ensure the accuracy of all the information (the “Content”) contained in the publications on our platform. Taylor & Francis, our agents, and our licensors make no representations or warranties whatsoever as to the accuracy, completeness, or suitability for any purpose of the Content. Versions of published Taylor & Francis and Routledge Open articles and Taylor & Francis and Routledge Open Select articles posted to institutional or subject repositories or any other third-party website are without warranty from Taylor & Francis of any kind, either expressed or implied, including, but not limited to, warranties of merchantability, fitness for a particular purpose, or non-infringement. Any opinions and views expressed in this article are the opinions and views of the authors, and are not the views of or endorsed by Taylor & Francis. The accuracy of the Content should not be relied upon and should be independently verified with primary sources of information. Taylor & Francis shall not be liable for any losses, actions, claims, proceedings, demands, costs, expenses, damages, and other liabilities whatsoever or howsoever caused arising directly or indirectly in connection with, in relation to or arising out of the use of the Content.
This article may be used for research, teaching, and private study purposes. Terms & Conditions of access and use can be found at http://www.tandfonline.com/page/terms-and-conditions
Autophagy 9:9, 1443–1448; September 2013; © 2013 Landes Bioscience
ViewS And CommentArieS
Cutting a fine figure
On the use of thin sections in electron microscopy to quantify autophagy
John Milton Lucocq* and Christian Hacker
Nanomorphomics Group; School of Medicine; University of St. Andrews; North Haugh, Fife UK
O
ver the last few years, two guide-line articles have been published with recommendations for assessing autophagy. These articles contained advice on quantification of autophagy by electron microscopy and proposed using thin slices for quantifying auto-phagic structures. Here, we expand on what can and cannot be quantified using single 2D slices and give some suggestions for efficient and minimally biased approaches for quantifying this fascinating and important process. We recommend that the journal Autophagyfollow other journals in demanding stringent random sampling design and application of unbiased design-based quantification when reviewing submit-ted manuscripts.
The Power of Electron Microscopy (EM)
EM is, without doubt, the gold standard for organelle characterization. It provides exquisite resolution that is orders of mag-nitude better than any conventional, or even super-resolution, light microscopy allowing display of membranes, cytoplas-mic coat structures and lumenal content that are all relevant in autophagy
stud-ies.1,2 A less well-known but nevertheless
significant additional advantage is that, in addition to the organelle of interest, EM displays a wide array of structures within
the cellular framework.3 This
visualiza-tion of the structural framework provides a huge array of possibilities for reliable identification, context analysis, con-nectivity and spatial analysis, all at high resolution.
The Strange World of Two-Dimensional (2D) Slices
With such detailed structural/molecular information, the possibilities for quan-tifying cellular structures and processes should be extensive. However, the display of structural details depends on slicing and, here, we describe how 2D infor-mation is “disconnected” from three-dimensional (3D) information. As a consequence, when it comes to quantify-ing from EM sections, extreme care and appropriate design is needed from the outset to get reliable and efficient results that really mean something about cellular quantities.
A first problem to solve with EM sec-tions is that of organelle identification, because, in essence, one cannot measure that which one cannot “see”! Thus, for any quantitative analysis, organelles or subsets thereof, need to be reliably identified as they appear in the slices. It is therefore important to first draw up clear identifi-cation criteria, which allow reproducible assignment of any image to an organelle category of interest. It may even be neces-sary in some circumstances, to check by serial sectioning, that specific features uti-lized in the slices really do report on 3D structures, or to label using immuno-EM to characterize the organelle type. Auto-phagic structure identification is not the main focus of this article but examples of criteria used in autophagy studies are structural features such as the presence of a double membrane of early autophagic structures (discussed below) or the molec-ular markers identified using immunogold
labeling such as LC3.2
Keywords: stereology, sampling, autophagy, electron microscopy, quan-tification, systematic uniform random
Abbreviations: 2D, two-dimensional; 3D, three-dimensional; EM, electron microscopy; SUR, systematic uniform random
Submitted: 01/07/13 Revised: 06/25/13 Accepted: 06/27/13
http://dx.doi.org/10.4161/auto.25570
*Correspondence to: John Milton Lucocq; Email: [email protected]
ViewS And CommentArieS
A second problem to solve, when ultra-thin sections are used, is how to quantify, and this is dealt with in detail here. Slic-ing is a widespread approach for visual-izing the inner fabric and composition of biological structures. Taking the example of the human body, it is obvious that the shape and size of an individual organ (such as the liver) cannot be directly rep-resented on a single slice and this is a good reason for reassembling the 3D struc-ture of organs in silico for better clinical diagnosis. At the cellular level it is clear that something more needs to be done to extract volume, surface, length and num-ber in 3D from the 2D information dis-played on an ultrathin section examined in electron microscopy.
Number is not Accessible from a Single EM Section
This “disconnect” between the 2D profiles and the 3D objects is well illustrated when we consider how the “dimensions” of size and number are actually represented on a
slice.4,5 For example, an object with
vol-ume in 3D is actually represented by an area on the plane of a thin slice, while a surface in 3D produces a line in 2D, and a linear feature interacts with the slice-plane
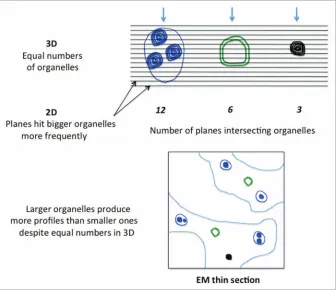
[image:3.612.50.386.60.350.2]to produce a point. Importantly, all this shows that a plane section represents each 3D parameter at a dimension reduced by one in each case—a fact that pro-vides us with some insight into whether we might be able to count items such as autophagic structures. As number is zero dimensional, it cannot be represented by any dimensional representation on a slice-plane. And if this is so, then what does a count of autophagic structure profiles rep-resent? The answer has everything to do with the probability that a section plane intersects with the 3D objects in question. Intuitively, one might appreciate that the chance of a section plane transecting an object is related to its height in the direc-tion of secdirec-tioning (see refs. 5 and 6; Fig. 1). A simple illustration would be a cell within which an organelle only stretches across half of the cell. Clearly, of all the possible randomly placed section planes, only one half of those falling in the cell will tran-sect the organelle. Therefore, by counting profiles there would then appear to be only half as many organelles as there are cells, even though there is exactly one of each in 3D! This means that the frequency of organelle profiles (e.g., autophagic struc-tures) is determined not just by their number in 3D but also by their ‘height’
Figure 1. the size of an organelle determines its chance of occurring in a section plane. different types of autophagic structures (left and center) and a late endosome/lysosomal organelle (far right) are illustrated and are cut by a series of 2d section planes (black hori-zontal lines). the number of section planes that hit these organelles is determined by the relative heights orthogonal to the direc-tion of secdirec-tioning (this direcdirec-tion is indicated by arrows). even though the numbers of each organelle in 3d are equal, the bias caused by sectioning would produce four times as many profiles when the section planes intersect the largest organelle (in this case 12 section planes) compared with smallest organelle (4 section planes). As an illustration of this effect, the thin section in the lower part of the figure displays profiles of these different organelles with frequencies that reflect their relative sizes and not their equal number in 3d.
in the direction of sectioning. In fact, this ‘height’ is sensitive to factors such as size, shape and orientation. In the case of autophagic structure quantification, any change in the number of profiles may be linked to changes in height or number or both. Any counts of profiles expressed as a density or relative proportion between vacuoles of certain types should therefore be interpreted with extreme care.
So how might numbers be counted using slicing procedures? The solution is to use a volume-based probe and this can only be generated at the EM level by com-bining more than one section or by using electron tomography. This is rarely done, but if the extra work is invested, then there
can be rich rewards.7-9
The above considerations emphasize that autophagic structures cannot be counted reliably using single EM sec-tions and must be counted by combining information obtained from sets of parallel slices. An estimate of profile number per unit area, or the ratio of profiles of one type to another, is sensitive to both organ-elle number and other organorgan-elle param-eters such as size. When comparing, say, control and experimental cells, the only way a profile count in a 2D plane can reliably reflect relative numbers in 3D is when particles have identical size (height) distributions in both groups—and this is mostly unknown and would take a signifi-cant amount of work to check. So, how-ever compelling and intuitive it seems, to start counting structures or measuring
counting on sections to quantify the total space enclosed by phagophores and autophagosomes together (both are sur-rounded by the double membrane), it may not be possible to differentiate how much of the space belongs to each. To determine the contribution from each, additional information may be needed from serial sectioning or by identifying a molecu-lar/structural marker for phagophores or autophagosomes. In the case that phago-phores present structures with extremely large openings it may be useful to quantify their membranes rather than the enclosed contents (see below).
Increasing Efficiency: Random Sampling with a Twist
Any estimate of the fractional volume will be valid for the part of the cytoplasm that lies in the immediate vicinity of the
chosen section, but the challenge is to obtain estimates of fractional volume of autophagic structures that are valid for the whole cell pellet, tissue, organ, animal, experimental condition or cell culture. In EM, micrographs act like extremely small windows through which small portions of the section are visualized, and the sections are themselves samples of the whole speci-men. To link the information within these small windows to the whole specimen, it is necessary to carry out a sampling pro-tocol that ensures all possible sections and micrographs derived from the specimen are equally likely. This means that some form of random sampling is the method of choice.
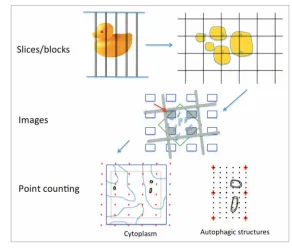
[image:4.612.244.536.55.307.2]However, because a random process has a tendency to cluster, it can lead to rel-atively large fluctuations in the estimates because of local “over-representation” and “under-representation” of biological
Figure 2. Sampling scheme for quantitative estimation of autophagic structure volume fraction in the cytoplasm. Systematic uniform random (SUr) sampling is the strategy of choice because of its efficiency and lack of bias. the tissue/organ/cell pellet can be sectioned into a randomly placed and evenly spaced set of slices. Systematic random locations mark the sampling positions of the blocks that will be processed and embedded for em. First, sections taken from these blocks will be positioned by SUr inside the tissue/pellet. Appropriately stained sections are mounted on em grid supports (gray lines). micrographs are taken at low magnification in an SUr array, covering a whole section/pellet profile (typically, these number 10–20). the magnification is selected to contain maximal areas of the cytoplasm but allow clear identification of autophagic structure profiles for subsequent image recording at high power. Point counting proceeds on each of the micrographs as detailed in Figure 3. (note that if necessary for volume fraction analysis, orientations of the cells can be preserved prior to the preparation of random sections, thereby preserving key spatial information about the location of autophagic processes relative to cell structure, as might occur in polarized cells).
them on the slices, it is a simple fact that the information present in the slice needs to be carefully considered before valid data can be derived from it.
Volume and other Sizes are Accessible on Single EM Sections
While it is clear that, with the dimensional reduction outlined above, number cannot be estimated on a single slice, thankfully other aggregate parameters of size such as volume and surface are accessible. In this article, we first consider the simplest and most straightforward parameter, which is volume. A principle described over a
cen-tury ago by Delesse10 established that the
fraction of cytoplasm profile area that is occupied by organelle profiles on a plane section, the so-called “fractional area,” is an estimate of “fractional volume” of the cytoplasm occupied by the organelle. In stereological parlance, the cytoplasm is called the reference space and the auto-phagic structures the component phase. One way to obtain an estimate of frac-tional volume is to employ a regular array of points, which can be used to interact systematically with the cytoplasmic space and count the fraction of points that land on the autophagic structures (see lower
part of Figs. 2 and 3). Importantly, in
order to ensure unbiased values, the point array must be placed at random on ran-domly-sampled sections. Note that in the case of autophagic structures it is reason-able to select the cytoplasm as the reference space, rather than the whole cell, since up to now autophagic structures have not been described in the nucleoplasm!
Finally it is worth reemphasizing the important issue of compartment identifi-cation. The earliest autophagic structures, also known as phagophores, are assembled as cisternal structures that eventually enclose a region of cytoplasm within an autophagic vacuole. Later on, the “ends” of the phagophore cisternal membranes appear to undergo fusion to form a closed vesicle surrounded by a double limiting membrane and these structures are then known as autophagosomes. Unless the open ends of the phagophores appear in the plane of section, these two struc-tures may not therefore be differentiated. So while it is possible to carry out point
structures, especially if they are inherently rather heterogeneous in their distribu-tion. A better approach in most biological systems is to spread the samples through the whole specimen at regular intervals, avoiding bias by positioning the whole array with a random start. This twist on random sampling is termed systematic uniform random sampling or SUR sam-pling. For EM and other estimation pur-poses, SUR sampling is likely to be more efficient than simple random sampling and is of widespread utility in cell biol-ogy.11,12 The only factor likely to
compro-mise its efficiency is the presence in the specimen of a pattern, which happens to coincide with the frequency interval of SUR samples. However, this can be over-come easily by altering the sampling inter-val. SUR sampling is particularly useful whenever biological spaces/surfaces need to be sampled, as in the case of autophagic structures.
So how is SUR sampling applied to
EM in practice (Fig. 2)? An SUR sample
of tissues/organs can be produced by sys-tematic selection from a complete array of slices sampled at intervals through the whole organ. The first slice of the series is selected at random to ensure the absence of bias. Each selected slice can be over-laid with a randomly placed systematic sampling framework and cut into blocks. This ensures SUR placement of sections produced from the embedded blocks and, again, micrographs can be positioned as an SUR array over the whole section pro-file with the first micrograph positioned randomly by alignment with the corner of a hole of the EM support grid square (Fig. 2).
Once micrographs have been recorded, the final step is to carry out estimation of the volume fraction using point counting
with a systematic array of points (Figs. 2
[image:5.612.94.349.56.291.2]and 3). Note that once the random or
Figure 3. Principle of point counting to estimate fractional volumes of autophagic structures in the cytoplasm. A systematic grid lattice of widely spaced points (red crosses) is placed randomly over the micrograph (blue lines) containing an inset quadrat (gray dotted lines). the inset quadrat enables cell features such as autophagic structures within this rectangular area to be reliably identi-fied even if they cross edges of the quadrat. Points (P) are defined by the corner at which the two lines of the cross meet (see inset top right). in the case illustrated here, points that interact with the cytoplasm (Pcyt) are 8 in number. often, autophagic structures are infrequent and small in size and it may be preferable to carry out point counts on autophagic structure profiles (PAP) found within the cytoplasm micrographs using a grid lattice with a higher density. An estimate of volume fraction =
ΣPAP/ ΣPcyt . ρ, where ρ is the number of points on the dense grid used for autophagic structures that represent each point on the grid used for the cytoplasm (in this case 25). So in this example with 8 point-hits over autophagic structures, an estimate of the volume fraction = 8/200. A key advantage of point counting is that the counts are decisions about whether a point is in or out of a structure and not traces or measurements.
SUR sampling has been applied at all levels, including the point counting, the number of point counts needed to obtain reasonable precision is 100–200 for each element of the ratio (points on autophagic structures divided by points on reference space) in each experimental condition— this means the counts take minutes and are a minor outlay compared with the time required for processing, sectioning and imaging.
In the case of autophagy, the autophagic structures are rather infrequent and small compared with the cytoplasm, and so it is advisable, (1) to include as much cell space as possible by recording micrographs at a magnification that is the smallest at which the borders of the autophagic structures can be reliably identified, and (2) use two different densities of points in a so-called “coherent” point sampling grid which has a known ratio between the numbers of
points at each density (Fig. 3). Another
approach (not illustrated here) is to sys-tematically scan all the available reference space (cytoplasm) that is displayed in the
section and take pictures of all autophagic
structures at high magnification and then take low magnification views for quantify-ing the area of the cytoplasm from which the autophagic structures were sampled. Point counting would proceed as already
described (Fig. 3) except that in addition,
account is now made for the different magnifications used when calculating the ratio of point counts that have been made over cytoplasm and autophagic structures, respectively.
As already suggested, there is a rela-tionship between the boundary length of, say, membrane profiles and the pack-ing density of surface within the cyto-plasm. When early autophagic structure membranes are a particular focus, then this approach could be useful because it detects phagophores as well as other auto-phagic structures, irrespective of whether they have completely enclosed their con-tents. The principle is to apply an array of test lines and count intersections with the autophagic structure membranes (Fig. 4). By simultaneous point counting over the reference space it is then possible to estimate the line length applied to the reference space and a simple formula esti-mates the packing density of autophagic
structure membrane in the cytoplasm from the intersection counts. The basis for this relationship will not be discussed further here, but an unbiased estimate of packing density is obtained when ran-domization of specimen orientations is achieved in addition to the randomization of position described for volume fraction (Fig. 4; see ref. 14 for further details). Randomization of orientation for EM can be arranged easily by embedding the sam-ple in a small ball of gelatin and rolling it
prior to embedding in resin.13
The Reference Trap: Reporting Concentrations or Amounts?
The volume fraction is a ratio and is determined by two components: the volume of autophagic structures and the volume of the reference space (most often the cytoplasm). Similarly, surface density is determined by the surface of autophagic structure membrane in cyto-plasmic volume. Herein lies the so-called
reference trap and caution is required.14
Why? Because while, on the one hand, an increase in say the volume fraction can reflect an increase in the volume of auto-phagic structures, on the other hand, it could also reflect a decrease in volume of the reference space. Imagine an autophagy stimulus, such as amino acid/growth fac-tor deprivation, which also prevents cell growth (reducing increases in cell size) and causes an increase in autophagic structure fractional volume without any change in the autophagic structure pool. Of course, one could argue that, in the short-term, the chance that gross physiological causes of reference space change are unlikely to produce large changes in its volume. But a cautionary note comes from studies on human brain in which differential shrink-age of the reference led to the misguided impression that there was excessive deple-tion of neurons in older brains compared
with young ones.15
The reference space volume can be determined in a number of ways. One is to estimate the volume from a set of slices using the principle of Cavalieri either by light microscopy (e.g., confocal) or by
EM.14 The principle is to take a randomly
positioned systematic series of sections and to estimate the area of the reference
volume displayed on these. The sum of the areas multiplied by the distance between the sections is an estimate of the volume. Other ways to estimate the cell volume are by analyzing live cells with cell content markers or by combining cell height
mea-surements in EM with cell counts.16
Recommendations for Quantitative Assessment of Autophagy in Thin Section-EM
In summary, there are several dos and don’ts that show the way through to unbi-ased and efficient estimates of autophagic structures in thin sections. They stem from the strange relationship between the 2D
slice-plane profiles and the quantitative 3D reality of the autophagic structures in the cell. A first step is to establish “cast-iron” criteria for assigning 2D profiles to 3D
object sets. Do not count profiles, because
[image:6.612.249.538.55.285.2]autophagic structures vary in size and shape. Use fractional volume estimates as a preferred starting point. Make a sampling scheme that uses at least random and pref-erably SUR sampling at all sampling levels including the slices, blocks, sections and micrographs. The sampling is crucial to obtaining unbiased and also efficient esti-mates. Make sure that images of both the cytoplasm and the autophagic structures are recorded at magnifications that allow clear identification of compartments and
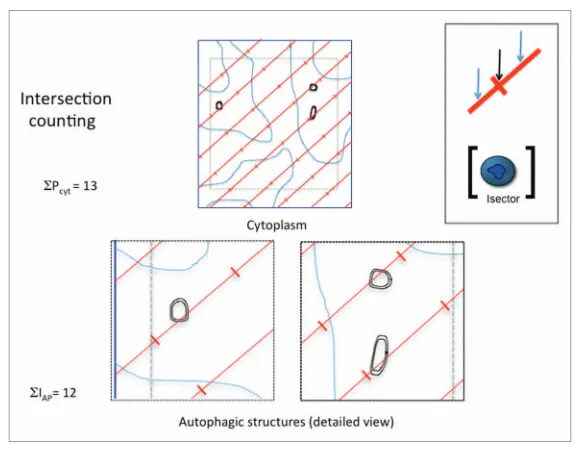
Figure 4. Principle of intersection counting to estimate surface density of autophagic structure membranes in the cytoplasm. A systematic grid of test lines (red) is placed randomly over the micro-graph (blue lines) containing an inset quadrat (gray dotted lines) to aid identification of organelles. intersections (i) are counted along one edge of the lines (see inset top right, blue arrows) and each line is adorned with points, positioned at regular intervals and identified as in Figure 3 by the cor-ners between crossed lines (black arrow). in the case illustrated here, points that interact with the cytoplasm (Pcyt) are 13 in number. Counts are made of intersections of the test lines with autophagic structure membranes (in this case each of two limiting membranes) and are 12 in number. An esti-mate of the surface density = 2∑iAP/ Lcyt, where Lcyt is the length of test line applied to the cytoplasm (the reference space) and is determined by the number of points falling on the cytoplasm ΣPcyt x the interpoint length. thus, if the interpoint length is 5 microns, then the surface density estimate is 24/65 in µm-1. A similar multistage sampling scheme can be used as for volume fraction, but
orien-tations must be randomized in addition to the positions, using for example the isector (specimen encased in a ball of gelatin/agarose and rolled before resin embedding; bracketed insert).13 note
that for surface density estimations on polarized or monolayer culture cells there is a specialized technique that allows the generation of randomly orientated line probes on a section with a cho-sen “vertical” direction. in this case the “isector “is not used and the random lines are reprecho-sented by cycloids placed with reference to a vertical direction which can be chosen to preserve the polar-ized organization of the cell structures (see ref. 14 for details). For simplicity and clarity, the array of test lines illustrated in the figure are oriented parallel in one direction. other arrangements include a square lattice or semicircles. Both of these arrangements can reduce the variance linked to any preferred orientations in the membranes of the target organelle.
delineation of profile boundaries. Point counting stereology can then be employed and is a rapid and efficient way to estimate areas. Similar guidelines apply to surface density estimations but these also require randomization of either test line or speci-men orientation in 3D. Importantly it is rarely necessary to count more than 200 points or intersections over each compart-ment of interest for reasonable precision and efficiency of estimation.
Finally we would urge the autophagy community and associated journals to
adopt policies for manuscript submission that stipulate a requirement for the use of rigorous sampling techniques and unbi-ased design-bunbi-ased methods for
quantify-ing autophagic structures.17-19 One of us
has recently emphasized the importance of
doing this is in cell biology12 and a number
of journals are aligned with this view.
Acknowledgments
The authors were supported by grants from the Wellcome Trust (WT089803MA) and J.M.L. acknowledges the lifelong support
of friends and colleagues of the quantita-tive EM community in promoting unbi-ased and efficient methods for organelle quantification. We thank Terry Mayhew for helpful comments and Susan Lucocq for reading the manuscript.
Disclosure of Potential Conflicts of Interest No potential conflicts of interest were disclosed.
References
1. Klionsky DJ, Abeliovich H, Agostinis P, Agrawal DK, Aliev G, Askew DS, et al. Guidelines for the use and interpretation of assays for monitoring autophagy in higher eukaryotes. Autophagy 2008; 4:151-75; PMID:18188003
2. Klionsky DJ, Abdalla FC, Abeliovich H, Abraham RT, Acevedo-Arozena A, Adeli K, et al. Guidelines for the use and interpretation of assays for moni-toring autophagy. Autophagy 2012; 8:445-544; PMID:22966490; http://dx.doi.org/10.4161/ auto.19496
3. Lucocq J. Quantification of structures and gold label-ing in transmission electron microscopy. Methods Cell Biol 2008; 88:59-82; PMID:18617028; http:// dx.doi.org/10.1016/S0091-679X(08)00404-4 4. Lucocq J. Unbiased 3-D quantitation of
ultra-structure in cell biology. Trends Cell Biol 1993; 3:354-8; PMID:14731905; http://dx.doi. org/10.1016/0962-8924(93)90106-B
5. Gundersen HJ. Stereology of arbitrary particles. A review of unbiased number and size estima-tors and the presentation of some new ones, in memory of William R. Thompson. J Microsc 1986; 143:3-45; PMID:3761363; http://dx.doi. org/10.1111/j.1365-2818.1986.tb02764.x
6. Mayhew TM, Gundersen HJ. If you assume, you can make an ass out of u and me’: a decade of the disector for stereological counting of particles in 3D space. J Anat 1996; 188:1-15; PMID:8655396
7. Sterio DC. The unbiased estimation of number and sizes of arbitrary particles using the disector. J Microsc 1984; 134:127-36; PMID:6737468; http:// dx.doi.org/10.1111/j.1365-2818.1984.tb02501.x 8. Lucocq JM, Berger EG, Warren G. Mitotic Golgi
fragments in HeLa cells and their role in the reas-sembly pathway. J Cell Biol 1989; 109:463-74; PMID:2503521; http://dx.doi.org/10.1083/ jcb.109.2.463
9. Smythe E, Pypaert M, Lucocq J, Warren G. Formation of coated vesicles from coated pits in broken A431 cells. J Cell Biol 1989; 108:843-53; PMID:2564003; http://dx.doi.org/10.1083/jcb.108.3.843
10. Delesse A. Procede mechanique pour determines la composition des roches. Comptes Rendus Hebdomadaires des Sciences de L’Academie de Sciences 1847; 25:544-5
11. Gundersen HJ, Jensen EB. The efficiency of sys-tematic sampling in stereology and its prediction. J Microsc 1987; 147:229-63; PMID:3430576; http:// dx.doi.org/10.1111/j.1365-2818.1987.tb02837.x 12. Lucocq J. Can data provenance go the full monty?
Trends Cell Biol 2012; 22:229-30; PMID:22494708; http://dx.doi.org/10.1016/j.tcb.2012.03.001 13. Nyengaard JR, Gundersen HJG. The isector: a
simple and direct method for generating isotro-pic, uniform random sections from small speci-mens. J Microsc 1992; 165:427-31; http://dx.doi. org/10.1111/j.1365-2818.1992.tb01497.x
14. Howard CV, Reed MG. Unbiased Stereology. Three-Dimensional Measurement in Microscopy. 1998 Oxford: BIOS Scientific Publishers
15. Long JM, Mouton PR, Jucker M, Ingram DK. What counts in brain aging? Design-based stereological analysis of cell number. J Gerontol A Biol Sci Med Sci 1999; 54:B407-17; PMID:10568523; http://dx.doi. org/10.1093/gerona/54.10.B407
16. Griffiths G. Fine structure immunocytochemistry 1993; (Springer-Verlag, Heidelberg, Germany) 17. Hsia CC, Hyde DM, Ochs M, Weibel ER; ATS/ERS
Joint Task Force on Quantitative Assessment of Lung Structure. An official research policy statement of the American Thoracic Society/European Respiratory Society: standards for quantitative assessment of lung structure. Am J Respir Crit Care Med 2010; 181:394-418; PMID:20130146; http://dx.doi.org/10.1164/ rccm.200809-1522ST
18. Mühlfeld C, Nyengaard JR, Mayhew TM. A review of state-of-the-art stereology for better quantita-tive 3D morphology in cardiac research. Cardiovasc Pathol 2010; 19:65-82; PMID:19144544; http:// dx.doi.org/10.1016/j.carpath.2008.10.015 19. Nyengaard JR. Stereologic methods and their
appli-cation in kidney research. J Am Soc Nephrol 1999; 10:1100-23; PMID:10232698