THE ENVIRONMENTS IN WHICH STARS AND CIRCUMSTELLAR
DISCS FORM
Christopher John Poulton
A Thesis Submitted for the Degree of PhD
at the
University of St. Andrews
20089
Full metadata for this item is available in the St Andrews
Digital Research Repository
at:
https://research-repository.st-andrews.ac.uk/
Please use this identifier to cite or link to this item:
http://hdl.handle.net/10023/700
THE UNIVERSITY OF ST. ANDREWS
The Environments in which Stars and Circumstellar Discs
Form
Christopher John Poulton
Submitted for the degree of Ph.D.
DECLARATION
I, Christopher John Poulton, hereby certify that this thesis, which is approximately 40,000
words in length, has been written by me, that it is the record of work carried out by me
and that it has not been submitted in any previous application for a higher degree.
I was admitted as a research student in October 2004 and as a candidate for the degree of
PhD in October 2004; the higher study for which this is a record was carried out in the
University of St Andrews between 2004 and 2008.
Date: June 27, 2008 Signature of Candidate:
I hereby certify that the candidate has fulfilled the conditions of the Resolution and
Reg-ulations appropriate for the degree of PhD in the University of St Andrews and that the
candidate is qualified to submit this thesis in application for that degree.
Date: June 27, 2008 Signature of Supervisor:
The following is an agreed request by candidate and supervisor regarding the electronic
publication of this thesis:
Access to printed copy and electronic publication of thesis through the University
of St Andrews.
Date: June 27, 2008 Signature of Candidate:
ACKNOWLEDGMENTS
I would first like to thank my supervisor, Jane Greaves, for her excellent guidance
through-out my PhD, reading through and correcting my work and encouraging me to complete
tasks more quickly. I was also very fortunate to have Ian Bonnell as a second supervisor
whose enthusiasm and ideas helped make this thesis possible. I would also like to thank
Andrew Cameron for his invaluable assistance analysing the²Eridani data.
Special thanks to Tom Robitaille, for allowing the use of his SED fitter and for
teach-ing me new computer skills. I am also grateful to all of the people at the Spitzer helpdesk,
particularly David Makovoz, for answering many questions regarding point source
extrac-tion. Thank you also to Jonathan Williams and Mark Heyer for their feedback when
working on the Rosette paper and John Scalo and Tom Megeath for their inciteful
re-sponses to my emails.
I gratefully acknowledge PPARC/SciTech for financial support over the course of
my PhD.
Thank you to all of my fellow PhD students, especially Garry Angus for making
life in the astronomy department more interesting and entertaining. I also thank my first
office mates Paul Clark and Clare Dobbs for helping me in the early days with computer
problems.
I would like to thank my parents, who have always shown interest in my studies, for
encouraging me to pursue a PhD in the first place. Finally, I would like thank my girlfriend
Emily who has been a source of great support throughout my PhD and for making me
PREFACE
Chapters 3 and 4 of this thesis are based on the first author papers listed below.
[1] Poulton, C.J., Greaves, J.S., Cameron, A.C.
2006, MNRAS, 372, 53
[2] Poulton, C.J., Robitaille, T.P., Greaves, J.S., Bonnell, I.A., Williams, J.P., Heyer, M.H.
THE UNIVERSITY OF ST. ANDREWS
The Environments in which Stars and Circumstellar Discs Form
Submitted for the degree of Ph.D.
June 27, 2008
Christopher John Poulton
ABSTRACT
In this thesis, images of a debris disc are used to examine the evidence for the presence of
a Neptune-like planet around²Eridani and detections of protoplanetary discs are used to
investigate the evidence for star and future planet formation.
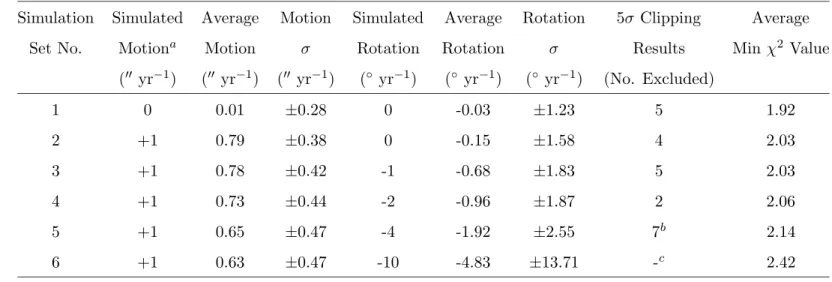
A χ2 analysis of the movement of clumps in the ² Eridani debris disc is presented
using 850 µm SCUBA data taken over a 4 year period and compared with results from
simulated data. A rotation is detected at the 2σ level and is faster than the Keplerian
rate, consistent with theoretical models in which dust trapped in mean motion resonances
tracks a planet orbiting the star at ≈26 AU. Future observations that could be taken
with SCUBA-2 are also simulated and demonstrate that the true rotation rate cannot be recovered without the identification of the background sources aligned with the clumpy debris disc.
Near and mid infrared observations are used to perform a survey of YSOs in the Rosette Molecular Cloud. Although triggering by compression of the molecular cloud by the expanding HII region at the centre of the Rosette Nebula is a possible origin for some of the recent star formation, the majority of the active star formation is occurring in already dense regions of the cloud not compressed by the expansion of the HII region.
Mid-infrared data for W4 and SCUBA data for the star forming region AFGL 333 are also presented. A survey of YSOs reveals that whilst some young sources are coincident with the W4 loop, consistent with a scenario of triggered star formation in a swept-up shell, several young sources are found to be forming outside of this ring. The dust temperature and mass of AFGL 333 are estimated and the result implies a star formation efficiency of
CONTENTS
Declaration i
Acknowledgments ii
Preface iii
Abstract iv
1 Introduction 1
1.1 Debris Discs . . . 1
1.1.1 Submillimetre Images of Debris Discs . . . 2
1.1.2 Relative Sizes and Masses of the Discs . . . 7
1.1.3 Origin and Composition of Grains in the Disc . . . 9
1.1.4 Clearing of the Central Cavity . . . 11
1.1.5 Evidence for Planets . . . 13
1.1.6 Summary . . . 15
1.2 Star Formation . . . 16
1.2.1 Fundamental Concepts . . . 16
1.2.2 Observational signatures of star formation . . . 21
1.2.4 Disc Survival in Star Forming Regions & Implications for the
For-mation of Planetary Systems . . . 28
1.3 Outline of Thesis . . . 29
2 Methods 31 2.1 Observing at Infrared and Sub-millimetre Wavelengths . . . 31
2.2 Spitzer Data Reduction . . . 32
2.2.1 IRAC . . . 32
2.2.2 MIPS . . . 37
2.3 Background Matching (Overlap Correction) . . . 37
2.4 Mosaicking . . . 38
2.5 Point Source Extraction . . . 41
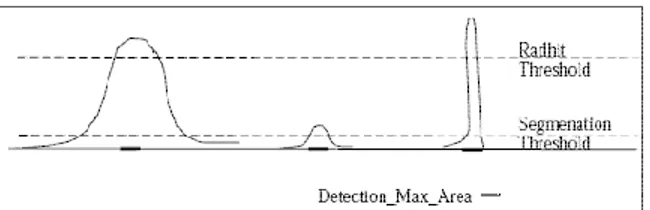
2.5.1 Background Estimation . . . 41
2.5.2 Point Source Detection . . . 42
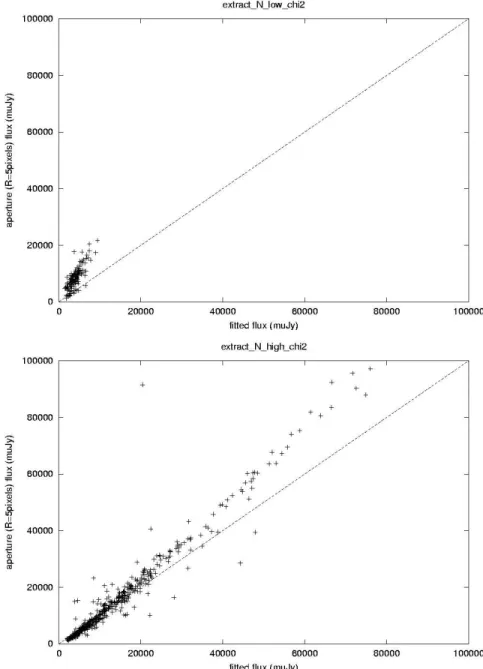
2.6 Point Source Photometry . . . 43
2.6.1 PRF Fitting . . . 43
2.6.2 Aperture Photometry . . . 44
2.7 SCUBA Data Reduction . . . 48
2.7.1 Instrument Description . . . 51
2.7.2 Sky Removal - Chopping . . . 51
2.7.3 Data Reduction Steps . . . 52
2.7.4 Source Extraction . . . 53
3.2 Introduction . . . 55
3.2.1 ²Eridani: A Special Case . . . 55
3.2.2 Planet Hunting by Tracking of Disc Features . . . 56
3.3 Observations . . . 57
3.4 Simulated Data . . . 57
3.4.1 Simulation details . . . 59
3.4.2 Simulation output . . . 62
3.5 Clumpfind . . . 62
3.6 Detecting a Rotation . . . 67
3.7 Results and Discussion . . . 68
3.7.1 Motion of the Disc . . . 68
3.7.2 Rotation of the Disc . . . 72
3.7.3 Future Observations . . . 73
3.8 Conclusions . . . 76
4 A Survey of Young Stellar Objects in the Rosette Molecular Cloud 77 4.1 Abstract . . . 77
4.2 Introduction . . . 78
4.2.1 The Collect and Collapse Model . . . 78
4.2.2 The RMC as an example of triggered star formation. . . 80
4.2.3 Fitting to model SEDs . . . 80
4.3 Observations and Data Reduction . . . 82
4.3.1 IRAC . . . 82
4.4 Point Source Extraction and Bandmerging . . . 83
4.5 Identification and Classification of YSOs . . . 84
4.5.1 SED Fitting . . . 89
4.5.2 Limitations of the Survey . . . 95
4.6 Spatial Distribution of Protostars . . . 96
4.6.1 Local Stellar Densities . . . 96
4.6.2 Nearest Neighbour Distribution . . . 101
4.6.3 Two Point Correlation Function . . . 104
4.7 Evidence for Triggering . . . 104
4.8 Summary . . . 108
5 A Survey of IR Excess Sources in the W4 Loop 110 5.1 Abstract . . . 110
5.2 Introduction . . . 110
5.3 Observations and Data Reduction . . . 114
5.3.1 MIPS . . . 114
5.3.2 SCUBA . . . 114
5.3.3 Archived Data (2MASS & IRIS) . . . 115
5.4 Point Source Extraction and Bandmerging . . . 115
5.5 Identification and Classification of YSOs . . . 121
5.5.1 Limitations of the Survey . . . 126
5.6 Spatial Distribution of IR Excess Sources . . . 127
5.7 Star Formation Efficiency in the W4 Loop . . . 133
5.9 Summary . . . 143
6 Conclusions and Future Work 145
6.1 Conclusions . . . 145
6.1.1 Survival of Discs in Star Forming Regions . . . 145
6.1.2 Tracking Features of the²Eri Debris Disc . . . 147
6.1.3 Protoplanetary Discs - Investigating Possible Triggered Star Formation150
6.2 Future Work . . . 152
6.2.1 Recovering a Rotation Rate . . . 152
6.2.2 Improved Observations - Towards a More Complete Survey of YSOs 153
CHAPTER 1
Introduction
One of the most intriguing questions in science is whether or not life is unique to Earth
or ubiquitous throughout the whole universe. An important part of solving this puzzle
is to determine the abundance of Earth-like planets and planetary systems like the solar
system. It is in tackling this problem where the study of circumstellar discs plays an
important role. Protoplanetary discs exist only around young stars that have formed very
recently and are formed from the same primordial material as the star. Therefore, by
identifying stars with protoplanetary discs, the environments in which they are formed
can be examined to determine how long the disc typically survives, setting the timescale
for the formation of planetary systems. Debris discs are formed at a later stage in a star’s
life and are formed by the continual replenishment of dust in the disc by collisions between
planetesimals that have formed from the protoplanetary discs. The detection of a debris
disc around a star infers the presence of orbiting bodies that collide to replenish the dust
in the disc, indicative of a planetary system. This chapter describes the background and
theory used later: for debris discs in section 1.1 and star formation in section 1.2.
1.1 Debris Discs
In 1983, data from the Infrared Astronomical Satellite (IRAS) revealed an unexpected
far-infrared excess beyond 12 µm during routine calibration observations of Vega. More
specifically, the radiation detected at wavelengths 25µm to 100 µm is more than can be
produced by the photosphere of the star. This was later interpreted as thermal radiation
from particles with radii larger than 1 mm, heated by radiation from the star to
solid particles around main sequence stars outside of our solar system without significant
mass loss (i.e. not giants).
Following the initial discovery, excess emission was detected from a number of other
stars in the far infrared (Aumann, 1985; Mannings & Barlow, 1998), and later at
sub-millimetre (Zuckerman & Becklin, 1993) and mid infrared (Fajardo-Acosta et al., 1998)
wavelengths. Only a small number of objects have been resolved in optical, near-infrared
and far-infrared wavelengths, e.g. Smith & Terrile (1984) were able to image a disc around
β Pictoris in the infrared, from the starlight scattered off the dust using coronagraphs.
The difficulty came about because the radiation from the star being observed dominated
the faint radiation scattered by the dust (Kalas & Jewitt, 1996). In 1997, the
Submil-limetre Common-User Bolometer Array (SCUBA) on the James Clerk Maxwell Telescope
(JCMT) came into operation, and until 2005 was used to image the warm dust around
β Pictoris, Fomalhaut, Vega (Holland et al., 1998) and η-Corvi (Wyatt et al., 2005), the
sunlike stars ² Eridani (Greaves et al., 1998, 2005), HD 107146 (Williams et al., 2004),
andτ Ceti (Greaves et al., 2004b) and the images obtained are discussed below.
1.1.1 Submillimetre Images of Debris Discs
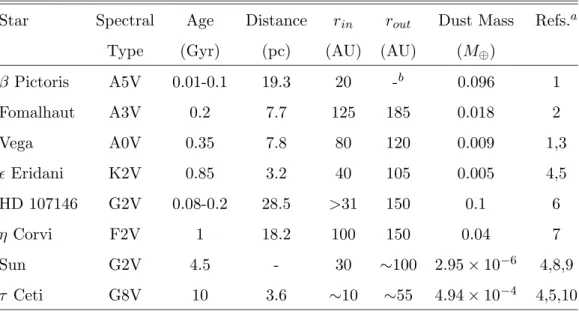
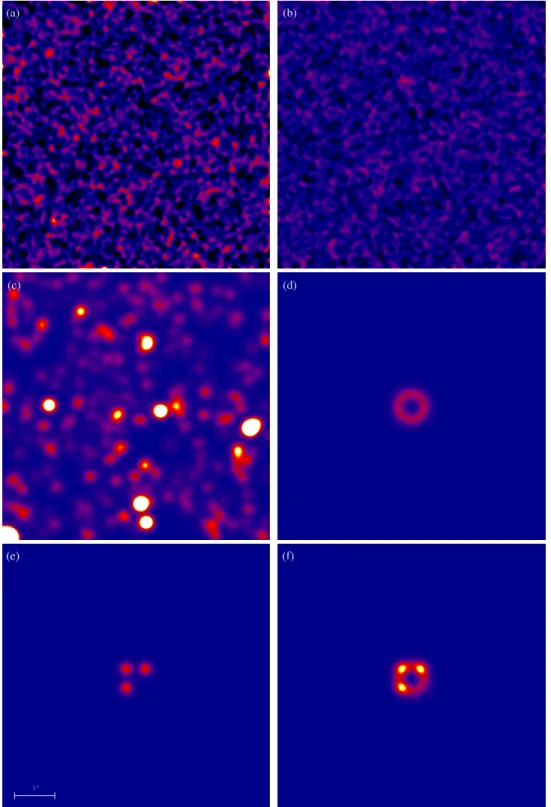
Figure 1.1 shows the debris discs observed at 850µm using SCUBA that are at distances
smaller than 30 pc with their stellar disc parameters shown in Table 1.1. An important
consideration when attempting to observe the debris discs at submillimetre wavelengths
is that the observed radiation could originate from a background source such as a distant
galaxy. Holland et al. (1998) estimate that there is a probability of 2.5% of finding a
background galaxy within 10 arcsecs of the star and the counts agree within a factor of
∼2 with previous surveys (Smail et al., 1997). Features physically associated with the
star should track with the proper motion of the star about which they are observed.
Observations of ² Eridani by Greaves et al. (1998, 2005) span a period of 5 years and
therefore the proper motion of the disc over this timescale should be observable. Some
features thought to be part of the disc in 1998 now appear to be stationary with respect
to the sky and it therefore looks as though these must be background objects such as
dusty galaxies. The debris discs around Fomalhaut,β Pictoris, Vega,²Eridani andτ Ceti
are now discussed in more detail as examples of what can be deduced from submillimetre
Figure 1.1: Submillimetre (850µm) images of debris discs observed using SCUBA around
(a)β Pictoris (Holland et al., 1998), (b) Fomalhaut (Holland et al., 1998), (c) Vega
(Hol-land et al., 1998), (d)η-Corvi (Wyatt et al., 2005), (e) ²Eridani (Greaves et al., 2005),
Table 1.1: Stellar and disc parameters of the stars imaged at submillimetre
wave-lengths.
Star Spectral Age Distance rin rout Dust Mass Refs.a
Type (Gyr) (pc) (AU) (AU) (M⊕)
β Pictoris A5V 0.01-0.1 19.3 20 -b 0.096 1
Fomalhaut A3V 0.2 7.7 125 185 0.018 2
Vega A0V 0.35 7.8 80 120 0.009 1,3
²Eridani K2V 0.85 3.2 40 105 0.005 4,5
HD 107146 G2V 0.08-0.2 28.5 >31 150 0.1 6
η Corvi F2V 1 18.2 100 150 0.04 7
Sun G2V 4.5 - 30 ∼100 2.95×10⁻⁶ 4,8,9
τ Ceti G8V 10 3.6 ∼10 ∼55 4.94×10⁻⁴ 4,5,10
aReferences: 1 - Dent et al. (2000); 2 - Holland et al. (2003); 3 - Holland et al. (1998); 4 - Greaves
et al. (2005); 5 Di Folco et al. (2004); 6 Williams et al. (2004); 7 Wyatt et al. (2005); 8
-Backman et al. (1995); 9 - Landgraf et al. (2002); 10 - Greaves et al. (2004b)
bNo observed outer boundary
A-type Stars: Fomalhaut, β Pictoris and Vega
The submillimetre image of Fomalhaut obtained by Holland et al. (1998) using SCUBA
shows that the dust emission peaks at two regions about 10 arc-seconds north and south
of the star. Holland et al. (1998) proposed that this is consistent with a torus of dust
with a central cavity about 60 AU in diameter, viewed at an inclination angle of 64±5◦
(an inclination of 0◦ indicates that the disc is orientated with its spin axis along the line
of sight). Subsequent fits to spectral energy distributions (SEDs) and the submillimetre
image obtained by Holland et al. (1998) implied the Fomalhaut submillimetre emission
could be modelled as a 120 AU thick torus viewed edge-on (inclination>75◦), with inner
radius of 100 AU and an abrupt outer boundary of 140 AU (Dent et al., 2000). These
figures have been re-calculated by Holland et al. (2003) and are shown in Table 1.1. Dent
et al. (2000) compared the SEDs for models of the torus with differing densities in the
inner cavity and found that the density in the cavity must be no more than 10% of that
in the torus. The incination angle implied is consistent with the comparison between the
same spectral type (Backman & Paresce, 1993). The regions of peak dust emission at
∼1000 from the star correspond to distances of about 80 AU from the star (Holland et al.,
1998). This is slightly larger than the distance of the Kuiper Belt from the Sun (Backman
et al., 1995). More recently, a 450µm image of the Fomalhaut disc has been obtained with
SCUBA at the JCMT (Holland et al., 2003). The image shows that the disc is significantly
asymmetric and the implications of this are discussed later in this chapter.
The image of β Pictoris shows that the dust extends out to distances of 250 AU
from the star and that the measured major and minor axes of the observed ellipse imply a
disc inclined at angle of>60◦ (Holland et al., 1998). Dent et al. (2000) were able to show
that the optical and near-infrared models used to account for the extended structure (i.e.
no outer edge) seen in the scattered light of β Pictoris (Kalas & Jewitt, 1996) were also
adequate to model the submillimetre image and SED, requiring an average grain size of
10 µm to fit the observed SED at longer wavelengths. The IRAS SED also implies the
existence of a central cavity with a radius of approximately 30 AU (Backman & Paresce,
1993), although this is not observable in the submillimetre images with the resolution of
the JCMT. Further submillimetre imaging of the β Pictoris disc confirmed the detection
of a second region of emission∼30 arc-seconds SW of the star (Dent et al., 2000). Holland
et al. (1998) propose that this is either a fragmented part of the disc or possibly a second
disc around a low-mass companion constrained to be<10 MJup . Dent et al. (2000) note
that if this region was heated by β Pictoris then the dust mass would need to be 1.2
Mlunar, comparable to the mass of the primary disc, and this is unlikely as the feature
does not appear in deep optical images. As discussed above, it is possible that this second
region of emission is a background galaxy but it would be one of the brightest observed.
The higher contours in the image of Vega, show that it bears a resemblance to
Fomalhaut in that it exhibits an elongated structure (Holland et al., 1998; Dent et al.,
2000). Unlike Fomalhaut and β Pictoris, the lower contour levels of the Vega image
show that the observed emission is roughly circular implying that the disc is being viewed
close to face-on (Holland et al., 1998). Holland et al. (1998) also point out that the low
observed rotation velocity of the star (Backman & Paresce, 1993) and optical spectroscopic
observations of Vega (Gulliver et al., 1994) provide evidence that the star is also being
observed at a low inclination angle. Also, the fact that the emission NE of the star is
significantly brighter than the region SW of the star cannot be explained by simple
explanation (Dent et al., 2000). It is possible that a collision between two large bodies
could have produced the dust observed (Holland et al., 1998), although dust created in this
way is generally only expected to be observable for a few Myr due to collisional grinding
(Wyatt & Dent, 2002). Dent et al. (2000) showed that the observed SED can be modelled
by an isothermal modified black body and this suggests that the dust lies in a radially-thin
ring and also implies that there is a limited range of grain sizes around Vega.
Sun-like Stars: ²Eridani and τ Ceti
Fomalhaut, β Pictoris and Vega are all A-type stars with ages<1 Gyr. Their ages span
the equivalent to the “heavy bombardment” phase of the solar system, thought to have
occurred up to∼700 Myr after the Sun’s formation (Greaves et al., 2005). However, their
relatively short lifetimes (∼1 Gyr) mean that any planets that formed will be short lived
and that formation of life is unlikely to have taken place on these worlds. To gain a better
understanding of how typical the solar system is, by comparison of the Kuiper Belt to the
discs that surround other stars, a study of Sun-like stars is more relevant. The only nearby
(within 5pc) single stars of similar spectral type to the Sun (G2V) areτ Ceti (G8V) and
²Eridani (K2V). Studies of these discs are of particular interest since²Eridani at an age of
0.85 Gyr represents an analogue to the young solar system (“heavy bombardment” phase)
and τ Ceti at an age of approximately 10 Gyr; an analogue to the future solar system.
In the case of ² Eridani, a planet has been detected using radial velocity techniques by
Hatzes et al. (2000).
Images of ² Eridani obtained using SCUBA (Greaves et al., 1998, 2005), show a
ring of dust around the star with the emission peaking at a distance of around 65 AU
and an outer edge at 105 AU. The best model fitted by Dent et al. (2000) to the SED
and submillimetre image has a ring of dust 50-80 AU from the star, consistent with the
observations of Greaves et al. (1998). The ratio of flux densities between the faint emission
in the central cavity and the peak emission measured in the ring is approximately 2. The
model (Dent et al., 2000) includes a central region with a dust density about 10% of that in
the ring (radius>50 AU) in order to fit the SED and submillimetre image. Measurement
of the minor and major axes of the disc indicates that the spin axis is inclined at an
angle of 25±3◦ (Greaves et al., 2005) i.e. close to a pole-on orientation. Perhaps the most
the disc. As examined later in Chapter 3, this indicates that there may be an additional
planet with a larger orbit than the one already discovered by radial-velocity techniques
(Hatzes et al., 2000).
An 850 µm image of τ Ceti was obtained recently by Greaves et al. (2004b) using
SCUBA at the JCMT. The image shows a region of emission around the star that appears
symmetrical, orientated roughly N-S about the star. Greaves et al. (2004b) argue that the
observed emission is unlikely to be from a distant background source since it is unlikely
that a background object would be elongated symmetrically about the star. Measurement
of the major and minor axes imply a close to edge on inclination angle of 60-90◦, however
it should be noted that the minor axis is not resolved (Greaves et al., 2004b). This did not
agree with the stellar rotation velocity which implied a stellar inclination angle of 0-40◦(Di
Folco et al., 2004; Saar & Osten, 1997). Therefore, either the error in the stellar rotational
velocities could be larger than estimated or the features observed could be evidence of
non-uniform features present in the disc, similar to those observed in the Vega images
(Holland et al., 1998). However, a more recent measurement by Valenti & Fischer (2005)
gives a value of 1.3 km/s for vsini, implying an inclination angle for the star consistent
with that determined from the disc. Since τ Ceti is a cooler star of spectral type G8V,
imaging of these features will prove more difficult than the Vega case. The spectral energy
distribution of the excess emission can be modelled by dust at a temperature of 60 K
(Greaves et al., 2004b). Like the Vega case (Dent et al., 2000), a single temperature fit is
evidence that the dust lies in a ring rather than a complete disc and that there is only a
limited range of grain sizes.
1.1.2 Relative Sizes and Masses of the Discs
Data on both the stellar and disc parameters are shown in Table 1.1. The dust masses
are typically a few Mlunar or less and this implies that any planet formation is complete
in these systems (Dent et al., 2000). This is consistent with current planet formation
theories in which the latter stages of terrestrial planet formation are expected to occur
107-108years after the formation of the star (Chambers, 2004). Giant planets are expected
to have formed within 107yr based on core accretion models of planet formation (Hubickyj
et al., 2005). The inner radii of the discs are generally slightly larger than the inner radius
review the observable dust is now thought to originate from a collisional cascade (Wyatt
& Dent, 2002). Since large bodies would not contribute to the observed flux the dust mass
only represents a small fraction of the total disc mass. Collisional lifetime arguments can
be used to estimate the total mass of the disc (Wyatt & Dent, 2002). Generally, there is a
decline of dust mass with time (Rieke et al., 2005), but Habing et al. (2001) note that not
all young stars have a disc and not all old stars have lost theirs, e.g. τ Ceti. A comparison
between the dust mass in the solar system and around the stars² Eridani and τ Ceti is
most interesting since these stars are of spectral type similar to the Sun.
The dust mass estimate for the τ Ceti disc is around 5% that of the ² Eridani
disc and this is in agreement with models suggested by Kenyon & Bromley (2004) and
Spangler et al. (2001) that the dust mass decreases sharply with time (t−1 to t−2). In
order to fit the decline of dust mass with time, the solar system, at its age of 4.5 Gyr,
would have to contain a dust mass of at least 10−4 M⊕, but curiously this is two orders
of magitude higher than estimates for the dust mass in the Kuiper Belt (Fixsen & Dwek,
2002; Landgraf et al., 2002). In addition to this, a lower comet population implies a lower
collision rate and therefore less dust mass in the disc and the mass of comets in the Kuiper
Belt is an order of magnitude less than that estimated for theτ Ceti collisional cascade.
There are two theories that attempt to explain why the Kuiper Belt has less mass
than that estimated for the τ Ceti disc. The first postulates that the density of the
Kuiper Belt is already mysteriously low if the density of the protoplanetary disc out of
which the planets are thought to have formed is extrapolated out to approximately 50
AU (Morbidelli et al., 2003). It is possible a close stellar encounter could be responsible
for ejecting many of the original comets but this type of event is reasonably rare. The
second theory proposes that the region in which the Kuiper Belt now resides may have
originally been unpopulated and became populated by bodies pushed outwards by the
migration of Neptune. Slower and smoother migration increases the population pushed
outside of a migrating planet. In the case of τ Ceti it may simply be the case that a
Neptune-like planet had slower and smoother migration than that which occurred in our
own solar system or that the initial number of bodies outside the orbit of the planet was
greater. However, this second theory requires the initial protoplanetary discs to be less
than 50 AU and this is not observed in the ² Eridani disc which extends out to 105 AU
1.1.3 Origin and Composition of Grains in the Disc
After the original discovery of the far-infrared excess from Vega, Aumann et al. (1984)
concluded that the particles emitting the radiation must be a remnant of the
protoplane-tary disc from which Vega formed. This was because there was no evidence of any mass
loss from Vega and particles from the interstellar medium, regions of current star
for-mation and circumstellar dust grains are small enough (radii < 9 µm) to be ejected by
radiation blowout. Furthermore, particles could be removed via Poynting-Robertson drag.
In this process, photons from the star preferentially strike the leading side of the grain
and the radiaton absorbed is re-radiated in all directions, eventually slowing the
parti-cle down enough that it will spiral into the star (Backman & Paresce, 1993). Partiparti-cles
with radii<12 cm would spiral into the star on timescales of the order of the lifetime of
Vega. Therefore, Aumann et al. (1984) argued that the particles that remained in the disc
must be larger than 120 mm in diameter and probably grew from material in the initial
protoplanetary disc.
However, the collisional timescales for grains in debris discs are generally much
shorter than the timescales for removal by the Poynting-Robertson effect (Dent et al.,
2000; Wyatt, 2005). The velocities of the grains in the disc are such that the collisions
are destructive rather than lead to growth of particles (Backman & Paresce, 1993; Wyatt
& Dent, 2002). Most of the resulting fragments from the collisions are small enough to be
ejected from the disc by radiation pressure from the star (Backman & Paresce, 1993). Dent
et al. (2000) suggest that the dust is likely to be continually replenished by a collisional
cascade, in which large bodies are ground down to ever smaller sizes through a series of
collisions. A debris disc is observable because of the large quantities of small grains created
from this collisonal cascade which give a larger surface area from which radiation can be
emitted (Wyatt & Dent, 2002). The dust can be replenished as long as there is a reservoir
of parent bodies present in the disc to initiate the cascade (Wyatt & Dent, 2002).
The spectral energy distribution is characterised by the spatial distribution, size
dis-tribution and composition of the grains (optical properties) that reside in the disc (Wyatt
& Dent, 2002). Therefore SED modelling can yield information about the properties of
the dust in a debris disc and Fomalhaut has been the most studied disc in this respect
The spatial distibution of the dust and modelling of the Fomalhaut disc’s SED by
Wyatt & Dent (2002) was able to constrain the size distribution and this was inferred
to be consistent with a disc in collisional equilibrium. A similar analysis was not able
to accurately determine the composition of the grains, although the best fit was for
non-porous grains similar to the core-mantle model developed by Li & Greenberg (1997) for
interstellar grains. This model assumes that the dust grains consist (by volume) of 1/3
aggregate silicate core and 2/3 organic refractory mantle of UV photoprocessed ices that
accreted on to the core in the interstellar medium. Sheret et al. (2004) used the
core-mantle model to remodel debris discs SEDs and found that while Vega and Fomalhaut
required solid dust grains to model their SEDs, other stars (HR 4796 and HD 141159)
could only have their SEDs fit using porous grains. Sheret et al. (2004) also found that
older stars tended to have less porous grains than younger stars and suggested that this
may indicate that collisions in the discs may have reprocessed the grains into a more solid
form.
An initial study using 850 µm data used a single grain size of 100 µm at a
tem-perature of 45 K to model the SED of Fomalhaut’s disc (Dent et al., 2000), although it
was already known that a variety of grain sizes was needed to fully model the SED of
Fomalhaut (Zuckerman & Becklin, 1993). More recent and detailed SED modelling has
shown that Fomalhaut’s disc grain size distribution is consistent with a collisional cascade
with bodies ranging in size from 7µm to 0.2 m in diameter (Holland et al., 1998; Wyatt &
Dent, 2002). The upper limit of 0.2 m corresponds to the maximum diameter grains that
contribute to the 850µm flux and below diameters of 7 µm, particles are expected to be
blown out of the system by radiation pressure (Wyatt & Dent, 2002). The temperature
of grains is dependent on the location in the system (i.e. the distance from the star) and
also the grain size; smaller grains will be warmer than larger grains at the same location
(Holland et al., 2003). Collisional lifetime arguments also imply that the material now
observed originated from a cascade initiated by the break-up of planetesimals up to 4 km
in diameter implying a total disc mass of 20-30 M⊕ (Wyatt & Dent, 2002).
The SEDs of the debris discs around Fomalhaut, Vega, β Pictoris and ² Eridani
were modelled using a single grain size by Dent et al. (2000) and found to have grain
sizes 10-100µm, opacity indices (a measure of how efficiently the grains re-emit absorbed
radiation) between 0.8 and 1.1 and temperatures of 35 to 80 K. Dent et al. (2000) also
(2004b) showed that forτ Ceti, the 60 to 850µm SED could be fit with grains of a similar
temperature of 60 K and an opacity index 0.5, slightly lower than those inferred by Dent
et al. (2000). Opacity indices close to zero imply the presence of grains that are closer to
blackbodies and much larger than interstellar grains (Greaves et al., 2004b).
1.1.4 Clearing of the Central Cavity
All of the discs discussed in this review exhibit evidence of a central cavity with radii
ranging between 20 and 100 AU (Dent et al., 2000). In the case of Vega andτ Ceti this is
inferred from the results of modelling the SEDs (Dent et al., 2000; Greaves et al., 2004b).
This is because a single temperature fit means the dusty debris must only lie within a
particular range of radii from the star and so forms a ring structure around the star with
a distinct inner and outer edge. In the case of Fomalhaut (Holland et al., 2003) and ²
Eridani (Greaves et al., 2005) the presence of the cavities can also (in addition to SED
modelling) be clearly seen in the submillimetre images as regions where the radiation is
significantly fainter than the peak radiation in the disc. Evidence for a central cavity in
theβ Pictoris disc, has been obtained from the IRAS SEDs (Backman & Paresce, 1993)
and further modelling of the SED by Dent et al. (2000) shows thatβ Pictoris must have a
radially extended disc with a power-law density distribution and therefore is the only disc
to have no distinct outer edge.
Radiation pressure, Poynting-Robertson drag, grain mantle sublimation, grain
col-lisions and interactions with a larger body are all mechanisms capable of removing grains
from the inner radii of a debris disc (Dominik & Decin, 2003). These are each discussed
in the paragraphs below.
A “blowout” size can be determined for each star, representing the minimum size
of grains released at rest that are stable against ejection by the radiation pressure from
the star (Backman & Paresce, 1993). Burns et al. (1979) showed that grains are not
easily removed in the case of the solar system. More generally, radiation blowout is only
considered important for removing small grains (less than a fewµm in size) around high
luminosity stars (Backman & Paresce, 1993). Even then, it cannot produce the abrupt
inner boundary observed in the debris discs (Dent et al., 2000).
radia-tion pressure blowout to spiral in towards the star (Backman & Paresce, 1993). However,
the timescales on which this process occurs are much larger than the age of the star in the
cases of Fomalhaut and² Eridani. For the case of ² Eridani, particles with diameters of
approximately 1 mm would only be cleared out to a radius of about 15 AU (Jura, 1990)
in around 1 Gyr and so cannot explain the clearing out to∼35 AU (Greaves et al., 1998).
Also, P-R drag would produce a 1/r density distribution if it was the dominant mechanism
resonsible for grain removal and this is not observed (Dent et al., 2000).
Sublimation of the icy grain mantles could produce an abrupt inner boundary but
ice sublimation is a very strong function of temperature (Backman & Paresce, 1993) and is
only really important for T>∼100 K (Moro-Mart´ın & Malhotra, 2002). The debris discs
observed are generally too cold for this to be the dominant process (Dent et al., 2000).
Melting of the mantles requires even greater temperatures of∼170 K and this “snow-line”
occurs at 2.7 AU for Sun-like stars and at even smaller distances for dusty protoplanetary
discs (Sasselov & Lecar, 2000). For example,²Eridani has a luminosity of about 0.33 L¯
(Soderblom & Dappen, 1989) and since the gas giants in the solar system are expected to
have formed around icy cores, ice mantles would be expected to persist to within a few
AU of the star (Greaves et al., 1998). Dent et al. (2000) also note that there is too much
variation between the temperatures of each disc for grain sublimation to be the primary
process for removing grains.
The central cavity was previously thought to be cleared due to the growth of
par-ticles into larger bodies (Aumann et al., 1984; Greaves et al., 1998), since smaller grains
would be removed by radiation blowout and P-R drag and larger bodies would emit less
radiation per unit mass than smaller grains. However, timescales for grain-grain collisions
are significantly smaller than those for the P-R effect and therefore collisions dominate the
grain removal process (Dent et al., 2000). Since the collision timescales are so short, and
the shattered grains will be removed by radiation blowout or P-R drag then the grains
must be replenished by a collisional cascade (Wyatt & Dent, 2002). Dent et al. (2000)
propose that there is a critical grain size (approx. a few mm in all cases) which survives
for the lifetime of the star and can then act as a reservoir of larger grains that replenishes
any grains removed from the disc via a collisional cascade.
It was expected that a planet could contribute to the clearing of a central cavity
(2000) argued that a massive body sweeping up the grains at the inner radius of the ring
is the most convincing explanation for the presence of the central cavity. Roques et al.
(1994) found from numerical situations that a planet of∼5M⊕at the inner edge of the ring
can prevent the inward migration of dust slowed by Poynting-Robertson drag and create
a stable central cavity and an abrupt outer edge. Later work by Wyatt (2005) showed
that P-R drag is an insignificant process because collisions between planetesimals occur
on much shorter timescales and result in the planetesimals being ground into dust which
is fine enough to be removed by radiation pressure before P-R drag has a chance to act.
1.1.5 Evidence for Planets
Non Uniformity of the Ring
Dent et al. (2000) note that the Vega and ² Eridani discs have observable bright spots
which can be interpreted as dust density enhancements. Dent et al. (2000) also state that
for Fomalhaut andβ Pictoris such “clumps” would be hard to observe since the discs are
observed edge-on. However, more recent observations of Fomalhaut at 350 µm (Marsh
et al., 2005), and 450 µm and 850 µm (Holland et al., 2003) have shown that the disc is
not axi-symmetric and there is at least one “clump” or arc emitting∼5% of the total flux
of the disc. The most obvious non-uniformity observed thus far is that of the ² Eridani
disc for which there is also a new 450 µm image (Greaves et al., 2005). As discussed
previously, the 5 year dataset at 850µm has shown that some of the features previously
observed in the disc are stationary with respect to the sky and are therefore unlikely to
be physically associated with the star.
A study of collisonal processes in the disc by Wyatt & Dent (2002) showed that
a collision between two runaway planetesimals (>1400 km in diameter) could produce
enough dust to account for the observed clump in Fomalhaut’s disc. However, for the dust
to still be observable the ignition of the collisional cascade would have had to occur in
the last few Myr (Wyatt & Dent, 2002). Wyatt & Dent (2002) note that this estimate
is limited by uncertainties in both the frequencies and the outcomes of collisions between
runaway planetesimals and does not rule out a collisional origin for some of the bright
spots observed in other debris discs.
Fomalhaut ring are caught in a 1:2 gravitational resonance with a planet migrating
out-wards (Wyatt & Dent, 2002). Numerical simulations by Roques et al. (1994) showed that
dust could be trapped in outer mean motion resonances on timescales comparable with
the P-R drag lifetimes of the grains. Dent et al. (2000) note that this provides a credible
explanation for the density enhancements seen in the Vega and ²Eridani rings. Greaves
et al. (2005) also argue that for the ² Eridani case the only convincing explanation for
the ring’s sub-structure is gravitational perturbation by a second planet at tens of AU
from the star. However, this was based on the models of Ozernoy et al. (2000); Quillen &
Thorndike (2002) which require inwardly migrating dust slowed by P-R drag to get caught
in the planet’s resonances which as discussed earlier may be removed from the system by
the action of collisions and radiation pressure. An alternative explanation, presented by
Wyatt et al. (2003), is that the dust can also be trapped in resonances when a planet
migrates outwards. Dust trapped in a resonance would orbit the star with the planet
and should be observable on a timescale of a few years (Wyatt & Dent, 2002). Greaves
et al. (2005) also tentatively suggest a counter-clockwise rotation of the ²Eridani disc of
1 degree per year, although recognising that a higher resolution image or extended period
of observation may be required to prove the rotation (only a 5 year dataset so far) and
this is examined in more detail in Chapter 3.
Searches for Debris Discs around Stars with Planet Detections
Greaves et al. (2004a) performed a survey of stars, searching for debris discs around stars
with known giant planets, discovered using radial-velocity techniques. No more debris discs
were observed and this implied that the stars included in the survey did not have debris
discs with dust masses larger than 0.02 M⊕. At the time, an inverse survey of stars with
known debris discs showed that only²Eridani had a planet detection by the radial-velocity
method. However, very few of the stars observed in this survey had mid-infrared excesses
and this implied the existence of central cavities in the discs. As discussed previously, it
has been argued that the central cavities are cleared by planets (Roques et al., 1994) at
orbits of 5 to 40 AU that are not detectable by current radial-velocity techniques and so it
appeared that there may be two groups of stars with different planet locations. However,
Wyatt (2005) showed that planetesimals in the disc can be ground into dust and removed
Spitzer surveys have also revealed more stars with both detectable planets and debris
discs (Beichman et al., 2005).
If two groups of stars with different planet locations do indeed exist, Greaves et al.
(2004a) proposed that these systems evolved very differently because the time-scales in
which planets form vary in each system. Whilst many properties of the initial disc will
affect the timescale on which planets form, the most important factor is the initial disc
mass, to which the timescale is inversely proportional (Kenyon & Bromley, 2002). In
addition, observations have shown that initial disc mass may vary by as much as two
orders of magnitude (Wyatt et al., 2003). In low mass discs, the planetary cores would
grow more slowly and would not have accreted much gas by the time the gas in the disc
had dispersed, around 10 Myr after the formation of the star (Bary et al., 2003; Thi
et al., 2001). These partially formed planets will then migrate to larger orbits via angular
momentum exchange with smaller planetesimals on larger orbits. Conversely, high mass
discs allow gas giants to form rapidly and these will migrate inwards because the disc
will remain gas-rich for the first few Myr (Nelson et al., 2000). In the inward migrating
systems the outer planetesimals will also form relatively quickly and through collisional
grinding will not be visible soon after the star has formed due to drag forces removing the
dust (Dent et al., 2000). However, for the outward migrating systems, Liou & Zook (1999)
showed that the systems could evolve to have planets on large orbits that clear central
cavities in the disc. This explanation can also account for the non-uniformity of some of
the debris discs observed (Wyatt et al., 2003).
1.1.6 Summary
Habing et al. (2001) found the incidence of debris discs around stars relatively close to our
Sun to be∼17%, using 60µm data from ISO and Bryden et al. (2006); Trilling et al. (2008)
found a similar value for a sample of sun-like stars (16%). The most striking features of
the debris discs observed are the cleared central cavities that seem to be common to all the
discs and the sub-structure observed in some of the rings. The most plausible explanation
for the clearing of central cavities is the collisions of planetesimals grinding themselves into
dust which is then removed by radiation pressure. The clumps observed in some debris
discs like ² Eridani can be explained by the presence of planets orbiting the host stars
all have more dust mass than the best estimates for the Kuiper Belt, even around the 10
Gyr-old star of τ Ceti. It would be difficult for life to form in these systems since any
planets would be subject to bombardment by comets, similar to the heavy bombardment
phase that is thought to have occurred in the early solar system. However, the 1.7 MJ
planet orbiting²Eridani (Hatzes et al., 2000) is likely to be more efficient than Jupiter at
ejecting comets on Earth-crossing orbits from the system (Horner & Jones, 2008).
Presently, the fraction of stars with planetary systems is estimated to be 12-15%
(Fischer et al., 2003; Marcy et al., 2005). The stars with detectable planets and debris
discs only represent about 30% of the nearby stellar population, neglecting the overlap
between the two samples. The most exciting discoveries may be found in the other∼70%
of stars for which there are no detections of planets or debris discs. Greaves et al. (2004a)
pointed out that the Sun belongs to this group of stars. This is because the giant planets
are situated in the outer solar system and so would be hard to detect using radial-velocity
techniques and the Kuiper Belt contains less dust in it than the debris discs discussed
here.
1.2 Star Formation
1.2.1 Fundamental Concepts
Since our Galaxy is estimated to be 10 billion years old, the very fact that we observe O
type stars with main sequence lifetimes of less than 3 million years implies they must have
formed recently on Galactic timescales. This assertion is supported by radio observations
that show that OB stars are most often located within dense clouds of gas and dust,
presumably out of which they formed.
Stars form in Giant Molecular Clouds (GMCs), the majority of which are located in
the spiral arms of our Galaxy. GMCs are made up of mostly molecular hydrogen H2.
Observations of emission lines can be fit with a Gaussian profile to determine a distribution
of velocities,
whereσ is known as the velocity dispersion. From this it can be determined if clouds are
gravitationally bound and so may form stars if they condense further.
Stars form when a clump of gas and dust in a molecular cloud collapses under its own
gravity. In the most simple case the gravitational attraction of the system must overcome
the gas pressure of the clump. For a system in virial equilibrium the total potential energy,
EP is exactly twice the kinetic energy, EK
:-EP + 2EK = 0 (1.2)
If EP + 2EK <0 the clump will collapse but if EP + 2EK >0 then the clump will expand,
assuming a nonmagnetic, isothermal, infinite, homogeneous self-gravitating medium with
no turbulence (Mac Low & Klessen, 2004). From stability analysis Jeans (1902) derived
a dispersion relation for small
perturbations:-ω2−c2s
µ
2π
λ
¶2
+ 4πGρ= 0 (1.3)
whereωandλare the oscillation frequency and wavelength, respectively, csis the
isother-mal sound speed, G is the gravitational constant and ρ is the density. Equation 1.3
describes the propagation of sound waves through the medium under the influence of
self gravity, for which gravitational collapse will overcome the acoustic restoring force for
perturbations with wavelengths greater than the Jeans length,λJ
:-λJ =
s
πc2
s
Gρ (1.4)
Assuming a spherical perturbation with radius equal to the Jeans length, there exists a
minimum mass, the Jeans mass, MJ, above which the gravitational collapse will overcome
the thermal pressure of the gas contained within the
clump:-MJ =
4π 3 µ λJ 2 ¶3
ρ= π
6
³π
G
´3/2
c3sρ−1/2 (1.5)
Equation 1.2 is the virial theorem for an isolated body in hydrostatic equilibrium. For
a spherical clump of self gravitating, isothermal ideal gas, of radius, r, with an external
becomes:-EP + 2EK = 4πr3Pext (1.6)
Bonnor (1956) and Ebert (1957) derived the largest possible mass of this sphere of gas in
a pressurised medium, whilst still being in hydrostatic
equilibrium:-MBE = 1.18
σ4 (G3/2P
ext)1/2
(1.7)
where MBE is the Bonnor & Ebert mass andσ is the velocity dispersion. Clumps of gas
with masses greater than the Bonnor-Ebert mass will become dynamically unstable to
gravitational collapse. A maximum radius, Rc, below which size a clump is gravitationally
unstable is given
by:-RC = 0.41
GMBE
σ2 . (1.8)
The Jeans mass is greater than the mass contained within a Bonnor-Ebert sphere
with the same surface conditions because the latter assumes that the clump is more dense
than the surrounding material but only part of the mass contained within a Jeans length
will collapse. The Jeans mass represents the critical mass that must accumulate before a
clump of gas will undergo gravitational collapse. The Bonnor-Ebert mass is able to take
account of the high pressures found in GMCs.
Classical Dynamical Theory
The classical dynamical theory of star formation was developed based on the balance
between pressure gradients and gravitational collapse and included micro-turbulence but
only as an addition to the thermal pressure by modification of the effective sound speed.
It did not account for conservation of angular momentum or magnetic support during
collapse. This became a problem when the presence of magnetic fields in the Interstellar
Medium (ISM) was detected through observations of polarised starlight (Hiltner, 1949,
1951; Chandrasekhar & Fermi, 1953).
If a cloud’s mass is greater than the critical mass, MC, required for gravitational
is termed subcritical. From measurements of the magnetic field from Zeeman splitting of
the HI (atomic hydrogen) line (Troland & Heiles, 1986) and from measurements of pulsar
rotation and dispersion (Rand & Kulkarni, 1989; Rand & Lyne, 1994), MC was measured
to be 4×10⁶ M
¯.
Another problem encountered was that the free-fall timescales predicted by this
model were orders of magnitude faster than the typical ages of galaxies which led to
an overestimation of the star formation rate. Also, conservation of angular momentum
predicted rotation periods of under a second for stars when observations of solar-type stars
showed rotation periods of the order of tens of days. Mac Low & Klessen (2004) point
out that the resulting centrifugal force from this fast a rotation exceeds the gravitational
force by eight orders of magnitude so is clearly unphysical. Finally, the detection of bipolar
outflows from young stars by Snell et al. (1980) provided part of the solution to the angular
momentum problem and Konigl & Pudritz (2000) showed that magnetic fields transfer the
angular momentum from the infalling gas to outflowing gas.
Standard Theory of Isolated Star Formation
Mestel & Spitzer (1956) were the first to argue that the magnetic repulsion problem could
be overcome by movement of neutral gas across the field lines. This process of ion-neutral
drift is known as ambipolar diffusion and allows the local density to increase and therefore
lower the value of MC. The dynamical timescale associated with ambipolar diffusion was
also found to be 10-20 times longer than for standard gravitational collapse which helped
explain the observed star formation rates. The angular momentum problem was also
explained by magnetic tension acting to brake rotating cores.
On the basis of ambipolar diffusion as a dominant physical process, Shu (1977)
argued that a singular isothermal sphere in a magnetically subcritical cloud core can
develop with a radial density distribution of the formρ∝1/R2. The core should collapse
on timescales of the order of the ambipolar diffusion timescale and eventually lead to
inside-out collapse with the central region collapsing and accreting before the envelope.
As the central region undergoes free-fall collapse the density takes the formρ ∝1/R3/2,
with a free fall speed, v2 = −GM/R. As the inner region collapses an expansion wave
moves outward and this transfers mass to the inner region. In this model the accretion
This standard theory of star formation was widely accepted during the 1980s but
more recently several problems have arisen. Firstly, there are a number of theoretical flaws
in the theory: If the ratio of densities at the centre and the surface of the sphere is greater
than 14, then a stable equilibrium state cannot be reached and the collapse of the cloud
will occur before the 1/R2 density distribution can be established (Whitworth et al., 1996;
Silk & Suto, 1988; Hanawa & Nakayama, 1997). The symmetry in the inner region of the
sphere is also broken by external perturbations so this tends to flatten the density profile.
The mass actually moves to the centre of the sphere by ambipolar diffusion in the outer
envelope and not by the expansion wave as initially thought. The collapse of a core with
a 1/R2 density profile also tends to form single objects in preference to binary or multiple
systems but most stars form as part of a multiple system (Mathieu et al., 2000; Whitworth
et al., 1996).
Secondly, more powerful observation techniques in the 1990s were able to expose
further problems with the standard theory. In particular, Nakano (1998) stated that the
magnetic field strengths measured in molecular clouds are not actually strong enough
to create a magnetically subcritical situation; the previous measurements taken in the
1970-80s were too inaccurate for this to be apparent. Also, the model predicts that the
inner part of the core should collapse while the outer envelope remains in place, but
mapping in optically thick and thin lines show that the infalling material is too extended
to be consistent with inside-out collapse (Tafalla et al., 1998; Williams et al., 1999). The
density profiles observed are flat and do not fit the 1/R2 structure as predicted by the Shu
model. The ages of clumps in molecular clouds measured from observations of chemical
abundances are of the order of 105 years (van Dishoeck et al., 1993; van Dishoeck & Blake,
1998; Langer et al., 2000) compared to the ambipolar diffusion timescale of 107 years.
Observations of protostellar accretion rates do not remain constant but in fact
de-crease with time. The number of stars in cores indicates that the time for the cores to
evolve in the prestellar phase is similar to the length of time spent in the accretion phase.
This is in disagreement with the standard model which predicts that the core evolves at
the prestellar phase on ambipolar diffusion timescales which are an order of magnitude
longer than the dynamical timescales of the accretion phase. Finally, the range of ages
of stars in clusters should be much larger than the dynamical timescale if the cores are
contracting on ambipolar diffusion timescales, yet in fact the spread of ages is closer to
Support of Clouds by Supersonic Turbulence
The most recent model of star formation presented by Mac Low & Klessen (2004) is
based on the work of Larson (1981) and finds that supersonic turbulent flow can support
a core from collapse enough to slow the star formation rate but still allow gravitational
contraction to take place. The supersonic turbulence can create density fluctuations that
result in the formation of dense clumps and filaments. The turbulence decays rapidly
and requires driving by either supernovae or galactic rotation but operates either with
or without a magnetic field present. Magnetic fields weaker than the subcritical level are
capable of reducing the collapse rate but are not able to stop it completely but may still
transfer angular momentum if coupled to the gas.
This latest theory addresses many of the inconsistencies associated with the standard
model and since the rate of local collapse depends on the strength of the turbulence it also
provides an explanation for the varied star formation rates observed.
1.2.2 Observational signatures of star formation
Evolution of Protostars on the HR Diagram
A Hertzsprung-Russell (H-R) diagram for nearby stars can be constructed by plotting
their bolometric luminosities against the effective temperature, Te, of the star, which is
the surface temperature of the star assuming that it is radiating as a blackbody. It is
related to the luminosity, LS and the radius, RS of the star
by:-Te= (LS/σ4πRS2)1/4 (1.9)
where σ is Stefan’s constant. The majority of stars lie within a band in the diagram
known as the main sequence. The fact that most stars occupy this region of the diagram
is consistent with the fact that stars spend most of their lives in hydrostatic equilibrium,
fusing hydrogen into helium via the proton-proton chain to produce the necessary pressures
to combat gravitational collapse and maintain hydrostatic equilibrium.
Joy (1945) identified a new type of star which was later named after the first star
and dust which means they have to be observed in the IR since the visible light is scattered
by dust and re-radiated in the IR. They have unusually large amounts of lithium in their
atmospheres which is utilised during nuclear fusion in stellar interiors. The large amounts
of lithium apparent in the surface of T Tauri stars is therefore evidence of surface activity
and indicates that the stars are very young. T Tauri stars are also expected to have strong
chromospheric activity since their spectra usually include strong emission lines as well as
evidence for strong stellar winds and their brightness can vary on timescales of only a few
hours.
The abnormal spectra and the fact that computing bolometric brightnesses requires
the addition of the IR excesses to the optical fluxes makes construction of H-R diagrams
for T Tauri stars difficult but was done by Strom (1977); Cohen & Kuhi (1979). T Tauri
stars are positioned above the locus occupied by Population I, zero age main sequence
(ZAMS) stars on the Hertzsprung-Russell (H-R) diagram.
Assuming the envelope of a protostar remains radiative, then its luminosity is limited
by the photon diffusion rate and it can be shown for low to medium mass, M, stars (Shu,
1982)
that:-L∝M5.5/R0.5 (1.10)
which means for a contracting protostar the luminosity will increase slowly with
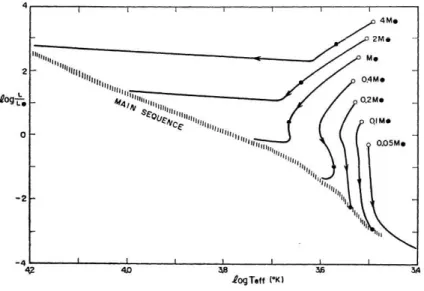
de-creasing R. Henyey et al. (1955), Hayashi et al. (1962); Hayashi (1966) and Larson (1969)
constructed horizontal radiative evolutionary tracks assuming a protostar contracted
grad-ually through a progression of radiative states with decreasing radii as shown in Figure
1.2. Hayashi & Nakano (1965) showed that below a certain temperature the photospheric
layers of a star lose their ability to prevent the free streaming of photons. This leads to
an increase in the luminosity in the envelope beyond that which can be carried outward
by radiative diffusion and therefore the envelope will be become convective. Therefore,
there is a minimum temperature and therefore a maximum radii above which the protostar
must follow a vertical evolutionary track on the H-R diagram. The combination of the
convective and radiative tracks results in the Henyey-Hayashi evolutionary tracks shown
in Figure 1.2. Gaustad (1963) argued that the contraction of a protostar could not proceed
Figure 1.2: Theoretical evolutionary Hayashi-Henyey tracks for stars of various masses
between 0.05-4 M¯ under going quasi-hydrostatic collapse. (Figure from Hayashi (1966))
to the high efficiency of radiative transfer leading to a stage of rapid dynamical collapse.
Numerical calculations have shown that after this rapid dynamical collapse, low-medium
mass stars will appear on the convective part of the Henyey-Hayashi tracks. This means
that young stars that have recently formed out of material from their parental molecular
cloud will generally be located above the main sequence stars on the H-R diagram and is
consistent with the notion that T Tauri stars are pre-main sequence stars.
Since young stars are often enshrouded in dusty envelopes or located in embedded
clusters, the light from the young stars is subject to extinction and the youngest stars
are invisible at optical wavelengths. Therefore, measuring their luminosities is extremely
difficult. Since much of the emission is reprocessed by the surrounding dust and re-radiated
at longer wavelengths, the SED does not resemble a blackbody and so determining a
temperature is not possible. This means that it becomes extremely difficult to place young
stars on a H-R diagram and so a more effective means of classifying YSOs is required.
Classification of Protostars & Pre-Main Sequence Stars
Giant molecular clouds are the sites of active star formation. As discussed later in Section
2.1 these clouds are opaque when observed at optical wavelengths but observations at
longer wavelengths in the near and far infrared allow us to detect the radiation from
embedded clusters which are heavily obscured by dust and are therefore most effectively
observed at infrared wavelengths (Lada & Lada, 2003).
Planck’s law gives the spectral radiance, Bλ as a function of wavelength,λ, emitted
from a blackbody of temperature T
using:-Bλ=
2hc2
λ5
1
ehc/λkT −1 (1.11)
where h is Planck’s constant, k is the Boltzmann constant and c is the speed of light in a
vacuum. Planck’s law can also be written as a function of frequency,ν
:-Bν =
2hv3
c2
1
ehν/kT −1 (1.12)
where Bν is the spectral radiance as a function of frequency.
Dust grains are not perfect blackbodies and the spectral radiance, Sν(T), emitted
by dust grains in circumstellar discs and cool clouds of temperature, T, is actually fit by
a modified blackbody (greybody)
curve:-Sν(T)∝Bν(T)νβ (1.13)
whereBν(T) is the blackbody intensity andβis the index giving the frequency dependence
of the emissivityQ(ν), varying between 1 and 2 (Hildebrand, 1983).
The spectral indexαλ is measured using the slope of the spectral energy distribution
(SED), measured asλSλ between 2 and 20µ
m:-αλ =
d(logλSλ)
d(logλ) . (1.14)
For a perfect blackbody αλ has a value of -3 for high frequencies (hν/kT ¿ 1),
but the dusty discs and envelopes around a Young Stellar Object (YSO) reprocess the
light from the star to longer wavelengths. Thus, emission at infrared wavelengths that
exceeds that expected for a standard stellar photosphere is an indication of youth. The
dust appears on the SED as a superposition of greybody curves since the dust radiates at
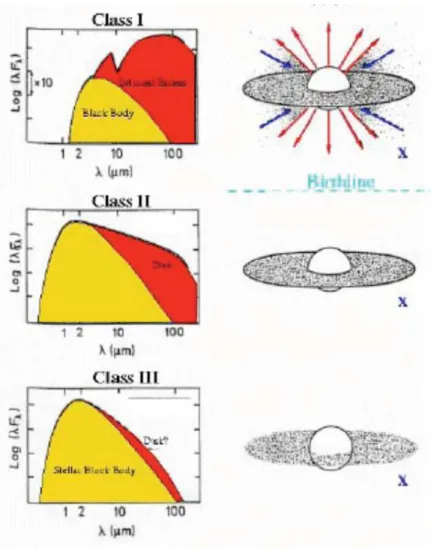
Figure 1.3: Schematic of SED models associated with Class 1 (Envelope), Class II (Disc)
and Class III (Remnant Disc) objects. Credit: adapted from C. Lada, P. Andre, M.
A basic classification scheme for low mass protostars was established by Lada &
Wilking (1984) and Lada (1987) in which stars were labelled from Class I (envelope
accre-tion) to III (remnant disc) and later with the addition of Class 0 (early collapse) (Andre
et al., 1993) based on the value ofαλfrom their SEDs as shown in Figure 1.3. Class 0 and
I sources are usually referred to as protostars whilst Class II and III sources are referred
to as pre-main sequence stars and the features of each class are briefly discussed below.
Class 0 sources
Class 0 sources are embedded in and surrounded by circumstellar material so that their
SEDs peak at around 100µm and are often not observable at wavelengths below 20µm.
Their SEDs resemble a single temperature cold blackbody with a temperature ranging
between 20 and 70 K. All known Class 0 sources are associated with bipolar outflows,
another sign of youth.
Class I sources
Class I sources have SEDs which peak in the far infrared with αλ > 0 and are broader
than a single temperature blackbody implying that the large infrared excess originates
from dust at a range of temperatures. The absorption feature seen at 10 µm is due to
silicate dust and this implies that the radiation observed is being emitted mostly from
dust. Class I sources are believed to be young protostars with an infalling envelope; this
is because the infrared excess is emitted by warm dust close to the star which would be
blown away by radiation pressure if no infalling material was present. Infalling envelopes
can be detected directly by observing an attenuated red wing compared to the blue wing
of spectral lines detected near protostellar cores (Peretto et al., 2006).
Class II sources
Class II and III sources have SEDs which peak in the near infrared. Class II sources have
broad SEDs with -2 < αλ < 0, there is an infrared excess but not as large as is present
for Class I sources and no 10 µm silicate absorption feature is visible. This implies that
infalling envelope. Class II sources are generally identified as Classical T Tauri (CTTs)
stars when observed in the optical from their strong emission lines Joy (1945).
Class III sources
Class III sources have SEDs with αλ < -2 and do not exhibit an infrared excess; most
of the emission comes from the stellar photosphere of the young stars with only a small
contribution from a remnant disc. Class III sources are also identified as weak line T
Tauri stars (WTTs) because of smaller equivalent widths of accretion-tracing lines. Any
foreground dust will scatter shorter wavelength emission more than the emission at longer
wavelengths and so Class III sources often appear reddened.
Identifying young sources with IR excesses in the field allows regions where star
formation is currently taking place to be traced. By analysing the distribution of sources
of each evolutionary stage conclusions can be drawn as to how the stars may have formed.
In particular, one of the main objectives of this thesis is to assess to what extent star
formation is induced by the compression of material in the cloud, commonly referred to
as triggered star formation.
1.2.3 Triggered Star Formation
Observations indicate that the initial process governing the onset of star formation in
the spiral arms is a gravitational instability in the arms and disks. However, triggering
processes are believed to be responsible for sustaining and accelerating star formation
following this initial spontaneous process (Elmegreen, 1998). There are three types of
triggering commonly considered: compression of globules within a cloud, cloud collisions
and accumulation of the cloud into a dense ridge which subsequently collapses into dense
cores. This thesis deals with the latter scenario. The winds, expanding HII regions and
eventual supernova explosions associated with massive stars can sweep up and compress
the surrouding material in molecular clouds. Since the Jeans mass is related to the density
of the cloud as∝ρ−1/2 (see Equation 1.5), compression of the gas decreases the value of
the Jeans mass which means gravitational collapse can occur more easily and encourage
star formation to take place. The details of the triggering processes associated with the