fuzzycreator: A Python-Based Toolkit for
Automatically Generating and Analysing
Data-Driven Fuzzy Sets
Josie McCulloch
Lab for Uncertainty in Data and Decision Making (LUCID), School of Computer Science, University of Nottingham, Nottingham, UK
Email: [email protected]
Abstract—This paper presents a toolkit for automatic genera-tion and analysis of fuzzy sets (FS) from data. Toolkits are vital for the wider dissemination, accessibility and implementation of theoretic work and applications on FSs. There are currently several toolkits in the literature that focus on knowledge rep-resentation and fuzzy inference, but there are few that focus on the automatic generation and comparison of FSs. As there are several methods of constructing FSs from data, it is important to have the tools to use these methods. This paper presents an open-source, python-based toolkit, named fuzzycreator, that facilitates the creation of both conventional and non-conventional (non-normal and non-convex) 1, interval 2 and general type-2 FSs from data. These FSs may then be analysed and compared through a series of tools and measures (included in the toolkit), such as evaluating their similarity and distance. An overview of the key features of the toolkit are given and demonstrations which provide rapid access to cutting-edge methodologies in FSs to both expert and non-expert users.
I. INTRODUCTION
This paper presents fuzzycreator: an open-source (licensed under GNU General Public License), cross-platform, python-based toolkit that facilitates the construction of type-1 (T1) and type-2 (T2) fuzzy sets (FSs) automatically from data, and enables the analysis of these FSs through measures, such as similarity and distance. This is unique to current toolkits in the literature, which commonly focus on inference within fuzzy logic systems (FLSs). As there are many possible methods of constructing FSs from data [1], [2], and different applica-tions may also be suited to different methods of membership function (MF) generation, it is important to have the tools to facilitate them.
Much of the literature involves the use of well known MFs, such as trapezoid and Gaussian, for example for the purpose of control. However, such MFs may not be appropriate for applications where the data distribution is not known or is known, for example, not to be normally distributed, such as is often the case for human decision making [3]. Membership function generation can be a difficult task as there is no consensus on how it should be achieved, and the interpretation of a MF may differ between individuals. One of the key aims of this toolkit is to facilitate the automatic generation of FSs from data. The MF shapes may be conventionally simplistic or they may be non-conventional by modelling, for
example, disagreement within the data through non-normal or non-convex functions.
Another key feature of this toolkit is the analysis and com-parison of FSs through measures. The most featured measures within this initial version of the toolkit are in comparing the similarity and distance between two FSs.
In addition, fuzzycreator provides the ability to graphically plot FSs. Note that all the figures in this paper have been generated by the new toolkit.
The remainder of this paper is structured as follows. The next section presents an overview of fuzzy toolkits currently in the literature, followed by a background on automatic FS generation from data and measures on FSs. After this, Section III provides an overview of the features of the new toolkit. Finally, Section IV presents some conclusions.
II. BACKGROUND
This section first provides an overview of fuzzy toolkits in the literature, followed by a background on the automatic generation of FSs and measures of comparing FSs.
A. Fuzzy Toolkits
There are many FS and fuzzy logic toolkits available in the literature for T1, interval type-2 (IT2) and, to a lesser extent, general type-2 (GT2) FSs. However, these primarily focus on fuzzy inference used within a fuzzy logic system (FLS). The focus of this toolkit, however, is the automatic generation and comparison of FSs from data. This section provides a brief overview of toolkits within the literature and their features, after which the key differences between this toolkit and those available are highlighted; also see [4] for a further overview of fuzzy systems software.. Note that it is assumed that the reader is familiar with the literature on FSs and fuzzy logic systems; otherwise, one can refer to [5], [6], [7].
In addition, it also provides the ability to construct IT2 FSs from data using the Interval Approach [9].
• R Wagner et al. [10] developed a FLS toolbox for the programming language R. The FLS is created using the command line, but the toolkit can graphically plot FSs and the control surface of the FLS.
• Juzzy, Juzzy OnlineWagner et al. created a Java based FLS toolkit named Juzzy [11] and an online version named Juzzy Online [12]. These can be used to create T1, IT2 and GT2 (zSlices-based [7]) FLSs. The online version provides a graphical interface and therefore does not require the user to have any familiarity with Java. Both toolkits provide the functionality to plot FSs and the control surface of the FLS. In addition, Juzzy Online provides a visual overview of the inference process.
• KBCT KBCT (knowledge base configuration tool) [13]
was created for the generation or refinement of T1 fuzzy knowledge bases from expert and induced knowledge where users may have no knowledge of fuzzy logic.
• FisProFisPro [14] is a java-based toolkit for creating T1 FLSs by generating fuzzy partitions and rules from data. It also provides visualisations and a graphical interface.
• Xfuzzy Xfuzzy [15] provides tools to aid in describing, verifying and tuning a T1 FLS, as well as implementing the FLS on software or hardware.
• FISDeT, pyfuzzy FISDeT [16] is a python-based toolkit that provides a graphical interface to define and update a knowledge base of T1 FSs and create fuzzy rules. The implementation of FISDeT is based on pyfuzzy, which is also a python-based toolkit for designing T1 FLSs.
• GUAJE GUAJE [17] is a toolkit that combines several
different existing software tools, including KBCT, FisPro and Xfuzzy to create FLSs. The goal of GUAJE is to provide an easily interpretable system for creating FLSs. This includes feature selection of data through Weka, partition and automatic rule generation through FisPro, and linguistic simplification and optimisation through KBCT. The generated FLSs may then be exported using the formats used by FisPro, Matlab or Xfuzzy.
This paper presents a new toolkit named fuzzycreator. It is unique to the above as it focuses on the automatic generation of FSs from data and facilitates the analysis of the resulting FSs through measures. The next section provides an overview of the features provided by the toolkit.
B. Generating Fuzzy Sets from Data
One of the key features of the new toolkit is the auto-matic generation of FSs from data. The toolkit focuses on quantitative data represented by singletons or intervals as input data. Using interval data points allows a person to indicate uncertainty when expressing answers to a survey on a numerical scale. For example, in answering the question “how would you rate the service of this hotel?” one may answer “somewhere between 7 and 8 out of 10”. The uncertainty in this answer is expressed by drawing an ellipse on a numerical scale, such that the ellipse represents the approximate rating
for the given question [2]. The wider the ellipse is the more uncertain the answer is as it encompasses a wider range of values. Fig. 1 shows an example of a singleton (at [0.5]) and two interval answers (at [2,4] and[5,9]). The wider the interval the greater the uncertainty in the answer.
Fig. 1: A singleton representing a (certain) singleton answer and two ellipses representing an (uncertain) interval answer.
Below are three methods of generating FSs based on sin-gleton or interval data.
1) Polling with Singleton Data: The polling technique involves taking a list of singletons within a given range and using a histogram based approach to generate membership values for each value within the data set. This will produce discrete FSs. However, (linear) interpolation can be used to provide a continuous MF [18]. The resulting FSs may be non-normal or non-convex, representing disagreement within the data. Fig. 5a provides an example of a FS constructed using the polling technique from data containing two normal distributions.
2) Gaussian with Singleton Data: As an alternative to the polling technique described above, Gaussian functions may be generated from singleton data based on its mean and standard deviation. This ensures all resulting FSs are normal and convex, and assumes the data is normally distributed. Fig. 5b provides an example of a FS with a Gaussian MF established from singleton data.
3) Interval Agreement Approach with Interval Data: FSs are generated by assigning membership values in proportion to the ratio of agreement in the given set of intervals. The resulting FSs may be non-normal or non-convex, representing disagreement within the data. Fig. 6 shows an example of a T1 and T2 FS constructed from interval data using the Interval Agreement Approach (IAA) [2].
C. Measures on Fuzzy Sets
One feature of this toolkit is the ability to analyse FSs through relative comparisons. The most featured measures are to compare the similarity and distance between two FSs. Others include measuring the subsethood between two FSs and measuring the fuzziness of an individual FS.
1) Similarity: A similarity function s(A, B)∈[0,1] deter-mines the degree to which two FSsAandB contain the same values to the same degree of certainty. A value of 1 is given for identical FSs, and the result, generally speaking, mono-tonically decreases as two FSs have less overlap. Numerical examples are given later in Table II.
2) Distance: A distance functiond(A, B)∈R+determines
how far apart two FSsAandBare placed within their universe of discourse, essentially focusing on the difference between the values contained within the FSs. This difference between values is often weighted according to their membership within the FSs. Numerical examples are given later in Table II.
Distance measures have been extensively applied to ranking FSs [20] as well as in decision making [21] and statistical analysis [22]. A list of supported distance measures can be found within the toolkit.
3) Additional Measures: In addition to similarity and dis-tance, further measures are available. One such measure is subsethood b(A, B)∈[0,1]; i.e., the degree to which the FS A is contained within B. We say A is a complete subset of B ifµA(x)≤µB(x), ∀x.
The entropy e(A)∈[0,1]of a FS may also be measured; this determines the degree to which a FS is fuzzy. If all membership values are crisp (0 or 1) then the FS is not fuzzy. However, if all membership values are completely uncertain (at µ(x) = 0.5, ∀x) then the FS is completely fuzzy (it has maximum entropy).
III. FUZZYCREATOR: TOOLKITFEATURES
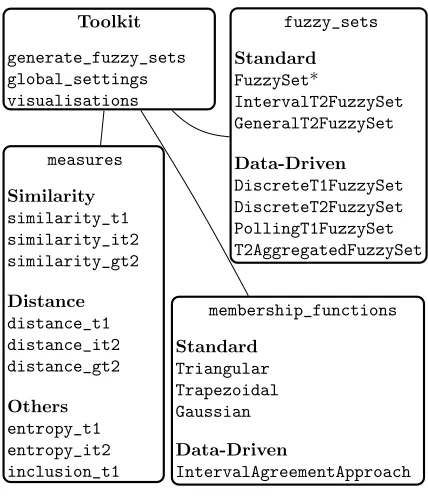
The toolkit is available online at https://bitbucket.org/ JosieMcCulloch/fuzzycreator. Fig. 2 provides an overview of the features provided as part of the toolkit. FSs and MFs are grouped into parametric and non-parametric. Note that the FuzzySet class is highlighted as it may take on both parametric and non-parametric data-driven MFs. For a full overview of the structure and details of all modules, classes and functions, API documentation is provided with the toolkit.
The remainder of this section provides an overview of the features of the toolkit, including standard FSs, data-driven FSs, measures of analysing and comparing FSs and global settings that are used to provide consistency throughout the toolkit. Note that the toolkit provides modules with examples that demonstrate the features detailed within this section. These provide a quick reference of how to use the toolkit.
A. Standard Fuzzy Sets
The standard FSs that can be created within this toolkit are T1, IT2 and GT2 (zSlices-based [7]) FSs. These can each be defined by triangular, trapezoidal or Gaussian MFs. Each type provides the ability to calculate primary and (for type-2 FSs) secondary membership values and alpha-cuts, as well as the ability to graphically plot the individual FS.
1) Type-1 Fuzzy Sets: T1 FSs may be defined by any MF, including standard (i.e., triangular, trapezoidal and Gaussian) and data-driven MFs (through polling or the IAA; see Section II-B). Calculations offered for T1 FSs include calculating the membership value of a given point, calculating alpha-cuts, and defuzzification using the centroid approach [18].
2) Interval Type-2 Fuzzy Sets: IT2 FSs are defined by two MFs of the same class (e.g. both Gaussian). Basic calculations
Toolkit
generate_fuzzy_sets global_settings visualisations
fuzzy_sets
Standard
FuzzySet*
IntervalT2FuzzySet GeneralT2FuzzySet
Data-Driven
DiscreteT1FuzzySet DiscreteT2FuzzySet PollingT1FuzzySet T2AggregatedFuzzySet
membership_functions
Standard
Triangular Trapezoidal Gaussian
Data-Driven
IntervalAgreementApproach measures
Similarity
similarity_t1 similarity_it2 similarity_gt2
Distance
distance_t1 distance_it2 distance_gt2
Others
[image:3.612.330.544.47.297.2]entropy_t1 entropy_it2 inclusion_t1
Fig. 2: Layout of the toolkit.
can be performed on IT2 FSs, including calculating the pri-mary membership for a given value, and calculating the alpha-cuts of the lower and upper MFs. Type-reduction is achieved with the Karnik-Mendel centre-of-sets method [23].
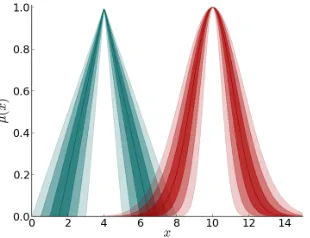
3) General Type-2 Fuzzy Sets: A GT2 FS is constructed using the zSlices/alpha-plane representation [7], in which the secondary MF has the value 1 at the centre of the footprint of uncertainty (FOU) and the membership decreases linearly towards the edge of the FOU. The default number of zSlices used to define FSs in the toolkit is 4. However, this can be changed globally for all FSs or individually for specific FSs.
Fig. 3 shows 3-dimensional representations of two GT2 FSs with four zSlices generated by the toolkit. Three different colour schemes are available for GT2 FSs. These are individu-ally shaded, grey-scale and heat map; in the case of the former two, darker shades indicate higher secondary membership values. In addition to 3-dimensional figures, Fig. 4 shows an example of depicting GT2 FSs in a 2-dimensional graph, using darker shades to indicate higher secondary membership values; as in [12].
Calculations can be performed on GT2 FSs, including calculating the primary membership (for a given value and zLevel), the secondary membership (for a given value and its primary membership) and the lower and upper alpha-cuts of a zSlice (for a given zLevel).
Type-reduction of GT2 FSs is done by type-reducing each individual zSlice and aggregating the results into a T1 FS [7]. A single defuzzified value may also be derived. This is achieved by calculating the weighted average of the type-reduced sets.
B. Data-Driven Fuzzy Sets
Comput-(a) (b)
[image:4.612.62.293.59.325.2](c)
[image:4.612.363.513.64.127.2]Fig. 3: 3-dimensional figures of two GT2 FSs generated by the toolkit shown from front and top views. FSs can be shaded (a) uniquely, (b) in greyscale, or (c) coloured by heatmap.
Fig. 4: Two-dimensional view of the GT2 FSs shown in Fig.3.
ing with Words, in which FSs are used to model linguistic terms. There are several different methods of creating fuzzy models of words, such as providing single-valued answers or interval-valued answers [2] to questions on a numeric scale (as shown in Section II-B).
Different methods of generating FSs from data include creating Gaussian functions (based on the mean and std. dev. of the data), using the polling technique with singleton data, the IAA with interval data, and creating discrete FSs (i.e. polling with no interpolation; T1 only). The toolkit contains the modulegenerate_fuzzy_setsto automatically gen-erate MFs and FSs from data. A list of data points can be given to the toolkit, which then generates Gaussian, polling or IAA FSs (chosen by the user). Both T1 and T2 FSs may be created. Table I lists the functions available to automatically
generate_fuzzy_sets
[image:4.612.321.551.182.277.2]generate_gaussian_t1_fuzzy_set generate_gaussian_t2_fuzzy_set generate_polling_t1_fuzzy_set generate_polling_t2_fuzzy_set generate_iaa_t1_fuzzy_set generate_iaa_t2_fuzzy_set generate_discrete_t1_fuzzy_set
TABLE I: A list of methods available to automatically generate FSs from data.
(a) (b)
Fig. 5: Polling (a) and Gaussian (b) type-1 FSs automatically generated from the same singleton data which contains two normal distributions.
generate FSs.
1) Gaussian Functions: The most simple method of au-tomatically generating FSs calculates the mean and standard deviation of the data and generates type-1 FSs with Gaussian MFs. Multiple FSs may be automatically aggregated together within the T2AggregatedFuzzySet module to create a data-driven T2 FS.
2) Singleton Polling: The polling technique involves taking a list of numerical values within a given range and using a histogram-based approach to generate membership values for each value within the data set. This will produce discrete FSs. The polling FS within the toolkit, however, uses linear interpolation to provide a continuous MF. Multiple polling-based FSs may also be aggregated together to create a data-driven T2 FS.
One advantage of the polling technique is its ability to show non-convex distributions of data. For example, Fig. 5 shows polling and Gaussian FSs generated from the same data. The polling method shows that the data contains two modes. However, when generating a single Gaussian MF this information is lost (see Fig. 5b). Future implementations may include optional smoothing functions to result in a smooth model of the FS in Fig. 5a.
[image:4.612.93.248.390.509.2]gener-(a) (b)
Fig. 6: A T1 and a GT2 FS automatically generated from interval data using the IAA
ated by the toolkit. Note that the IAA creates a continuous function and so no interpolation between membership values is required.
4) Discrete Fuzzy Sets: This toolkit also provides the ability to create discrete T1 and T2 FSs. Primary and secondary mem-bership is explicitly stated for any value and no interpolation is used. This has been provided in case of applications where discrete functions are more appropriate or where tests can be more accurately achieved with discrete data.
C. Measures on Fuzzy Sets
One of the key features of this toolkit is the ability to analyse FSs through measures. The included measures are for comparing the similarity and distance between two FSs, the subsethood of one FS within another, and measuring the fuzziness of an individual FS.
Note that as well as conventional distance measures, the toolkit also offers some directional distance measures – i.e., d(A, B) ∈ R instead of R+. In this case, the sign of the
result indicates if one FS on average contains lower or higher values than the other, whilst the absolute value indicates the magnitude of distance [24].
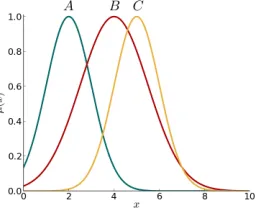
Table II presents a small sample of measures on the T1 FSs in Fig. 7, consisting of two similarity measures, two distance measures and a subsethood and entropy measure each. These results show that the pair(B, C)is the most similar, followed by (A, B) then (A, C). According to the distance measures, the pair (A, C)are the most distant, followed by(A, B)then
(B, C). According the subsethood measure, B is contained within C to a higher degree than A is contained within C. Additionally, the FSs have close values of entropy (i.e. they represent approximately the same degrees of uncertainty).
There are too many functions of measuring FSs provided within the toolkit to provide a comprehensive overview in this paper. However, the toolkit provides documentation containing formulae and references for every measure. Measures are provided for T1, IT2 and GT2 FSs. Note that the literature contains a wider variety of methods for T1 FS than for T2, a subset of which is reflected within the toolkit.
D. Visualisations
The toolkit offers the ability to plot FSs graphically. Each FS class has the function to plot the individual FS. In addition
Ref Eq. (A, B) (B, C) (A, C)
[25] s(A, B) = Pn
i=1min(µA(xi),µB(xi))
Pn
i=1max(µA(xi),µB(xi)) 0.269 0.517 0.072
[26] d(A, B) =R1
α=0h(Aα, Bα)dα 2.627 1.612 3.0
[27] b(A, B) = Pn
i=1min(µA(xi),µB(xi))
Pn
i=1min(µA(xi)) 0.536 0.569 0.137
(A) (B) (C)
[28] e(A) = P
x∈Xmin(µA(x),1−µA(x))
P
x∈Xmax(µA(x),1−µA(x)) 0.11 0.184 0.117
[image:5.612.56.290.60.161.2]TABLE II: Similarity, distance (hrefers to Hausdorff distance (see [26])), subsethood, and entropy measures applied to the T1 FSs in Fig. 7.
Fig. 7: Three T1 FSs used to demonstrate a sample of measures in the toolkit in Table II.
to this, the visualisations module enables one to plot multiple FSs on the same graph.
All plots in this paper were generated with the toolkit and the source code can be found as part of the library. Note that the axis labels can be altered for the generated figures.
E. Global and Local Settings
The toolkit facilitates global settings that can be used throughout. This is useful as it enables all FS generation and analysis to be processed as part of the same environment. Settings of the universe of discourse, discretisations, precision and visualisations may be set globally. However, some settings may also be changed locally for individual FSs. Each setting is detailed next and coded examples of the effects of different settings are given within the toolkit.
1) Universe of Discourse: By default, all FSs within the toolkit adopt the universe of discourse (UOD) as given in the global_settingsmodule (default is[0,10]). However, if desired, the UOD of an individual FS may be set. This can be done upon initialisation of the FS but may also be changed for an individual FS at any point. Note that changing the global value only updates the default universe of discourse of future FSs and does not retrospectively alter pre-existing FSs.
[image:5.612.371.499.211.315.2]3) Normalisation: FSs generated from data may be normal or non-normal. By default, data-driven FSs are non-normal if there is disagreement about the membership of values within the dataset. FSs take on the default value when generated, but individual FSs may be altered.
4) Precision: The precision of all calculations (e.g. mem-bership values, alpha-cuts, type-reduced results and measures) are given to the number of decimal places as set in the global_settings module. By default, this value is 4 but it can be easily altered.
5) Visualisations: Settings for the visualisations of FSs may be changed. These include the axis labels in figures and the colours used to represent FSs. Individual colours may be changed for two-dimensional figures or colour schemes may be chosen for three-dimensional figures.
This concludes the overview of the features of the new toolkit fuzzycreator. Note that the toolkit is provided with an API that gives a detailed view of all modules, classes and functions within the toolkit. In addition, the toolkit also contains coded examples of each of the features detailed within this section, and also contains documentation detailing formulae and references of all measures implemented.
IV. CONCLUSIONS
This paper has presented a new cross-platform, python-based toolkit called fuzzycreator (available online at https:// bitbucket.org/JosieMcCulloch/fuzzycreator) that facilitates the automatic generation of FSs from data and their comparison through measures. As there are a multitude of methods of con-structing FSs from data and analysing them through measures it is important to have the tools to facilitate them. It is open-source under the GNU General Public License and is free for use in any work when referencing this paper. It is intended that the toolkit will continue to grow after this initial publication, with more methods of FS generation and comparisons through measures being developed.
This paper has provided a brief overview whilst further details can be found within the toolkit itself. This includes API documentation detailing all modules, classes and func-tions, and measures documentation providing the formulae and references for all measures implemented. In addition to this, to help new users quickly familiarise themselves with the code, the toolkit provides a collection of coded examples showing how to use each feature. These include examples of creating basic FSs, generating FSs from data, and demonstrating the effects of the global settings on the system.
REFERENCES
[1] S. Medasani, J. Kim, and R. Krishnapuram, “An overview of mem-bership function generation techniques for pattern recognition,” Interna-tional Journal of Approximate Reasoning, vol. 19, no. 3–4, pp. 391–417, 1998.
[2] C. Wagner, S. Miller, J. Garibaldi, D. Anderson, and T. Havens, “From Interval-Valued Data to General Type-2 Fuzzy Sets,”Fuzzy Systems, IEEE Transactions on, vol. 23, pp. 248–269, Apr. 2015.
[3] J. Garibaldi and R. John, “Choosing membership functions of linguistic terms,” inFuzzy Systems, 2003. FUZZ ’03. The 12th IEEE International Conference on, vol. 1, pp. 578–583, 2003.
[4] J. Alcal´a-Fdez and J. M. Alonso, “A Survey of Fuzzy Systems Software: Taxonomy, Current Research Trends, and Prospects,”IEEE Transactions on Fuzzy Systems, vol. 24, pp. 40–56, Feb 2016.
[5] J. Mendel,Uncertain rule-based fuzzy logic systems: introduction and new directions. Prentice Hall PTR, 2001.
[6] J. Mendel and R. John, “Type-2 fuzzy sets made simple,”Fuzzy Systems, IEEE Transactions on, vol. 10, pp. 117–127, Apr. 2002.
[7] C. Wagner and H. Hagras, “Toward General Type-2 Fuzzy Logic Systems Based on zSlices,” Fuzzy Systems, IEEE Transactions on, vol. 18, pp. 637–660, Aug. 2010.
[8] N. Karnik, Q. Liang, F. Liu, D. Wu, J. Jhoo., and J. Mendel, “Type-2 fuzzy logic software (freeware),” 2008.
[9] F. Liu and J. Mendel, “Encoding Words Into Interval Type-2 Fuzzy Sets Using an Interval Approach,” Fuzzy Systems, IEEE Transactions on, vol. 16, no. 6, pp. 1503–1521, 2008.
[10] C. Wagner, S. Miller, and J. Garibaldi, “A fuzzy toolbox for the R programming language,” inFuzzy Systems (FUZZ), 2011 IEEE Interna-tional Conference on, pp. 1185–1192, June 2011.
[11] C. Wagner, “Juzzy-a java based toolkit for type-2 fuzzy logic,” in Ad-vances in Type-2 Fuzzy Logic Systems (T2FUZZ), 2013 IEEE Symposium on, pp. 45–52, IEEE, 2013.
[12] C. Wagner, M. Pierfitt, and J. McCulloch, “Juzzy online: An online toolkit for the design, implementation, execution and sharing of type-1 and type-2 fuzzy logic systems,” in2014 IEEE International Conference on Fuzzy Systems (FUZZ-IEEE), pp. 2321–2328, IEEE, 2014. [13] J. M. Alonso, L. Magdalena, and S. Guillaume, “KBCT: A knowledge
extraction and representation tool for fuzzy logic based systems,” in Fuzzy Systems, 2004. Proceedings. 2004 IEEE International Conference on, vol. 2, pp. 989–994, IEEE, 2004.
[14] S. Guillaume and B. Charnomordic, “Learning interpretable fuzzy inference systems with FisPro,”Information Sciences, vol. 181, no. 20, pp. 4409–4427, 2011. Special Issue on Interpretable Fuzzy Systems. [15] I. Baturone, F. J. Moreno-Velo, S. S´anchez-Solano, ´A. Barriga, P. Brox,
A. A. Gersnoviez, and M. Brox, “Using Xfuzzy environment for the whole design of fuzzy systems,” in Fuzzy Systems Conference, 2007. FUZZ-IEEE 2007. IEEE International, pp. 1–6, IEEE, 2007.
[16] G. Castellano, “FISDeT: Fuzzy Inference System Development Tool,” International Journal of Computational Intelligence Systems, vol. 10, jan 2017.
[17] D. P. Pancho, J. M. Alonso, and L. Magdalena, “Quest for interpretability-accuracy trade-off supported by fingrams into the fuzzy modeling tool GUAJE,”International Journal of Computational Intelli-gence Systems, vol. 6, no. sup1, pp. 46–60, 2013.
[18] G. J. Klir and B. Yuan, Fuzzy Sets and Fuzzy Logic: Theory and Applications. Upper Saddle River, NJ, USA: Prentice-Hall, Inc., 1995. [19] V. V. Cross and T. A. Sudkamp,Similarity and compatibility in fuzzy set theory: assessment and applications, vol. 93. Springer Science & Business Media, 2002.
[20] J.-S. Yao and K. Wu, “Ranking fuzzy numbers based on decomposition principle and signed distance,”Fuzzy Sets and Systems, vol. 116, no. 2, pp. 275–288, 2000.
[21] J. C. Figueroa-Garc´ıa, Y. Chalco-Cano, and H. Rom´an-Florez, “Distance measures for Interval Type-2 fuzzy numbers,”Discrete Applied Mathe-matics, vol. 197, pp. 93–102, 2015.
[22] A. Blanco-Fern´andez, M. Casals, A. Colubi, N. Corral, M. Garc´ıa-B´arzana, M. Gil, G. Gonz´alez-Rodr´ıguez, M. L´opez, M. Lubiano, M. Monteneg, A. Ramos-Guajardo, S. d. l. R. de S´aa, and B. Sinova, “A distance-based statistical analysis of fuzzy number-valued data,” Interna-tional Journal of Approximate Reasoning, vol. 55, no. 7, pp. 1487–1501, 2014.
[23] N. Karnik and J. Mendel, “Centroid of a type-2 fuzzy set,”Information Sciences, vol. 132, pp. 195–220, Feb. 2001.
[24] J. McCulloch, C. Wagner, and U. Aickelin, “Measuring the directional distance between fuzzy sets,” in Computational Intelligence (UKCI), 2013 13th UK Workshop on, pp. 38–45, 2013.
[25] P. Jaccard, “The distribution of the flora in the alpine zone. 1,”New phytologist, vol. 11, no. 2, pp. 37–50, 1912.
[26] A. L. Ralescu and D. A. Ralescu, “Probability and fuzziness,” Informa-tion Sciences, vol. 34, no. 2, pp. 85–92, 1984.
[27] E. Sanchez, “Inverses of fuzzy relations. Application to possibility distributions and medical diagnosis,” Fuzzy sets and systems, vol. 2, no. 1, pp. 75–86, 1979.