The study is supplemented by appendices
covering:
• A comparison of HA lettings to BME
households and Census data in each
English local authority area;
• HAs’ lettings, employment and
governance statistics in relation to BME
communities.
The appendices should be used by HAs in
analysing their own performance and will
be updated on an annual basis, including
2001 Census data as it becomes available.
Data limitations
The categories used to collect data on BME
communities vary between different
sources, causing difficulties in comparing
data. This reflects more than simple
differences in group names. For example,
Irish communities, which are covered by the
Housing Corporation’s BME housing policy,
are classified as ‘white’ rather than BME
groups in many data sources. This not only
hides their needs but understates the extent
of BME needs more generally.
The broad categories often used to present
data imply a homogeneity which may not
exist. For example, the needs and
expectations of different Asian communities
can be overlooked when they are discussed
as one group. There are also clear gender
differences in the educational and labour
market performance of some ethnic groups,
which should be remembered when data on
different groups is analysed.
Introduction
Awareness of the need for housing
associations (HAs) to address the
inequalities faced by Black and Minority
Ethnic (BME) households has been
heightened by a number of key events in
recent years:
• The Housing Corporation’s BME housing
policy, launched in 1998;
• The Report of the Lawrence Inquiry in
1999 and its emphasis on the dangers of
organisations failing to review practice;
• The Race Relations Amendment Act
2000 which places an enforceable duty
on the Housing Corporation to promote
racial equality and prevent racial
discrimination, which it can most
effectively meet through the work of
HAs;
• The publication of the Challenge Report
in 2001 from the Race and Housing
Inquiry and its emphasis on the need for
continuous improvement in HAs’ race
equality work;
• The Housing Corporation’s new
regulatory code with its emphasis on race
equality issues and the importance of
continuous improvement in performance.
The aim of this Sector Study is to provide
key facts relating to BME communities
which are of relevance to housing providers
and others; and to provide a tool for those
involved in service delivery and policy
formulation to review and improve their
performance.
ss
ee
cc
ttoo
rr
ss
ttuu
dd
yy
11
23
4
Population
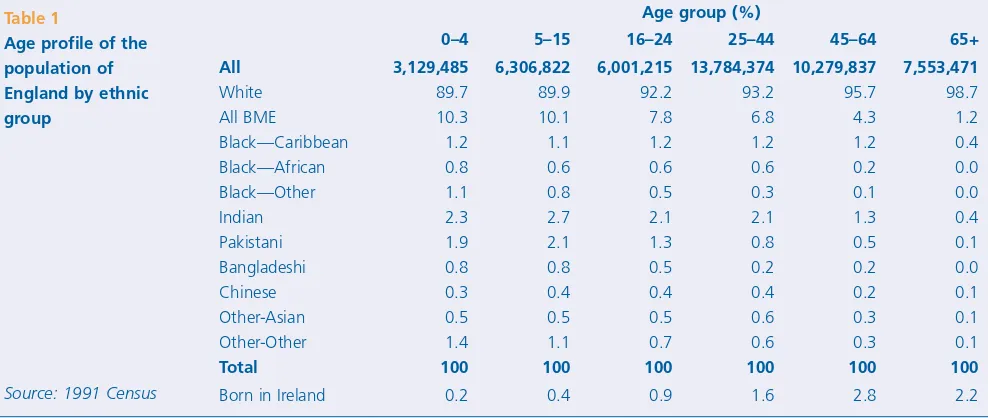
Table 1 shows the age profile of the
population in England by ethnic group.
• 6.2% of the population and 4.5% of the
households in England were recorded as
being from a BME group by the 1991
Census.
• Official national statistics estimate that
the BME percentage of the population of
England had increased to 7.3% by 1998.
• 1.6% of the population were ‘born in
Ireland’ according to the 1991 Census.
This was 2.2% of all households.
1These
are not included in the BME percentages
above.
The BME population is relatively young,
which will lead to a growth in the
percentage of the workforce from BME
backgrounds. For example, 12% of primary
school children and 11% of secondary
school children in England, are from BME
groups. The most youthful ethnic groups
are Bangladeshis, Pakistanis, Black Other
and Other Other (the largest numbers in
this group are from Arab backgrounds
including North African and from Iranian,
Turkish and other Middle Eastern origins).
Over time increasing proportions of people
above pensionable age will be from BME
households. Whilst only 1.2% of the current
population over 65 is from a BME
background, the percentages of BME
people increase steadily from 4.3% of the
45–64 population to 10.3% of the 0–4
population. Migration patterns and death
rates will have some effect on these figures
and will clearly directly affect the ‘born in
Ireland’ figures. Housing providers will need
to respond to a more diverse older population
in the future and will want to assess how
far there are ethnic differences in demand.
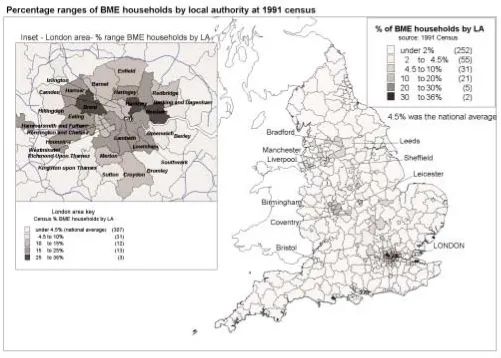
Figure 1 shows the distribution of the BME
population throughout England at the time
of the 1991 Census.
There are large regional variations in the
ethnic composition of the population and
wide diversity in the distribution of each
BME community. However, BME populations
are generally concentrated in the most
populous and urban areas of England. In
particular this concentration is in Greater
London and to a lesser extent the West
Midlands, although BME communities are
present in almost all local authority areas.
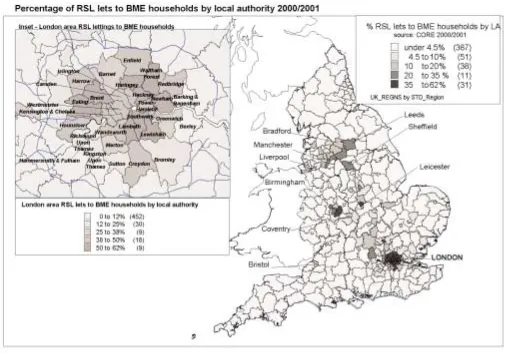
Figure 2 shows the distribution of HA
lettings to BME households (12.15%
nationally). It shows that lettings are
concentrated in local authority areas of
above average BME population. 320 local
authorities have a higher percentage of HA
lets to BME households than the percentage
of BME households recorded by the 1991
Census.
In 46 local authorities the percentage is
Sector Study 11
BME communities: key data
[image:2.595.52.546.591.800.2]1 Data are only available from the 1991 Census on people born in Ireland rather than people who con-sider their ethnic group to be Irish.
Table 1
Age profile of the population of England by ethnic group
Age group (%)
0–4 5–15 16–24 25–44 45–64 65+
All 3,129,485 6,306,822 6,001,215 13,784,374 10,279,837 7,553,471
White 89.7 89.9 92.2 93.2 95.7 98.7 All BME 10.3 10.1 7.8 6.8 4.3 1.2 Black—Caribbean 1.2 1.1 1.2 1.2 1.2 0.4 Black—African 0.8 0.6 0.6 0.6 0.2 0.0 Black—Other 1.1 0.8 0.5 0.3 0.1 0.0 Indian 2.3 2.7 2.1 2.1 1.3 0.4 Pakistani 1.9 2.1 1.3 0.8 0.5 0.1 Bangladeshi 0.8 0.8 0.5 0.2 0.2 0.0 Chinese 0.3 0.4 0.4 0.4 0.2 0.1 Other-Asian 0.5 0.5 0.5 0.6 0.3 0.1 Other-Other 1.4 1.1 0.7 0.6 0.3 0.1
Total 100 100 100 100 100 100
Born in Ireland 0.2 0.4 0.9 1.6 2.8 2.2
Figure 1: Percentage ranges of BME households by local authority at 1991 Census
lower, but in only one case by more than 1
percentage point. The largest number of HA
lettings where the percentage made to BME
households is below the Census BME
percentage is in North Tyneside, Cotswold,
North Wiltshire and Suffolk Coastal districts.
Appendix 1 outlines the percentage of BME
households living in each local authority
area and the percentage of HA lettings they
received.
Language
A number of established BME communities
will require HAs to provide interpreters
and/or translations. The Fourth PSI survey
(1994) recorded between a fifth and a
quarter of Indian, Pakistani, Bangladeshi
and Chinese men who did not speak
English fluently or fairly well. Gender is an
important differentiating factor. For women
figures were generally higher, reaching 60%
for Bangladeshi women. In addition, figures
reflect age on arrival in England and the
number of other households from the same
community in a particular neighbourhood.
Demand for language services should be
kept under review, particularly because the
arrival of asylum seekers and refugees can
bring new interpreting and translation
requirements.
Sources of further information
• Modood, T., Berthoud, R. et al. (eds.)
1997:
Ethnic Minorities in Britain:
diversity and disadvantage. The Fourth
National Survey of Ethnic Minorities.
London: PSI.
• Owen, D. 1992:
Ethnic Minorities in
Great Britain: settlement patterns. 1991
Census Statistical Paper No. 1
. Coventry:
CRER, University of Warwick.
1991 Census. Volume Three: social
geography and ethnicity in Britain:
geographical spread, spatial
concentra-tion and internal migraconcentra-tion.
London:
HMSO. http://www.statistics.gov.uk
• Performance and Innovation Unit 2001:
Improving labour market achievements
for ethnic minorities in British society
Scoping Note
http://www.cabinetoffice.gov.uk/
innovation/2001/ethnicity/scope.shtml
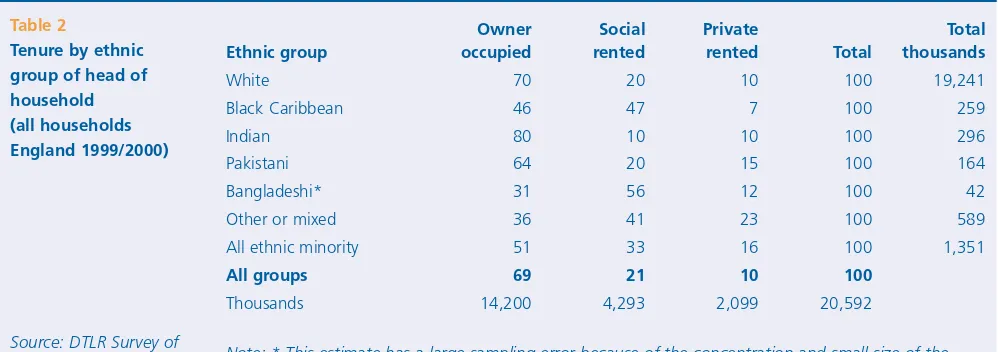
Housing
The Survey of English Housing (2000) shows
that the percentage of white households
living in owner-occupied property is far
higher than the percentage for all BME
households (Table 2). However, the situation
is more complex once broad groupings are
broken down.
• Disproportionate to their numbers in the
population, Indian households are more
likely to be owner-occupiers than all
other ethnic groups, including ‘white’.
• Irish people (included within the ‘white’
group), are under-represented in owner
occupied housing compared with their
numbers in the population.
• 56% of Bangladeshi households occupy
social housing, the highest percentage
for the ethnic groups shown, and
compared with just 20% of white
households.
• Black Caribbean and ‘Other or mixed’
ethnic groups were also highly
represented in the social rented sector.
High levels of owner-occupation in some
BME groups does not necessarily reflect
greater wealth. BME households are most
likely to be living in the poorest quality
housing in each tenure. Table 3 shows they
[image:4.595.44.549.117.470.2]are also most likely to be living in the most
deprived wards, irrespective of tenure. This
is particularly true for the Pakistani and
Bangladeshi groups and to a lesser extent
the Black Caribbean group.
BME households are, in addition, more likely
to be overcrowded. The Survey of English
Housing shows over 25% of Bangladeshi
and 20% of Pakistani households are
overcrowded.
2That compares with 8% of
Indian households, 7% of African Caribbean
households and 1% of white households.
Homelessness
There is no reliable national data on the
levels of homelessness amongst BME
communities. However, individual studies
have indicated BME households are
over-represented within many categories of
homelessness, although they are far less
likely to be visibly roofless than white
households, possibly because of fear of
racial attack. Consequently they are more
likely to have temporary refuge with others
from their own community. This frequently
leads to overcrowding.
In London, BME households have been
shown to be highly over-represented
amongst the statutory homeless and the
hidden homeless, although the
inconsistency of ethnic monitoring by the
boroughs has restricted analysis.
[image:5.595.49.548.75.251.2]The report ‘A Question of Delivery’ found
that two-fifths of BME tenants newly
housed by HAs had been either statutorily
or non-statutorily homeless, compared with
just over a quarter of all tenants. The
experience of Irish households was closer to
other BME populations than the white
group as a whole. There was little difference
in the percentages between BME groups
previously homeless except for the Black
African ethnic group. Half of new Black
African tenants had been homeless.
Table 2Tenure by ethnic group of head of household (all households England 1999/2000)
Owner Social Private Total
Ethnic group occupied rented rented Total thousands
White 70 20 10 100 19,241 Black Caribbean 46 47 7 100 259 Indian 80 10 10 100 296 Pakistani 64 20 15 100 164 Bangladeshi* 31 56 12 100 42 Other or mixed 36 41 23 100 589 All ethnic minority 51 33 16 100 1,351
All groups 69 21 10 100
Thousands 14,200 4,293 2,099 20,592
Note: * This estimate has a large sampling error because of the concentration and small size of the Bangladeshi population.
Source: DTLR Survey of English Housing 1999/2000
Ethnic group of Owner Social Private All
head of household occupied rented rented households
White 9 31 16 14
Black Caribbean 35 51 * 44
Indian 18 57 13 22
Pakistani 55 54 * 54
Bangladeshi 50 * * 51
Other or mixed 21 53 23 35 All ethnic minorities 28 53 26 36
Note: * Unweighted base was too small. Table 3
Percentages of households living in the 10% most deprived wards in England by tenure and ethnicity (all households England 1999/2000)
Sources of further information
• Carter, S. 1998:
Hidden Crisis: A study of
black and minority ethnic homelessness
in London.
London: Frontline Housing
Advice.
• Chahal, K. 1999:
Minority Ethnic
Homelessness in London.
NHS Executive,
London Regional Office.
• 1999/2000 Survey of English Housing
www.housing.dtlr.gov.uk/research/seh/
seh00/index.htm
• Hickman, M. J. and Walter, B. 1997:
Discrimination and the Irish Community
in Britain.
London: CRE.
• Tomlins, R. with Brown, T., Duncan, J.,
Harrison, M. L., Johnson, M. R. D., Line,
B., Owen, D., Phillips, D. and Ratcliffe, P.
2001:
A Question of Delivery: an
evaluation of how RSLs meet the needs
of black and minority ethnic
communities.
London: Housing
Corporation.
Crime and criminal justice
Victims of crime
Housing providers should expect to find
themselves responding to the greater risk of
crime experienced by BME households
which is demonstrated in Table 4.
It is important to note that BME groups also
tend to be far more worried about all types
of crime than white groups. This may reflect
the location of their home.
The level of racial incidents remains high,
although the 2000 British Crime Survey
(BCS) estimated that there had been a fall
from 382,000 in 1995 to 280,000 in 1999.
Areas with the highest increases in recorded
incidents by the police have included West
Mercia (459%) and Devon and Cornwall
(364%) where there are relatively small BME
populations. This may of course reflect
improved recording practice rather than
simply an increase in the number of
incidents.
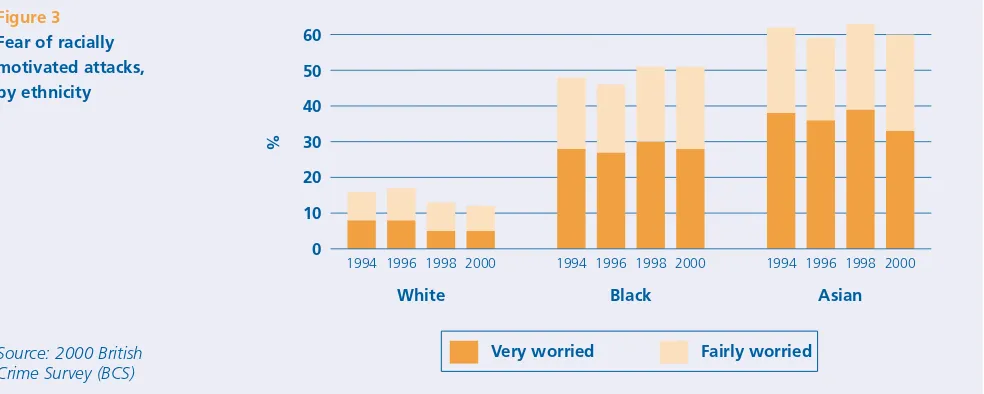
The housing experience of BME households
may be affected not only by racial
harassment, but also by the fear of racial
harassment. In the BCS (see Figure 3), 60%
of Asians and 51% of Blacks said that they
were very worried or fairly worried about
racially motivated attacks. Only 12% of
white people expressed the same concern.
Ex-offenders
HAs need to ensure that their work on
housing ex-offenders through direct
applications and referrals to hostels and
general housing reflects the
disproportionate numbers of male and
female prisoners from BME backgrounds.
% victims once or more Indian/
White Black1 Pakistani Bangladeshi
Burglary 2 4.2 6.3 6.3 5.2
With entry 4.4 3.9 3.6 2.9 Attempts 1.9 2.8 2.8 2.5
Vehicle-related thefts 3 12.5 17.2 14.4 16.1
Theft of a vehicle 1.8 2.4 2.7 3.8 Theft from a vehicle 8.0 10.5 9.3 9.8 Attempted vehicle theft 3.7 5.1 3.5 3.5
Violence 4.3 5.4 3.6 4.9
Domestic 0.8 1.0 0.4 0.8 Acquaintance 1.6 2.1 1.4 1.2 Stranger 1.5 1.2 0.6 1.4 Mugging 0.6 1.6 1.5 1.6
Notes:
1 The Black group consists of respondents who describe themselves Black-Caribbean, Black-African or Black-Other.
2 Burglary risks based on households.
3 Vehicle theft risks based on vehicle owning households and violence based on adults. Table 4
Percentages of households/adults victims of burglary/ vehicle-related thefts/violence in 1999, by ethnicity
Source: 2000 British Crime Survey (BCS)
Sector Study 11
Figure 3 Fear of racially motivated attacks, by ethnicity
Source: 2000 British Crime Survey (BCS)
%
1994
White 60
50 40 30 20 10 0
1996 1998 2000 1994
Black
1996 1998 2000 1994
Asian
1996 1998 2000
Very worried Fairly worried
The proportion of BME prisoners of British
Nationality has increased between 1994 and
1999. In 1999, 14.3% of British male
prisoners were of BME origin consisting of
10.2% Black prisoners, 2.3% Asian
prisoners and 1.8% of other ethnic origin.
Higher proportions of British female
prisoners were of BME origin.
Sources of further information
• Kershaw, C., Budd, T., Kinshott, G.,
Mattinson, J., Mayhew, G. and Myhill, A..
2000:
The 2000 British Crime Survey
England and Wales, Home Office
Statistical Bulletin 18/00
• Research, Development and Statistics
Directorate 2000:
Statistics on Race and
the Criminal Justice System 2000.
London: Home Office.
http://www.homeoffice.gov.uk/rds/pdfs/
s95race00.pdf
Ethnic origin 1992 % 1996 % 2000 % % change
White 37 45 50 35.1
Black 23 23 37 60.9
Asian 33 38 49 48.5
Indian 38 48 62 63.2
Pakistani 26 23 30 15.4 Bangladeshi 14 25 30 114.3 Other Asian (including Chinese/Vietnamese) 46 61 70 52.2 Other ethnic group * 46 43 – Not stated 18 29 26 44.4
Table 5
Attainment of 5 or more GCSE grades A*–C in year 11: 1992–2000
Source: Young Cohort Study: The Activities and Experiences of 16 year olds: England and Wales 2000 (DfEE 23 January 2001)
Education
Other Asians (which include Chinese and
Vietnamese households) outperform any
other group in attaining 5 or more GCSE
grades A*–C with a 70% success rate in
2000. However, it is Bangladeshi students
that have seen the greatest improvement in
performance with the percentage of
16 year olds achieving 5 or more GCSE
grades A*–C more than doubling between
1992 and 2000. Indian and Black groups
have also recorded large gains. The
results for Pakistani students remain
relatively low and have shown slower
improvement than for other groups as
Table 5 demonstrates.
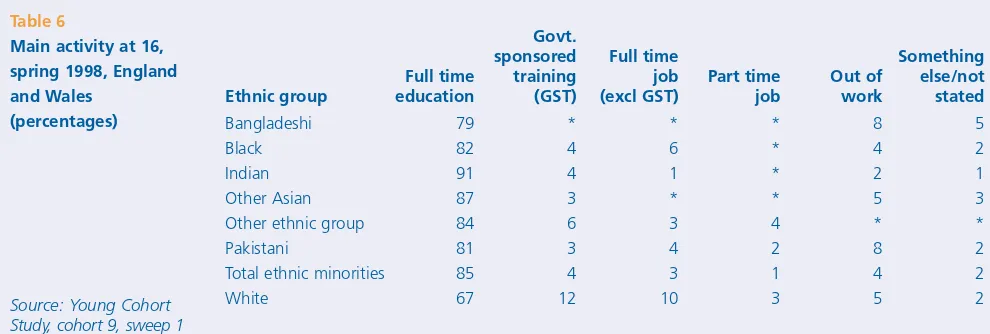
Table 6 shows that young BME people are
far more likely to be in full time education
at 16. White groups are most likely to be on
government sponsored training schemes or
in full time work. Pakistani and Bangladeshi
groups are most likely not to be in
education, training or employment.
Similarly, they are the least likely to have
any formal qualifications at 18.
At higher degree level differences in
outcomes also exist. Generally BME groups
are more likely to go on to University, but
less likely to achieve first or second class
honours degrees.
Sources of further information
• Modood, T., Berthoud, R. et al. (eds.)
1997:
Ethnic Minorities in Britain:
diversity and disadvantage. The Fourth
National Survey of Ethnic Minorities.
London: PSI.
• Pathak, S. 2000:
Race Research for the
Future: Ethnicity in Education, Training
and the Labour Market, Research Topic
Paper.
London: DfES.
•
Youth Cohort Study: The Activities and
Experiences of 16 year olds: England and
Wales 2000
(DfEE 23 January 2001)
www.dfee.gov.uk/statistics/DB/SFR
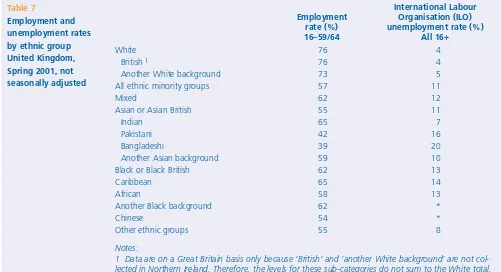
Employment and unemployment
Table 7 shows that Bangladeshi and
Pakistani groups experience the highest
rates of unemployment. All BME groups
experience higher levels of unemployment
than white groups with only Indian and
other ethnic groups falling below 10%.
However, it should be noted that within the
white categories Irish men experience
higher then average levels of
unemployment.
Educational attainment is a factor in these
outcomes. However, Pakistani, Bangladeshi
and Caribbean people are more likely to be
unemployed than white, Indian, African and
Asian people given the same level of
qualification, although the gap is far less for
Caribbean women than for Caribbean men.
In particular, Caribbean men educated to
A-level standard are more than twice as
likely to be unemployed as white men with
similar qualifications.
Whilst all groups showed lower economic
activity rates for women this was most
noticeable for the Pakistani and Bangladeshi
groups.
The inequalities faced by BME
communities also have an impact on wage
levels. The Fourth PSI survey highlighted
that 80% of Pakistanis and Bangladeshis
and 37% of BME households overall were
earning less than half the average national
salary.
The percentage of BME staff employed in
the HA sector has increased significantly
over the last decade. However, BME staff
remain under-represented at senior
organisational levels and on the governing
boards of HAs and are most highly
represented at junior management, clerical
and secretarial levels. This is despite
frequently being more qualified than their
white colleagues in higher grades.
Sector Study 11
BME communities: key data
Govt.
sponsored Full time Something
Full time training job Part time Out of else/not
Ethnic group education (GST) (excl GST) job work stated
Bangladeshi 79 * * * 8 5
Black 82 4 6 * 4 2
Indian 91 4 1 * 2 1
Other Asian 87 3 * * 5 3 Other ethnic group 84 6 3 4 * * Pakistani 81 3 4 2 8 2 Total ethnic minorities 85 4 3 1 4 2
[image:8.595.49.544.627.794.2]White 67 12 10 3 5 2
Table 6
Main activity at 16, spring 1998, England and Wales
(percentages)
Health
At present there is no single or simple
source of national data on ethnicity and
health. Much of the information that is
available also remains based on country of
birth rather than ethnicity.
Nevertheless, a number of reports identify
areas of concern. For example, the Fourth
PSI survey found that the African Caribbean
community is twice as likely, and the
Pakistani community one and half times as
likely, to report themselves to be in ill health
as white people.
Housing conditions clearly have health
implications. For example, overcrowding is
connected to stress, infectious (notably
respiratory) disease, mental illness and
accidents. Key health issues affecting
housing demand, design and the need for
aids and adaptations include:
Asthma
There is no UK based survey data which
indicates a clear ethnic variation in the
prevalence of this disease. However, a
The data for individual HAs can be seen in
Appendix 2
Sources of further information
•
DSS, Family Resources Survey Great
Britain 1999–2000
• Hickman, M. J. and Walter, B. 1997:
Discrimination and the Irish Community
in Britain.
London: CRE.
• Social Exclusion Unit 2000:
Minority
Ethnic Issues in Social Exclusion and
Neighbourhood Renewal.
London: Social
Exclusion Unit. http://www.cabinetoffice.
gov.uk/seu/2000/bmezip/default.htm
• Somerville, P., Sodhi, D. and Steele, A.
2000:
A Question of Diversity: black and
minority ethnic staff in the RSL sector.
London:
Housing Corporation.
www.statistics.gov.uk/downloads/
theme_labour/LMT_September01.pdf
• Tomlins, R. with Brown, T., Duncan, J.,
Harrison, M. L., Johnson, M. R. D., Line,
B., Owen, D., Phillips, D. and Ratcliffe, P.
2001:
A Question of Delivery: an
evaluation of how RSLs meet the needs
of black and minority ethnic
[image:9.595.47.548.79.351.2]communities.
London: Housing
Corporation.
Table 7
Employment and unemployment rates by ethnic group United Kingdom, Spring 2001, not seasonally adjusted
International Labour Employment Organisation (ILO)
rate (%) unemployment rate (%)
16–59/64 All 16+
White 76 4
British 1 76 4
Another White background 73 5 All ethnic minority groups 57 11
Mixed 62 12
Asian or Asian British 55 11
Indian 65 7
Pakistani 42 16
Bangladeshi 39 20
Another Asian background 59 10 Black or Black British 62 13
Caribbean 65 14
African 58 13
Another Black background 62 *
Chinese 54 *
Other ethnic groups 55 8
Notes:
1 Data are on a Great Britain basis only because ‘British’ and ‘another White background’ are not col-lected in Northern Ireland. Therefore, the levels for these sub-categories do not sum to the White total. * Sample size too small for reliable estimate.
This table uses the National Statistics interim standard classification of ethnic groups and notes that previous published estimates should not be used for comparisons.
All data in the table is provisional due to “bedding in” of the new categories. Source: Labour Force
Doncaster health needs survey reported that
Pakistani respondents were twice as likely to
report having asthma. This raises concerns
about inadequate central heating and dust
and damp.
Coronary heart disease (CHD) and
hypertension
Mortality data show that those born in
South Asia are about 20% more likely to
die of CHD than the ‘average’ population of
men and women aged 20–70. Other
estimates suggest higher rates, particularly
among diabetics.
The pattern for those born in the West
Indies or other sources of BME migration
does not show such a difference in respect
of heart attack/angina. However, Black
people of African-Caribbean origin are
significantly more at risk of stroke, and high
blood pressure conditions. Both may have
an impact on housing need through
concerns about accessibility using stairs.
Cancer
There seems to be a lower incidence of
most forms of cancer among BME groups.
Bangladeshi men appear to be at high risk
of gall bladder and liver cancers, and high
rates of mouth cancers are found in men
and women of Bengali origin. Housing
issues relate primarily to palliative care and
carer accommodation, as at present there
are low rates of uptake of hospice care
amongst BME communities.
Renal failure (kidney disease)
The risk of requiring dialysis treatment
(and/or transplant surgery) among people of
Asian origin is nearly fourteen times that for
white groups. Overall, the relative risk of
renal failure in both the Black and Asian
populations compared to the white
population is about three-fold, rising with
age. This may affect the need for space or
facilities for dialysis in the home.
Tuberculosis (TB)
There is some controversy over the observed
association between Tuberculosis and BME
groups — most specifically with those of
South Asian origin. While relatively high
rates of infection have been reported, it is
not clear to what extent this represents
‘imported’ disease among migrants and
visitors to the Indian subcontinent, poverty,
some genetic susceptibility to
non-respiratory forms of the disease or poor
housing conditions in the UK such as damp
and over-crowding. Refugees also have
relatively high risks of having TB.
Thalassaemia and Sickle Cell
These conditions are generally regarded as
‘ethnic-specific’ diseases. Thalassaemia is
associated with populations of South Asian
and Mediterranean origin, while Sickle Cell
is mostly found among people of West
African or African-Caribbean descent. Cold
and stressful conditions exacerbate the
condition; good central heating is essential.
Systemic Lupus Erythematosus (SLE or
‘Lupus’)
Another ‘ethnic-specific’ disease, Lupus is
also found among the white population,
but it affects women much more often than
men, and black and Asian women more
than white women. It often presents as
unexplained pain and weakness, and may be
alleviated by warmth and absence of stress.
Mental health
HAs involved in meeting the growing
demands for community-based facilities,
day care, and ‘half-way’ discharge homes
for people leaving institutional mental care
should be aware that the provision of
mental health services is highly
controversial.
There is an over-representation of people of
African Caribbean origin as admitted
patients for schizophrenic illnesses and
concern regarding misdiagnosis. Asian and
African Caribbean groups are
under-represented as users of counselling and
other services for depression. There is also
increasing evidence that stress related to
racial harassment may be a health risk.
Accidents
There is some evidence that families, and
particularly children of BME origin are more
likely to require medical treatment arising
Sector Study 11
frequently no base data on expected levels
of need against which to make
comparisons. Access may be constrained or
affected by referral patterns. In other cases,
uptake is low because members of BME
communities perceive services as being
unresponsive to their needs, or
inappropriately provided. For some groups
bilingual support and information is an
essential requirement.
BME groups feel they are overlooked in
planning services, and that few services are
offered through organisations run by
members of their religious or cultural
community. Studies show high levels of
unmet needs arising from the more
frequent presence of children or people
with long-term limiting illness in BME
households. Assumptions are often made by
service providers that ‘they prefer to look
after their own’. This is not supported by
research and is discriminatory in terms of
resource allocation. The Health Survey for
England, and other studies, show lower
levels of social support among minority
families, and poorer access to support
groups.
Sources of further information
• Ahmad, W. and Atkin, K. (eds) 1996:
‘Race’ and Community Care.
Buckingham: Open University Press.
• Association of London Government
2000:
Sick of Being Excluded: Improving
the health and care of London’s black
and minority ethnic communities.
London: ALG.
• Butt, J. and Mirza, K. 1996:
Social Care
and Black Communities.
London: HMSO.
• Department of Health Social Care Group
and Social Services Inspectorate 1998:
They Look after their own, don’t they?:
Inspection of community care services for
black and ethnic minority older people.
London: DoH/SSI.
• Johnson M. R. D. et al 1996:
Local
Authority Occupational Therapy Services
and Ethnic Minority Clients, British
Journal of Occupational Therapy 59(3)
109–114.
from accidents in the home or near the
home. This is partly due to traffic patterns
in inner city areas, poverty and
overcrowding in the home.
Sources of further information
• Hill, D. and Penso, D. 1995:
Opening
Doors: Improving access to hospice and
specialist palliative care services by
members of the black and minority
ethnic communities Occasional Paper 7,
London: NCHSPCS.
• Nazroo, J. 1997:
The Health of Britain’s
Ethnic Minorities.
London: PSI.
• Nazroo, J. 1997:
Ethnicity and Mental
Health.
London: PSI.
• Pawar, A. 1998:
Equal Access to Safety.
Birmingham: Royal Society for the
Prevention of Accidents.
• Full details of the Health Survey for
England, including tables of data and the
text of report can be found on the
internet at:
www.doh.gov.uk/public/england.htm
• Current awareness bulletins about
developments in minority health are
exchanged on the mail-list
‘minority-ethnic-health’. This can be joined by
registering through the JISCMAIL site at:
www.jisc.ac.uk
Social services
The social care sector in general produces
few national estimates of levels of need and
service use by ethnicity, although there are
reports on the numbers of ‘looked after’
children in care, and specialist reports into
the uptake of specific care services (such as
learning disability and services for older
people).
Overall, the consistent conclusion of all local
studies has been that there is a lack of
knowledge about services among vulnerable
groups in the BME population, and relatively
low uptake. The potential demand for HAs
to make good these gaps in service
provision or act as a referral agency is,
therefore, large.
23
4
Conclusion
The key facts outlined above identify the
continuing inequalities faced by BME
communities. Different ethnic groups
experience varying trends, but overall
inequality remains deep rooted requiring
HAs to look at the responsiveness of their
housing services and also to look beyond
housing at their wider role in the
neighbourhoods in which they work.
The Appendices below provide some data
on the work of HAs. Appendix 1 focuses on
the lettings to BME households in each
English local authority area. Appendix 2
shows the percentage of BME staff and
BME members of the governing body for
each association, as well as its percentage
of lettings to BME households.
Additional information
This report was researched and written for
the Housing Corporation by Richard Tomlins
and David James, De Montfort University,
The Gateway, Leicester LE1 9BH.
Further information on the Sector Studies
series can be obtained from Siobhan
McHugh, Sector Analyst, Regulation
Division, on 020 7394 2024 or e-mail
Sector Study 11
Local authority name % BME No. % BME at 1991 Census households of lets lettings
Adur 0.8 66 3.0 Allerdale 0.3 1,003 0.6 Alnwick 0.1 96 0.0 Amber Valley 0.4 283 1.4 Arun 0.6 186 3.8 Ashfield 0.5 189 2.1 Ashford 1.2 184 3.8 Aylesbury Vale 2.8 122 11.5 Babergh 0.6 102 3.9 Barking and Dagenham 4.9 228 12.3 Barnet 14.3 442 37.3 Barnsley 0.4 289 4.2 Barrow-in-Furness 0.4 125 0.8 Basildon 1.7 513 2.5 Basingstoke and Deane 1.8 880 3.8 Bassetlaw 0.6 128 0.8 Bath1 1.9
Bath and NE Somerset1 967 4.1
Bedford2 1,206 17.7
Berwick-upon-Tweed 0.2 26 0.0 Bexley 4.3 1,061 10.8 Birmingham 14.4 4,059 42.6 Blaby 2.5 67 1.5 Blackburn 8.6 555 15.7 Blackpool 0.6 198 1.5 Blyth Valley 0.4 382 0.5 Bolsover 0.4 206 1.0 Bolton 5.1 852 10.1 Boothferry1 0.3
Boston 0.5 558 0.9 Bournemouth 1.2 174 1.7 Bracknell2 142 3.5
Bracknell Forest2 1.9
Bradford 8.7 1,605 18.6 Braintree 0.9 152 0.7 Breckland 0.8 811 1.9 Brent 36.0 587 62.9 Brentwood 1.5 90 1.1 Bridgnorth 0.4 65 0.0 Brighton1 2.2
Brighton and Hove1 468 9.0
Bristol 3.9 960 19.3 Broadland 0.6 424 1.4 Bromley 3.7 1,339 16.4 Bromsgrove 1.0 92 2.2 Broxbourne 1.5 121 3.3 Broxtowe 1.6 144 3.5 Burnley 3.0 828 4.5 Bury 2.4 580 10.5 Calderdale 2.4 568 16.0 Cambridge 4.1 303 10.6 Camden 13.1 467 41.8 Cannock Chase 0.6 220 1.8 Canterbury 1.2 114 2.6 Caradon 0.4 50 4.0 Carlisle 0.4 228 0.4 Carrick 0.4 108 1.9 Castle Morpeth 0.6 72 1.4 Castle Point 1.0 35 0.0 Charnwood 4.1 392 14.0 Chelmsford 1.6 231 7.4 Cheltenham 1.3 159 1.9
Local authority name % BME No. % BME at 1991 Census households of lets lettings
Cherwell 2.6 248 8.9 Chester 0.7 337 2.1 Chesterfield 0.9 219 3.7 Chester-le-Street 0.5 25 0.0 Chichester 0.5 268 1.1 Chiltern 1.4 256 4.7 Chorley 0.8 307 2.9 Christchurch 0.5 192 0.5 City of London 4.5 17 41.2 Cleethorpes1 0.6
Colchester 1.8 258 5.8 Congleton 0.5 436 0.7 Copeland 0.3 375 0.8 Corby 1.0 161 3.7 Cotswold 0.6 566 0.4 Coventry 7.9 1,548 15.6 Craven 0.4 82 0.0 Crawley 5.4 147 10.9 Crewe and Nantwich 0.9 193 2.1 Croydon 14.2 645 41.9 Dacorum 1.9 216 4.2 Darlington 1.1 256 2.3 Dartford 3.0 56 3.6 Daventry 0.7 173 1.2 Derby 6.5 1,240 16.7 Derbyshire Dales 0.3 51 0.0 Derwentside 0.3 227 0.9 Doncaster 1.2 525 2.1 Dover 0.6 286 3.2 Dudley 3.0 399 13.5 Durham 0.7 235 4.3 Ealing 23.8 465 55.1 Easington 0.4 343 0.3 East Cambridgeshire 0.7 396 1.5 East Devon 0.3 121 2.5 East Dorset 0.4 196 1.5 East Hampshire 0.7 448 1.1 East Hertfordshire 1.1 165 3.0 East Lindsey 0.4 680 0.6 East Northamptonshire 0.7 174 3.5 East Riding of Yorkshire1 279 1.4
East Staffordshire 2.5 198 4.0 East Yorks, B of Beverley1 0.7
East Yorkshire1 0.2
Eastbourne 1.3 198 3.0 Eastleigh 1.2 364 3.3 Eden 0.2 260 0.0 Ellesmere Port and Neston 0.5 76 2.6 Elmbridge 2.5 512 4.1 Enfield 11.3 621 49.4 Epping Forest 1.8 127 9.5 Epsom and Ewell 4.0 180 11.7 Erewash 1.0 135 3.0 Exeter 1.0 317 4.7 Fareham 0.7 101 5.9 Fenland 0.6 131 2.3 Forest Heath 4.4 76 6.6 Forest of Dean 0.2 200 0.5 Fylde 0.5 134 2.2 Gateshead 0.6 578 1.4 Gedling 1.9 174 4.6 Gillingham1 3.1
Local authority name % BME No. % BME at 1991 Census households of lets lettings
Medina1 0.5
Medway1 1,087 4.1
Melton 0.7 80 0.0 Mendip 0.3 232 1.3 Merton 12.6 290 26.2 Mid Bedfordshire 1.4 406 2.7 Mid Devon 0.4 144 2.8 Mid Suffolk 0.4 122 1.6 Mid Sussex 1.0 602 2.7 Middlesbrough 2.8 703 4.8 Milton Keynes 4.7 688 16.3 Mole Valley 0.9 41 2.4 New Forest 0.5 265 1.5 Newark2 305 1.3
Newark and Sherwood2 0.6
Newbury2 1.3
Newcastle upon Tyne 2.5 797 7.7 Newcastle-under-Lyme 0.8 1237 1.6 Newham 31.6 677 53.0 North Bedfordshire2 6.8
North Cornwall 0.4 155 1.3 North Devon 0.4 286 0.7 North Dorset 0.4 451 1.1 North East Derbyshire 0.4 98 2.0 North East Lincolnshire1 305 0.7
North Hertfordshire 3.8 142 7.8 North Kesteven 0.5 69 4.4 North Lincolnshire1 273 2.2
North Norfolk 0.3 157 0.6 North Shropshire 0.4 95 0.0 North Somerset2 140 2.1
North Tyneside 0.8 829 0.6 North Warwickshire 0.5 86 3.5 North West Leicestershire 0.5 209 3.8 North Wiltshire 0.9 487 0.6 Northampton 4.5 398 13.6 Northavon1 0.9
Norwich 1.1 428 2.3 Nottingham 7.7 1,354 20.3 Nuneaton & Bedworth 2.6 170 1.8 Oadby & Wigston 5.8 22 9.1 Oldham 4.6 801 22.5 Oswestry 0.3 30 3.3 Oxford 6.3 263 16.7 Pendle 5.2 352 5.7 Penwith 0.4 374 2.9 Peterborough1 4.9 676 10.4
Plymouth 0.7 818 1.8 Poole 0.7 142 0.7 Portsmouth 1.7 527 6.1 Preston 6.2 912 10.9 Purbeck 0.4 55 0.0 Reading 6.9 263 18.6 Redbridge 14.7 198 42.9 Redcar and Cleveland2 560 1.6
Redditch 2.5 199 5.0 Reigate and Banstead 1.9 128 3.1 Restormel 0.4 332 1.5 Ribble Valley 0.6 69 0.0 Richmond Upon Thames 3.9 453 14.8 Richmondshire 0.6 49 0.0 Rochdale 4.5 820 14.0 Rochester upon Medway1 3.1
Rochford 0.8 122 0.8 Rossendale 1.4 167 4.8 Rother 0.6 353 2.0
Local authority name % BME No. % BME at 1991 Census households of lets lettings
Glanford1 0.5
Gloucester 4.7 263 14.5 Gosport 0.7 158 1.3 Gravesham 5.4 36 13.9 Great Grimsby1 0.8
Great Yarmouth 0.6 138 3.6 Greenwich 9.7 799 36.9 Guildford 1.4 127 5.5 Hackney 27.9 924 60.3 Halton 0.6 805 1.7 Hambleton 0.3 328 0.6 Hammersmith & Fulham 13.9 455 46.8 Harborough 0.7 78 1.3 Haringey 24.3 551 52.8 Harlow 2.6 107 6.5 Harrogate1 0.6 278 3.2
Harrow 19.5 158 43.0 Hart 1.0 135 3.0 Hartlepool 0.5 515 1.6 Hastings 1.4 735 3.1 Havant 0.7 345 0.3 Havering 2.4 145 4.8 Hereford1 0.7
Herefordshire, County of1 627 1.0
Hertsmere 3.0 527 6.8 High Peak 0.5 142 2.8 Hillingdon 8.7 450 24.0 Hinckley & Bosworth 0.9 111 1.8 Holderness1 0.3
Horsham 0.8 273 1.1 Hounslow 17.6 336 40.8 Hove1 2.4
Huntingdonshire1 1.8 498 4.0
Hyndburn 2.9 301 6.0 Ipswich 3.6 515 9.1 Isle of Wight1 567 2.1
Isles of Scilly 0.0 1 0.0 Islington 14.8 544 46.9 Kennet 0.6 558 1.1 Kensington and Chelsea 12.5 487 41.9 Kerrier 0.4 423 2.8 Kettering 1.8 177 4.5 King's Lynn and West Norfolk 0.6 284 0.4 Kingston upon Hull 1.0 894 2.1 Kingston upon Thames 6.4 208 16.4 Kingswood1 0.8
Kirklees 6.2 747 24.4 Knowsley 0.8 439 1.4 Lambeth 24.7 666 57.4 Lancaster 0.8 263 1.5 Langbaurgh-On-Tees2 0.5
Leeds 4.0 2,110 25.7 Leicester 19.3 1,897 44.5 Leominster1 0.2
Lewes 0.8 122 1.6 Lewisham 18.5 603 57.6 Lichfield 0.7 578 1.0 Lincoln 1.0 197 0.5 Liverpool 3.2 3,830 13.9 Luton 13.5 247 39.7 Macclesfield 0.8 215 1.9 Maidstone 1.3 116 3.5 Maldon 0.5 270 1.9 Malvern Hills1 0.4 395 0.8
Local authority name % BME No. % BME at 1991 Census households of lets lettings
Rotherham 1.2 637 2.4 Rugby 3.7 183 8.2 Runnymede 1.8 82 6.1 Rushcliffe 1.6 74 5.4 Rushmoor 2.0 442 4.5 Rutland 0.5 29 0.0 Ryedale1 0.3 247 1.2
Salford 1.6 872 8.1 Salisbury 0.6 230 2.6 Sandwell 9.6 832 28.7 Scarborough 0.4 289 0.4 Scunthorpe1 2.0
Sedgefield 0.3 221 0.5 Sedgemoor 0.4 230 2.2 Sefton 0.7 1,008 2.0 Selby1 0.3 191 3.7
Sevenoaks 0.8 547 2.4 Sheffield 3.5 1,191 20.3 Shepway 0.8 162 1.9 Shrewsbury & Atcham 0.6 132 0.8 Slough 18.7 328 37.5 Solihull 2.1 179 3.9 South Bedfordshire 1.5 117 7.7 South Buckinghamshire 2.1 268 4.5 South Cambridgeshire 1.0 149 2.0 South Derbyshire 1.1 125 1.6 South Gloucestershire1 266 2.6
South Hams 0.3 318 1.6 South Herefordshire1 0.3
South Holland 0.4 78 1.3 South Kesteven 0.7 149 0.7 South Lakeland 0.3 116 1.7 South Norfolk 0.3 168 1.2 South Northamptonshire 1.0 62 3.2 South Oxfordshire 0.8 487 3.3 South Ribble 0.7 630 2.4 South Shropshire 0.3 166 1.8 South Somerset 0.3 881 0.5 South Staffordshire 0.8 614 1.1 South Tyneside 1.2 506 1.8 South Wight1 0.4
Southampton 3.3 464 9.7 Southend-on-Sea 1.8 328 3.7 Southwark 19.9 709 54.6 Spelthorne 2.7 390 8.5 St. Helens 0.5 484 1.0 St. Albans 3.4 112 17.9 St. Edmundsbury 0.9 174 1.7 Stafford1 1.3 295 3.1
Staffordshire Moorlands 0.3 110 0.9 Stevenage 2.9 223 7.6 Stockport 1.7 568 3.9 Stockton-on-Tees 1.0 596 1.5 Stoke-on-Trent1 1.8 1,310 3.7
Stratford-on-Avon 0.5 481 1.9 Stroud 0.5 102 3.9 Suffolk Coastal 1.6 425 1.4 Sunderland 0.8 420 1.7 Surrey Heath 2.0 212 5.2 Sutton 4.5 269 13.0 Swale 0.7 741 2.0 Swindon2 432 3.2
Tameside 2.6 1,662 3.8 Tamworth 0.9 159 3.1
Local authority name % BME No. % BME at 1991 Census households of lets lettings
Tandridge 1.3 30 3.3 Taunton Deane 0.5 172 1.2 Teesdale 0.2 74 0.0 Teignbridge 0.3 161 1.9 Telford and Wrekin2 2,015 3.7
Tendring 0.5 190 2.6 Test Valley 0.8 602 2.3 Tewkesbury 0.5 439 2.5 Thamesdown2 2.5
Thanet 0.8 459 3.1 The Wrekin2 2.4
Three Rivers 3.5 62 9.7 Thurrock 1.8 168 5.4 Tonbridge and Malling 0.8 604 2.2 Torbay 0.6 163 3.1 Torridge 0.3 93 2.2 Tower Hamlets 21.4 718 49.4 Trafford 4.0 1,038 10.7 Tunbridge Wells 1.0 546 3.3 Tynedale 0.3 286 0.0 Uttlesford 0.6 75 4.0 Vale of White Horse 1.1 456 2.0 Vale Royal 0.5 215 1.4 Wakefield 0.9 605 2.8 Walsall 6.0 862 16.2 Waltham Forest 18.9 571 56.6 Wandsworth 15.4 453 44.6 Wansbeck 0.3 88 1.1 Wansdyke1 0.4
Warrington 0.9 491 1.4 Warwick 3.6 275 5.1 Watford 6.7 117 19.7 Waveney 0.4 338 1.5 Waverley 0.8 103 0.0 Wealden 0.6 179 1.7 Wear Valley 0.3 185 1.1 Wellingborough 5.5 149 11.4 Welwyn Hatfield 2.3 281 6.1 West Berkshire2 363 3.9
West Devon 0.3 140 0.0 West Dorset 0.3 519 1.2 West Lancashire 0.6 167 1.8 West Lindsey 0.4 295 1.7 West Oxfordshire 0.8 63 1.6 West Somerset 0.3 191 0.0 West Wiltshire 0.9 632 4.0 Westminster, City of 15.5 800 46.1 Weymouth and Portland 0.5 182 1.7 Wigan 0.6 454 1.3 Winchester 0.7 207 3.4 Windsor and Maidenhead 3.3 601 6.5 Wirral 0.8 1,082 1.6 Woking 3.5 101 5.9 Wokingham 2.4 73 8.2 Wolverhampton 13.1 839 28.5 Woodspring2 0.6
Worcester 1.3 172 2.9 Worthing 1.1 290 5.5 Wychavon 0.3 793 1.0 Wycombe 5.5 148 27.0 Wyre 0.4 536 1.3 Wyre Forest 0.7 569 1.1 York1 0.8 338 2.4
Sources: Column 1: 1991 Census. Columns 2 and 3: CORE 2000/01. Notes:
Total on % BME No. LAs No. self Total % BME governing on gov. Total % BME working contained
Housing association staff staff body body lettings lettings in units
Ability 80 16.3 8 12.5 6 16.7 19 139 Accord 483 10.6 12 8.3 483 16.2 22 3,017 Acton 114 33.3 14 14.3 433 54.0 11 2,984 Adullam Homes 180 18.9 9 0.0 31 22.6 9 234 Advance 367 7.4 8 0.0 66 227 Aged Pilgrims Friend Society 503 0.0 15 0.0 12 69 Agudas Israel 70 75.7 15 73.3 10 30.0 4 283 Airways HS 64 20.3 8 12.5 243 25.5 15 2,269 AKSA 13 76.9 11 72.7 112 74.1 4 424 Aldwyck HA 299 15.4 14 21.4 549 13.1 20 4,796 Amicus Group 121 2.5 11 0.0 1 0 Anchor Trust 9,562 5.2 14 7.1 2,606 2.5 223 23,725
Anglia 269 1.5 15 0.0 1 0
Apex 97 11.3 8 0.0 1 0
Arawak Walton 22 77.3 13 76.9 107 58.9 2 553 Arches 31 12.9 16 12.5 169 37.9 1 799 Arcon 24 4.2 13 23.1 145 6.2 10 1,004 Arhag 16 100.0 15 86.7 47 76.6 11 382 Ashiana 36 86.1 13 84.6 80 55.0 10 535 Ashram 54 92.6 11 81.8 20 70.0 4 365 Ashton Pioneer 28 14.3 12 0.0 208 2.4 1 843 ASRA Midlands 114 93.9 13 84.6 75 70.7 7 571 ASRA Greater London 99 100.0 12 83.3 115 66.1 25 1,761
Atlantic 16 0.0 6 0.0 3 130
Axiom 72 4.2 10 0.0 251 6.4 7 1,511 Bailey 0 8 0.0 21 4.8 22 662 Banbury Homes 44 0.0 12 0.0 139 10.8 1 1,497 Banks Of Wear 24 25.0 12 8.3 33 18.2 3 206 Basildon Community 0 12 0.0 403 2.5 13 2,509 Battersea Churches 61 55.7 14 28.6 81 59.3 7 1,178 Beacon 117 14.5 13 7.7 361 8.6 18 4,076 Beaver 73 24.7 11 18.2 286 37.4 10 2,830 Bedfordshire Pilgrims 212 9.0 15 0.0 795 13.5 43 8,828 Beechdale Community 20 5.0 15 0.0 130 3.9 1 1,377 Belgrave Neighbourhood Co-op 0 19 84.2 54 74.1 1 329 Bentilee Community 26 0.0 16 0.0 334 0.6 1 929 Beth Johnson 190 1.1 9 0.0 577 1.7 14 3,071 Bethnal Green & Victoria Park 72 37.5 17 29.4 141 67.4 4 1,388 Birkenhead Forum 69 2.9 12 0.0 1 0.0 1 37 Birmingham Co-Op 22 18.2 10 10.0 1 0 Black Country Hsg & Com Srvs 123 16.3 8 0.0 184 17.4 2 1,315 Black Star 18 94.4 7 57.1 60 68.3 1 1 Blackwater 0 14 0.0 68 1.5 10 622 Bnai Brith JBG 29 10.3 11 0.0 30 0.0 10 458 Boleyn And Forest 30 36.7 11 18.2 35 9 Booths Charity 22 0.0 9 0.0 39 0.0 1 407 Boston Mayflower 96 0.0 15 0.0 469 0.6 1 4,637 Bourne 46 17.4 11 9.1 106 8.5 18 989 Bournemouth Churches 104 7.7 16 0.0 6 94 Bournville Village 268 10.1 12 0.0 298 10.7 5 3,033 Bournville Works 0 11 0.0 11 0.0 1 314 Bradford & Northern 677 3.6 16 6.3 2,226 7.2 55 11,357 Brighton HT 116 5.2 12 0.0 13 7.7 1 272 Brighton YMCA 105 7.6 11 9.1 1 79 Bristol Churches 80 12.5 12 8.3 133 26.3 11 1,932 Broadacres 156 1.3 15 0.0 335 0.6 7 4,480 Broadening Choices For Older People 215 22.3 11 18.2 1 175 Broadland 106 0.9 15 0.0 538 1.7 12 3,054 Bromford Carinthia 360 8.6 13 0.0 1,392 9.4 41 7,535 Bromford Charitable 0 13 0.0 48 4.2 11 273 Broomleigh 280 16.8 15 6.7 859 16.2 4 11,772 Brunel & Family 207 7.7 15 13.3 505 18.8 4 2,460
Total on % BME No. LAs No. self Total % BME governing on gov. Total % BME working contained
Housing association staff staff body body lettings lettings in units
Brunelcare 674 11.7 10 0.0 121 0.0 2 1,018 Buckinghamshire 10 10.0 13 15.4 31 19.4 5 326 Burnley & Padiham 191 1.6 18 11.1 548 2.0 1 5,212
Bush 7 28.6 13 15.4 32 1
Caldmore Area 136 21.3 11 27.3 344 30.2 4 1,729 Cambridge 264 3.8 8 0.0 182 6.0 6 1,125 Cara Irish 34 47.1 9 88.9 9 128
Carat 0 4 0.0 1 0
Carr Gomm Society 663 16.1 17 17.7 66 262 Castle Vale Community 9 0.0 16 12.5 99 8.1 1 613 CDS HA 232 6.9 11 0.0 710 12.3 6 5,031 Central and Cecil 273 45.4 15 13.3 63 17.5 10 1,170 Central Methodist 8 0.0 9 0.0 14 0 Centrepoint Soho 211 45.0 13 15.4 9 35 Chantry 80 8.8 16 6.3 531 13.0 10 2,296 Charlton Triangle Homes 12 50.0 15 26.7 87 37.9 1 1,243 Cheltenham & District 0 10 0.0 151 2.0 9 1,188 Cherwell 89 12.4 15 26.7 115 13.9 8 1,423 Chevin 3 0.0 10 20.0 3 0.0 4 80 Cheviot 96 1.0 10 0.0 386 0.8 14 2,321 Chichester Diocesan 44 4.6 15 6.7 85 4.7 11 1,227 Chiltern Hundreds HA 0 12 8.3 584 12.0 24 5,453
Chisel 2 0.0 9 33.3 5 97
Christian Action Enfield 39 23.1 13 7.7 90 35.6 4 725 Christian Alliance 187 15.5 8 12.5 16 38 Circle 33 370 33.2 18 11.1 456 44.1 28 9,881 Circle 33 HO 19 42.1 12 8.3 22 28 City And Counties 46 0.0 14 7.1 75 28 Clapton Community 29 44.8 15 26.7 59 69.5 1 959 Clays Lane Co-Op 13 23.1 5 0.0 149 50.3 1 50 Collingwood 190 6.8 13 7.7 786 8.3 17 4,896 Colne 48 2.1 20 0.0 121 1.7 5 1,230 Community HA 146 27.4 13 15.4 175 51.4 7 2,702 Co-op Development Society 51 39.2 15 13.3 39 7.7 16 666 Co-op Home Services 34 35.3 14 28.6 11 45.5 4 40 Cosmopolitan 48 8.3 14 7.1 245 7.4 7 1,706 Cotman 42 0.0 13 0.0 165 1.8 8 1,034 County Palatine 0 7 14.3 235 5.5 4 0 County Palatine (One) 113 1.8 12 16.7 7 1,026 Court (Berkshire) 112 8.0 10 0.0 45 0.0 4 348 Crosby 11 0.0 12 0.0 34 0.0 1 367 Crown 14 14.3 14 7.1 23 4.4 6 148 Croydon Churches 72 25.0 12 25.0 99 31.3 3 1,029 Croydon Peoples 16 93.8 9 100.0 33 75.8 3 179 Croydon YMCA 92 45.7 7 42.9 1 0 Crystal Palace 0 12 25.0 21 0 Dane Hsg (Congleton) 166 1.2 16 0.0 369 0.8 2 3,808 De Montfort 60 13.3 16 12.5 485 15.5 18 2,479 Derwent 183 3.8 13 7.7 634 7.3 22 3,092 Derwent & Solway 64 0.0 13 0.0 470 0.2 1 3,581 Devon & Cornwall HA 270 2.6 14 0.0 780 1.7 17 6,467 Devon & Cornwall Counties 0 10 0.0 1 0.0 17 25 Devon & Cornwall HT 0 10 0.0 1 0 Devon Community 267 1.1 15 0.0 41 0.0 9 576 Downland Group 86 2.3 10 0.0 1 0 Droitwich Spa & Rural 111 0.0 22 0.0 412 1.0 2 2679
Drum 32 3.1 9 0.0 1 0
Total on % BME No. LAs No. self Total % BME governing on gov. Total % BME working contained
Housing association staff staff body body lettings lettings in units
Eastleigh 83 4.8 16 0.0 225 3.6 5 4,210 Eden 49 0.0 16 100.0 143 0.0 2 1,444 Ekaya 22 86.4 12 91.7 3 100.0 4 67 Eldonian Community Co-Op 13 0.0 12 0.0 5 20.0 1 310 Elgar 0 16 0.0 430 0.5 4 4,686 Elim 22 9.1 11 0.0 48 16.7 10 219 Elmbridge 98 4.1 18 5.6 365 4.4 1 4,336 Endeavour 49 6.1 16 0.0 335 5.4 5 1,336 English Churches 1,183 20.5 11 9.1 875 9.9 176 8,703 English Rural 0 14 0.0 6 0.0 27 213 Enham Trust 314 0.6 11 0.0 8 0.0 1 168 Enterprise 5 96 2.1 9 22.2 279 2.2 6 1,519
Equity 2 0.0 12 8.3 31 60
Estuary 309 11.0 14 0.0 325 4.6 23 1,931 Evesham & Pershore 102 2.0 13 0.0 311 1.3 6 3,990 Exeter HS 56 0.0 14 0.0 105 6.7 1 895 Family 313 53.4 15 20.0 509 56.0 30 9,502 Family First 46 32.6 12 8.3 98 25.5 5 437 Family HA Birkenhead 3 100.0 10 0.0 60 0.0 1 350 Family HA Birmingham 56 25.0 11 18.2 277 49.5 4 1,795 Family HA Manchester 173 16.8 16 0.0 618 26.4 7 3,549 First Step 10 0.0 8 0.0 2 67
Five Counties 0 11 0.0 5 0
Flagship 74 2.7 9 0.0 1 0
Focus 667 24.9 11 9.1 1,655 39.9 27 11,185 Focus Two 7 14.3 14 14.3 21 34 Fortunegate Community 26 42.3 16 68.8 2 0.0 1 1,360 Fosseway 137 0.0 15 0.0 451 0.4 2 4,087 Foundation 19 89.5 16 87.5 78 48.7 1 252 Franklands Village 6 0.0 10 0.0 19 5.3 1 277 Friendship Hsg & Care 370 23.5 12 16.7 568 25.5 20 3,051 Girls Friendly Society Of E & W 82 17.1 20 5.0 10 26 Gloucestershire HA 56 16.1 14 7.1 314 8.0 11 1,651 Granta 372 8.1 9 0.0 242 7.0 19 1,183 Gravesend Churches 27 7.4 14 7.1 36 8.3 3 492 Greater Hornby 27 0.0 11 9.1 198 8.1 4 1,313 Griffin 19 42.1 10 20.0 22 63.6 9 363 Grosvenor 272 0.7 11 0.0 528 1.1 23 3,867 Guinness HA 0 9 0.0 68 2.9 7 578 Guinness Trust 784 16.5 15 6.7 2,438 11.2 110 18,648 Habinteg 71 21.1 12 16.7 248 7.7 38 1,998 Haig Homes 25 8.0 15 6.7 121 3.3 47 1,198 Hallam 22 13.6 12 0.0 172 11.1 6 1,086 Hallmark 30 73.3 10 100.0 107 34.6 2 401 Hamac 13 100.0 11 90.9 121 73.6 1 353 Hampshire Voluntary 117 6.0 13 0.0 113 0.9 10 875 Hanover 510 2.9 29 13.8 1,228 1.7 166 10,156 Harden 17 0.0 10 10.0 169 8.9 16 2,378 Harding 68 27.9 11 9.1 55 58.2 6 1,205 Harewood 48 8.3 10 0.0 388 15.5 12 1,841 Hart 37 5.4 14 0.0 118 2.5 6 2,415
Hartvale 49 4.1 12 0.0 1 0
Harvest 66 9.1 10 100.0 1 0
Total on % BME No. LAs No. self Total % BME governing on gov. Total % BME working contained
Housing association staff staff body body lettings lettings in units
Home Group 152 2.0 7 0.0 3,161 5.5 92 27,106 Hornsey 17 70.6 14 21.4 24 41.7 1 353 Hotel & Catering Benevolent 44 34.1 12 0.0 5 173 Housing 21 1,918 12.9 14 0.0 1,280 0.9 224 12,686 Housing For Women 18 61.1 9 22.2 52 59.6 8 553 Howard Cottage 29 100.0 17 5.9 86 5.8 5 1,223
HTC 0 15 46.7 7 57.1 1 401
Hull Churches 27 0.0 11 9.1 35 0.0 1 322 Hundred Houses 12 0.0 16 6.3 44 9.1 3 569 Huntingdonshire 174 2.3 17 11.8 196 4.1 1 6,448 Hyde 646 15.5 16 18.8 1,014 27.2 56 11,882 Hyde Southbank Homes 76 57.9 9 0.0 32 62.5 1 2,026 Impact 116 0.0 15 0.0 317 1.6 5 2,078 Industrial Dwellings 50 40.0 15 26.7 86 39.5 4 1,212 Innisfree 13 84.6 14 78.6 38 2.6 8 254 Inquilab 17 88.2 10 90.0 16 50.0 6 478 Irish Centre 42 69.1 8 75.0 4 0.0 3 67 Irwell Valley 176 11.4 11 9.1 986 14.2 11 5,900 Isle of Wight 119 4.2 16 0.0 104 1.9 1 512 Islington & Shoreditch 33 45.5 11 18.2 122 50.0 4 957 James Butcher 257 4.3 13 0.0 499 3.8 39 3,553 Jephson HA 74 1.4 14 7.1 213 7.5 22 1,755 Jephson Homes 276 4.4 14 7.1 1,029 12.7 70 7,000 John Grooms 62 24.2 15 6.7 115 13.0 53 986 Johnnie Johnson HT 239 2.9 13 0.0 509 3.9 33 3,570 Joseph Rowntree 259 0.8 8 0.0 76 1.3 11 1,297 Kelsey 57 7.0 11 9.1 291 6.2 26 2,074 Keniston 41 2.4 9 0.0 45 17.8 7 640 Kennet 17 5.9 10 0.0 48 6.3 6 408 Kensington 77 50.7 18 11.1 65 41.5 4 2,273 Kerrier 153 0.7 17 0.0 252 2.8 1 3,638
Keynote 0 7 0.0 1 0
King Street 15 0.0 11 0.0 14 0.0 2 179 Kingfisher 100 5.0 14 7.1 329 2.4 4 4,174 Kingsmead Homes (Hackney) 22 54.6 15 26.7 65 83.1 1 944 Knightstone HA 397 3.8 12 0.0 780 6.6 41 7,416 Kush 32 96.9 11 81.8 54 79.6 8 629 Landmark 10 60.0 9 22.2 2 50.0 18 53 Leasowe Community Homes 0 12 8.3 119 0.0 1 1,076 Lee 11 27.3 11 36.4 172 57.6 1 22 Leeds Federated 126 16.7 12 0.0 614 17.3 11 3,469 Leeds Jewish 25 40.0 20 100.0 67 95.5 1 398 Leeds Yorkshire 25 4.0 12 8.3 140 15.0 6 1,052 Leicester 322 19.3 14 21.4 996 23.5 34 5,176 Leicester Newarke 19 5.3 19 31.6 412 51.9 1 107 Lichfield & District 124 2.4 16 0.0 429 1.4 1 4,574 Limehurst Village Trust 10 0.0 14 0.0 85 3.5 1 635 Lincolnshire Rural 9 0.0 12 8.3 43 2.3 9 286 Linen & Woollen Drapers Inst 254 18.5 17 0.0 3 362 Liver 388 2.6 15 0.0 421 2.4 5 4,434 Liverpool HT 293 7.5 15 6.7 872 6.5 6 8,758 London & Quadrant Bexley 0 16 0.0 285 5.3 1 3,858 London & Quadrant HT 622 30.7 13 7.7 1,587 32.5 60 19,765 Longhurst HA 124 1.6 18 0.0 646 3.3 29 3,133 Look Ahead 443 46.7 13 23.1 11 585 Luton Churches 18 16.7 9 22.2 56 32.1 2 369 Macedon 72 16.7 11 0.0 3 33.3 1 0 Magna HA 239 0.0 15 0.0 521 2.3 25 5,769
Magna HG 65 4.6 9 0.0 1 0
Total on % BME No. LAs No. self Total % BME governing on gov. Total % BME working contained
Housing association staff staff body body lettings lettings in units
Maritime 122 4.1 10 10.0 296 4.7 13 3,103 Medina HA 64 0.0 7 0.0 184 1.1 1 2,837 Medina Hsg & Care Group 0 8 12.5 1 0 Mercian 90 14.4 11 18.2 226 15.5 12 2,021 Merseyside 3 0.0 10 0.0 28 7.1 4 250 Methodist Homes 203 4.4 7 14.3 90 0.0 19 541 Metropolitan HO 37 40.5 11 9.1 72 0 Metropolitan HT 500 34.4 14 7.1 848 28.4 42 11,651 Mid Beds 85 4.7 16 6.3 246 2.4 1 2,903 Midland Area 66 42.4 12 33.3 480 73.3 5 3,736 Midsummer HA 51 7.8 12 8.3 6 0 Midsummer Homes 0 9 11.1 130 26.9 4 1,253 Minster General 65 1.5 12 0.0 269 7.1 7 1,457
Moat HG 345 3.2 11 0.0 1 0
Moat HO 0 10 10.0 112 0
Moat HS 0 9 0.0 424 8.3 47 3,118 Moseley & District 86 40.7 12 16.7 109 54.1 1 1,130 Mosscare 65 35.4 10 20.0 350 60.9 5 2,384 Mount Green 29 3.5 8 12.5 52 3.9 7 673 Muir Group 133 4.5 17 0.0 590 2.5 27 3,380 Nacro Community Enterprises 391 23.3 11 18.2 4 33 National Council of YMCAs 746 4.4 24 100.0 26 677 Nehemiah 21 81.0 12 91.7 46 63.0 4 303 Nene 93 7.5 10 10.0 413 9.2 15 2,647 Neston & Parkgate 6 0.0 0 0.0 15 0.0 1 182 Network 222 67.6 15 40.0 416 45.7 35 5,007 New Charter (North) 66 4.6 11 0.0 1 8,505 New Charter (South) 84 1.2 13 15.4 1 7,615 New Charter HT 221 4.1 13 0.0 1 0 New Downland 163 2.5 13 0.0 970 2.9 37 8,265 New Era 629 6.2 16 0.0 140 50 New Islington & Hackney 354 25.4 13 15.4 261 46.4 10 5,090 New Progress 42 0.0 13 0.0 411 3.9 11 2,845 Newcastle & Whitley 14 100.0 10 0.0 103 14.6 6 695 Newcastle-Under-Lyme 324 2.2 14 0.0 1,051 1.3 1 9,554 Newlon 80 45.0 15 26.7 173 61.3 7 3,152 Nomad Hsg Group 61 0.0 12 0.0 408 2.2 18 2,138 North British 882 4.4 13 7.7 3,754 10.2 225 36,781 North British HG 0 13 7.7 1 0 North British Third 373 7.0 12 0.0 41 609 North Cheshire 100 2.0 12 8.3 395 4.1 17 2,532 North Devon Homes 71 0.0 14 0.0 144 1.4 1 3,234 North London Muslim 26 84.6 19 84.2 23 95.7 3 430 Northamptonshire Rural 0 13 0.0 4 130 Northcote 21 33.3 13 7.7 50 0 Northern Counties 544 4.2 11 18.2 2,790 7.1 76 15,362 Norwich 7 0.0 12 0.0 62 0.0 1 270 Notting Hill HO 57 42.1 13 30.8 86 15 Notting Hill HT 533 43.7 13 30.8 458 49.6 11 10,265 Nottingham Community 326 12.0 13 15.4 1,084 11.0 24 5,088 Oakfern 71 1.4 16 0.0 337 5.6 3 4,069 Octavia Hill 95 29.5 13 7.7 77 45.5 8 1,479 Old Ford 40 32.5 10 10.0 81 27.2 1 167 Optima Community 64 29.7 13 15.4 304 30.3 1 2,002 Orbit 909 8.5 14 7.1 1,658 7.2 86 13,414 Orbit Bexley 0 16 6.3 366 7.7 1 3,913 Orbit First Step 0 9 11.1 85 0
Oriel 0 10 10.0 1 0
Orwell 123 0.8 16 0.0 297 4.0 15 1,972 Otto Schiff 128 78.9 8 100.0 3 77 Oxbode 7 0.0 7 0.0 53 7.6 1 262 Oxford Citizens 99 9.1 13 7.7 197 11.7 6 1,708 Paddington Churches 370 51.9 12 33.3 627 50.7 14 8,383 Papworth Village 12 0.0 9 0.0 7 0.0 7 354
Total on % BME No. LAs No. self Total % BME governing on gov. Total % BME working contained
Housing association staff staff body body lettings lettings in units
Parchment 77 1.3 11 0.0 1 0
Parkside 36 16.7 8 12.5 1 0
Partnership 214 0.9 7 0.0 1 0 Patchwork Community 81 56.8 13 15.4 3 33.3 11 50 Pavilion 99 2.0 18 0.0 402 4.0 5 4,740 Peabody Trust 662 28.1 13 23.1 559 44.5 25 16,703 Peddars Way 67 0.0 16 0.0 788 2.5 18 7,576 Penwith 112 0.0 15 0.0 385 3.1 5 3,669 People First 8 25.0 9 33.3 28 39.3 1 249 Peter Bedford 54 33.3 15 20.0 2 0.0 3 102 Petersfield 4 0.0 9 0.0 5 0.0 1 165 Phoenix House 300 8.3 12 8.3 3 0 Pickering & Ferens Homes 36 0.0 23 4.4 79 1.3 1 1,115 Pierhead 41 2.4 13 0.0 232 10.3 5 1,471 Pine Court 7 71.4 6 100.0 51 52.9 2 352 Plume 76 2.6 14 0.0 225 2.2 8 2,387 Pollards Hill 21 23.8 12 25.0 77 28.6 1 871 Poplar HARCA 144 31.3 17 11.8 118 49.2 1 3,737 Portico 107 6.5 9 11.1 486 13.8 12 3,297 Portsmouth 105 2.9 20 5.0 365 3.0 4 3,176 Presentation 72 79.2 10 70.0 196 52.0 21 2,939
Progress 104 1.9 12 0.0 1 0
Total on % BME No. LAs No. self Total % BME governing on gov. Total % BME working contained
Housing association staff staff body body lettings lettings in units
South Hams 120 0.0 15 0.0 216 0.9 1 2,981 South Liverpool 90 4.4 14 0.0 368 3.5 1 4,130 South London Family 508 40.0 16 18.8 596 38.8 28 8,038 South Oxfordshire 111 4.5 15 0.0 366 3.0 1 4,715 South Shropshire 157 1.3 16 0.0 146 2.1 3 1,814 South Somerset Homes 268 0.4 18 0.0 691 0.4 1 8,426 South Staffordshire 194 2.6 15 0.0 489 0.4 2 5,157 South Warwickshire 113 4.4 15 0.0 439 1.8 6 5,554 South West Co-Op 4 0.0 11 0.0 5 0.0 9 361 South Wight 55 0.0 10 0.0 242 3.3 1 2,271 South Yorkshire 250 6.8 16 18.8 631 9.5 9 2,719 Southlands 8 25.0 20 5.0 7 46 Sovereign 291 0.3 11 0.0 608 4.6 60 10,523 Spelthorne 0 18 5.6 299 9.0 2 3,341 Spitalfields Co-Op 10 70.0 15 73.3 6 50.0 2 346 Springboard 1,150 27.4 14 21.4 490 15.5 22 4,010 St Anne's Shelter & Hsg Action 724 6.9 17 11.8 4 109 St Christophers Fellowship 107 50.5 14 14.3 6 16 St Helens 140 0.7 12 0.0 25 0.0 1 197 St John Kemble 19 0.0 11 0.0 87 0.0 1 180 St Marylebone 53 41.5 16 0.0 104 33.7 8 1,730 St Matthew Society 109 3.7 10 0.0 20 177 St Mungo Community 514 33.9 12 8.3 9 55 St Pancras 236 27.1 17 17.7 298 24.2 46 3,386 St Vincents HA 111 18.0 16 18.8 266 17.7 15 2,112 Staffordshire 76 2.6 14 0.0 350 3.1 4 1,802 Stoke On Trent HS 0 12 0.0 167 8.4 1 395 Stonham 1,811 6.8 11 9.1 135 435 Stort Valley 0 17 0.0 127 7.9 10 534 Suffolk 38 100.0 13 0.0 217 4.6 10 1,142 Suffolk Heritage 96 0.0 14 7.1 660 1.2 18 6,749 Surrey Community Trust 60 13.3 13 7.7 12 211 Surrey Heath 75 6.7 15 0.0 183 4.9 3 2,734 Sussex Housing And Care 173 4.6 14 0.0 44 0.0 6 309
Sutherland 0 7 14.3 16 0
Sutton 16 0.0 9 11.1 54 11.1 1 399 Swale 134 14.2 9 11.1 605 2.3 3 6,571
Swan 85 3.5 28 10.7 10 366
Swaythling 132 3.0 23 8.7 403 4.5 20 3,881 Tamar 11 9.1 10 0.0 76 5.3 4 400 Teachers Benevolent 52 13.5 12 0.0 80 10.0 11 501 Tees Valley HG 104 1.9 13 0.0 728 2.1 13 2,904 Templar HA 22 0.0 18 5.6 65 1.5 5 510 Ten Sixty Six 154 3.9 16 0.0 530 3.2 1 4,388 Testway 164 1.2 15 6.7 473 2.1 1 5,145 Thames 48 39.6 9 11.1 116 49.1 10 1,729 Thames Valley 107 26.2 11 0.0 319 21.9 54 184 Thames Valley Charitable 0 11 0.0 29 2,841 Thanet Community 62 0.0 15 0.0 303 3.3 1 2,468 Three Rivers 86 1.2 16 6.3 525 1.3 14 1,724 Threshold Key Homes 0 12 16.7 7 14 Threshold Tennant 193 50.3 15 13.3 224 36.2 18 3,028 Tonbridge & Malling 162 1.2 15 0.0 537 2.4 4 6,311 Touchstone 301 6.0 9 22.2 1,197 17.2 55 8,363 Tower Hamlets Community 45 37.8 17 29.4 1 1,254 Tower Homes 40 20.0 9 0.0 64 439 Town & County 0 9 0.0 6 112 Toynbee 57 40.4 16 25.0 226 38.1 15 2,008 Toynbee Partnership 4 75.0 16 25.0 5 0 Trident 260 31.9 11 0.0 248 27.0 10 2,067 Tung Sing 14 50.0 12 58.3 23 73.9 2 249 Tuntum 49 87.8 49 87.8 147 46.3 5 528 Turning Point 952 15.3 11 0.0 11 0
Two Care 201 13.9 9 0.0 9 0
Total on % BME No. LAs No. self Total % BME governing on gov. Total % BME working contained
Housing association staff staff body body lettings lettings in units
Twynham 90 2.2 14 0.0 201 1.0 13 2,190 Tynedale 105 1.0 15 0.0 258 0.0 1 3,391 Ujima 127 95.3 11 90.9 332 69.6 18 2,701 United HA 12 58.3 12 75.0 91 52.8 3 570 United Churches (Birmingham) 6 83.3 7 100.0 26 88.5 1 121 Unity 25 60.0 11 81.8 180 65.0 1 880 Vale 169 1.2 15 0.0 356 2.3 2 4,847 Vange Community 1 0.0 10 0.0 53 3.8 1 706 Venture 28 0.0 11 0.0 209 10.5 2 1,243 Villages HA 56 0.0 8 0.0 183 2.7 1 1,789 Walbrook 264 15.9 11 18.2 452 18.4 14 2,423 Walterton & Elgin CH 11 45.5 20 25.0 40 45.0 1 519 Waltham Forest 12 25.0 12 25.0 25 44.0 1 312 Waltham Forest Community 53 41.5 16 25.0 124 62.9 1 1,360 Wandle 71 47.9 12 41.7 189 48.7 23 2,811 Warden 331 14.5 11 9.1 363 9.4 84 5,539 Warrington 34 2.9 11 0.0 124 1.6 1 1,048 Warwickshire Rural 0 9 0.0 4 165 Waterloo 99 4.0 13 15.4 418 7.9 19 2,737 Welwyn Garden City 74 13.5 12 0.0 47 0.0 1 283 West Devon Homes 36 2.8 17 5.9 98 0.0 1 1,362 West Hampstead HA 82 72.0 13 23.1 6 467 West Kent 137 5.8 10 0.0 446 2.9 2 5,313 West Links 121 0.0 16 0.0 203 0.5 1 3,766 West Mercia 45 4.4 10 10.0 1 0 West Pennine 79 10.1 11 27.3 386 19.7 11 2,489 West Wiltshire 147 2.0 18 0.0 484 3.5 2 5,095 West Yorkshire 49 10.2 13 15.4 111 15.3 6 689 Westcountry 141 1.4 13 15.4 300 3.3 15 2,334 Western Challenge HA 153 4.6 11 0.0 400 2.3 39 3,747 Western Challenge HG 0 9 0.0 1 0 Westfield 12 0.0 12 0.0 86 1.2 1 433 Westlea 205 1.5 18 11.1 382 0.3 3 5,694 Westway 18 100.0 10 100.0 23 60.9 5 338 Weymouth & Portland 106 0.9 18 5.6 48 2.1 2 3,003 Wherry 0 16 0.0 453 1.3 28 4,421 William Sutton Trust 556 9.0 9 22.2 1,807 6.5 43 15,822 Willow Park 195 4.6 14 14.3 514 5.3 1 6,350 Winchester HA 0 12 0.0 137 3.7 6 758 Winchester HG 44 0.0 12 0.0 1 0 Windmill 25 0.0 10 0.0 88 2.3 4 612 Windsor & District 101 5.0 14 7.1 314 3.2 8 3,255 Wirral Methodist 24 0.0 15 0.0 87 3.5 2 667 Wolds 5 0.0 14 0.0 18 0.0 5 201 Womens HT 10 20.0 7 0.0 5 38 Womens Pioneer 49 20.4 13 15.4 51 54.9 7 960 Worcestershire 38 5.3 11 0.0 144 3.5 7 896 Worthing Homes 63 3.2 17 5.9 112 5.4 2 2,343 Wrekin HT 513 1.4 16 0.0 1,607 4.0 1 12,251 Wycombe Friendship 0 9 0.0 11 45.5 2 101 Wyedean 7 100.0 11 100.0 117 0.9 2 344 Wykeham Properties 0 11 0.0 2 46 Wyre 109 1.8 18 0.0 456 1.1 6 2,931 Wyre Forest Community 407 1.5 18 0.0 453 0.7 1 5,983 York 30 0.0 9 0.0 53 5.7 5 336 Yorkshire Community 246 3.7 12 8.3 1,250 5.5 20 8,377 YWCA Of GB 56 28.6 20 0.0 1 0.0 5 56
Sources: Columns 1, 2, 3, 4, 7 and 8: 2000 RSR. Columns 5 and 6: CORE 2000/01 Notes:
1 CORE data shown refers to general needs lettings only, hence HAs with few or no general needs units do not have any CORE data shown in this table. 2 Participation in CORE is not mandatory for all HAs and some smaller HAs do not provide their lettings
23
4
Appendix 3: Local authority boundary changes since 1991 census
Current name Previous name
Bath and NE Somerset Bath Wansdyke Brighton and Hove Brighton
Hove
East Riding of Yorkshire Boothferry (part) East Yorkshire
East Yorkshire Borough of Beverley Holderness
Harrogate Harrogate (part) Herefordshire, County of Hereford
Huntingdonshire Huntingdonshire (part) Isle of Wight Medina
South Wight Malvern Hills Leominster (part)
Malvern Hills (part) Medway Gillingham
Rochester-upon-Medway North East Lincolnshire Cleethorpes
Great Grimsby North Lincolnshire Boothferry (part)
Glanford Scunthorpe
Peterborough Huntingdonshire (part) Peterborough (part) Ryedale Ryedale (part) Selby Selby (part) South Gloucestershire Kingswood Northavon Stafford Stafford (part) Stoke-on-Trent Stafford (part) Stoke-on-Trent York Harrogate
Ryedale (part) Selby (part) York
Appendix 4: Local authority name changes since 1991 census
Current name Previous name
Bedford North Bedfordshire Bracknell Bracknell Forest Newark Newark and Sherwood North Somerset Woodspring