SAAD, Sameh <http://orcid.org/0000-0002-9019-9636> and AL AFIFI, Maan
Available from Sheffield Hallam University Research Archive (SHURA) at:
http://shura.shu.ac.uk/14013/
This document is the author deposited version. You are advised to consult the
publisher's version if you wish to cite from it.
Published version
SAAD, Sameh and AL AFIFI, Maan (2015). The ABCD Validation Management Tool
for business excellence models. WSEAS Transaction on Business and Economics,
12, 363-376.
Copyright and re-use policy
See
http://shura.shu.ac.uk/information.html
The ABCD Validation Management Tool for Business Excellence
Models
SAMEH M. SAAD AND MAAN N. AL AFIFI
Department of Engineering and Mathematics
Sheffield Hallam University
City Campus, Sheffield, South Yorkshire S1 1WB
UNITED KINGDOM
[email protected] and [email protected]
Abstract
: -
This paper introduces a new developed validation management tool for business models using ABCD Model Analysis. We define the ABCD Management as “Achievement Because Continuous Development” and the validation tool based on the set of steps i.e. Analyse, Build, Check, and then Decide. The core of the validation tool development is formed by combination of well-known quality management tools: Deming Cycle, RADAR logic and using the application of statistical tools: structural equation modelling, SPSS and AMOS.The approach used in this paper is to extend the well-known quality management methods combined with the available Structural Equation Modelling and AMOS for building and validating the business excellence models. The design of ABCD Model Analysis is based on a new method of direct and/or indirect path valuation that divides relationships paths into categories based on ABCD alphabetical coding, and provide a systematic, sequential manner and logical view based on ABCD rule of thumb that enable the analysing process to take place with ease and accuracy prior to and during the validation process.
The study shows that the ABCD Model Analysis is a very useful management tool for validation due to its systematic, simple, easy to remember, implement and to refine. In addition, the Path Analysis in the ABCD Model is a better version of the known Path Analysis techniques.
Key-Words: - Validation Process, ABCD Model Analysis, Business Excellence Model.
1 Introduction and Background
Many organization developed Business Excellence Models for performance, efficiency, productivity and excellence. Business Models answers a combination of questions “Who”, “What”, “When”, “Why” (Mitchell and Coles, 2004). Morris et el (2005) reached to a definition of the business model as a standardized set of decision that can be quantified. Many definitions share a common view of the business model as description of a reality within their frame of references. The most known models worldwide are Baldrige (MBNQA), European Foundation for Quality Management (EFQM), Singapore Award Model, Japan Quality Award Model, Australian Business Excellence Framework (ABEF), Canadian Business Excellence Model, Dubai Government Excellence Award, and Shaikh Khalifa Excellence Award both depending on EFQM. .
In order to ensure the model is developed according to the company logic of value creation
model has to be tested by straightforward multiple regressions.
2
The Background of ABCD
Validation
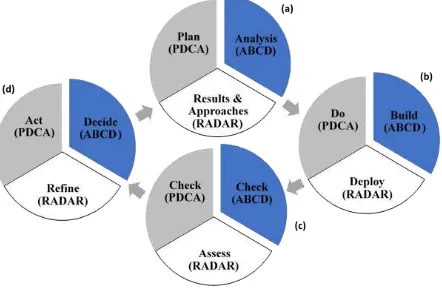
The ABCD Model is intended to explain and guide the structure and implementation of the established validation process. The ABCD Validation Management tool which is called ABCD Model Analysis is a combination of several quality management methods such as Deming Cycle and Radar Logic (see figure 1) and Structure Equation Models such as Analysis Moment of Structure (AMOS).
Deming Cycle and RADAR logic both are popular quality management tools used in various industries and organisations. (Sokovic et el, 2010) which are possible to use for the continuous quality improvement of products, processes and services in organizations.
The RADAR logic provides a structured approach assessing the Organization performance in conjunction with the EFQM excellence model permit a standardised assessment of how well the enablers of the organisation achieve the results. The effectiveness of Deming Cycle tends to be more in the start of the planning and during the execution of the work, whereas the RADAR tends to be more present after the work is completed and used as an assessment tool for evaluation purposes.
Figure 1 ABCD model, Deming Cycle and RADAR logic
Jaccard (2013) stated that RADAR logic is inspired by Deming Cycle, suggests that an organisation work sequentially by defining the “Results and Approaches” required to achieve its strategy (RESULTS & APPROACH) whereas in
Deming Cycle the planning for results expected now and in the future “PLAN”. Accordingly, ABCD has defined the purpose and the approach in the first step (ANALYSE) of the model that includes planning and list of analysis required to be used as figure 1(a). Secondly RADAR systematically “Deploying” these approaches to ensure their implementation in full in order to “DO” as Deming Cycle; ABCD “Build” the theory and the measurement model as shown in the figure 1(b). In figure 1(c) the RADAR “Assess” takes place at this stage, The Deming cycle “Check” carry out the evaluation process, the ABCD also conduct tests under the stage of “Check”. The figure 1(d) RADAR is “Refine” which corresponds to “Act” as Deming Cycle or “Decide” the best from the evaluated options as in ABCD Model Analysis. The RADAR logic aims to identify the strengths and weakness of an organization and initiate a phase of continuous improvement or ongoing process improvement. It can also be used as method of problem solving throughout the company. Similarly to the Deming cycle, the RADAR logic can be seen as the basic building block of a management system. ABCD Management Theory takes into consideration both mentioned methods by analysing the purpose and approach (Plan/Result and Approach), Build the management model (Do/Deploy), Check by carrying out tests and (Check/Assess), and Decide the best action (Act/Refine).
The RADAR logic is used as mechanism to evaluate the “past, the Deming Cycle evaluates the “present” and ABCD combines them. The combination of the quality management tools and methodologies becomes an integration solution for the improvement areas of Business Excellence Models.
3 The ABCD Model Analysis
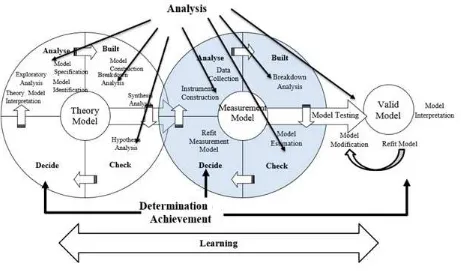
[image:3.595.54.275.498.643.2]Figure 2: Foundation concept to validate model.
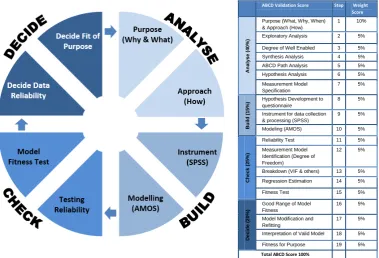
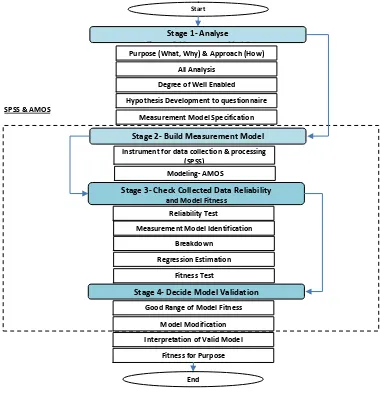
The ABCD model analysis consist of four basic ABCD stages which are positioned in the outer part of the model and there are two sub-stages in each (see figure 3). Therefore, there are eight sub-stages in total which are required to validate a business Excellence Model. Figure 4 displays the steps which should be followed in order to validate a business excellence model. The four main stages are as follows:
• Analyse of the Business Excellence Model
validation by identifying the purpose and approach to perform analysis with minimum time with high accuracy.
• Build the business excellence model according
to the purpose and approach.
• Check the fitness of the business excellence
model by a series of reliability tests and analysis to determine the validation of the measurement model and to determine the fit of purpose. • Decide the validity business excellence model
for the theory, measurement and final interpretation and determine the correlation values, the regression and Model fitness tests and finally decide the fitness of the model and the fit of purpose.
The purpose of the ABCD Model is to obtain a successful validation results by following a systematic approach with ease of remembering the steps, implementation and the refinement. Also, it
Figure 3: ABCD Model Analysis
As mentioned in the figure 3, the ABCD Model Analysis starts with defining the purpose of the validation and ends up at deciding the fitness of purpose. The validation is required to determine the criteria in which the measurement model is built on it and the analysis which can be respectively divided into several categories; For example, in business excellence models that contain similar components like European Foundation for Quality Management (EFQM), then a codification in alphabetical ABCD can be used to carry out bidirectional path analysis. The ABCD Model also contains Structure Equation Modelling (SEM), which takes place in several
steps; it starts with the tuning of the model. The standardisation and modification operation are carried out to bring up the fitness of the model to a good range of performance. The sequential steps of the ABCD Model Analysis is shown in figure 4.An example of Business Excellence Model can be seen in figure 5 which represents the evaluation criteria for the category of the distinguished Government which is similar to EFQM.
ABCD Validation Score Step Weight Score
An
al
yse (
40%)
Purpose (What, Why, When) & Approach (How)
1 10% Exploratory Analysis 2 5% Degree of Well Enabled 3 5% Synthesis Analysis 4 5% ABCD Path Analysis 5 5% Hypothesis Analysis 6 5% Measurement Model
Specification
7 5%
B
uil
d
(15%)
Hypothesis Development to questionnaire
8 5% Instrument for data collection
& processing (SPSS)
9 5% Modeling (AMOS) 10 5%
Ch
eck (
25%)
Reliability Test 11 5% Measurement Model
Identification (Degree of Freedom)
12 5%
Breakdown (VIF & others) 13 5% Regression Estimation 14 5% Fitness Test 15 5%
Deci
d
e (
20%)
Good Range of Model Fitness
16 5% Model Modification and
Refitting
17 5% Interpretation of Valid Model 18 5% Fitness for Purpose 19 5%
Figure 4: Steps in ABCD Model Analysis
Figure 5: The EFQM 2012
The EFQM model as shown in figure 5 is an effective model worldwide, comply and in line with the international standards, results oriented, it has 9 criteria, 5 of them are enables and 4 are results. The evaluation based on RADAR of results. The results are combination of performance outcomes such as
trends, targets, comparisons, causes. ABCD Model analysis was developed to ease the analysis and testing the EFQM Model as mentioned in figure 5.
Partnerships &
Resources People
Strategy Processes, Service
and Product Leadership
People Results
Customer Results
Society Results
Key Performance
Results
Results
Enabler
Innovation, Learning & Transparency
Breakdown
Fitness Test Regression Estimation Purpose (What, Why) & Approach (How)
Stage 1- Analyse
Th & M M d l
Stage 2- Build Measurement Model
Stage 3- Check Collected Data Reliability
and Model Fitness
Stage 4- Decide Model Validation
All Analysis
Degree of Well Enabled
Hypothesis Development to questionnaire
Instrument for data collection & processing (SPSS)
Measurement Model Identification Reliability Test
Good Range of Model Fitness
Model Modification
Interpretation of Valid Model
Fitness for Purpose
Start
End SPSS & AMOS
[image:6.595.118.479.492.636.2]3.1 Stage 1: Analyse
The first stage of validation process is to analyse the business model by identifying the purpose and the approach to perform analysis with minimum time and high accuracy.
3.1.1 Purpose
Initially to begin the analysis, it is required to understand exactly what is the purpose? , it could be for new model that need a validation or an existing model’s validation need to be evaluated or a decision making process to get the right result or even an experiment that requires validation.
3.1.2 Approach (How to validate?)
The approach may be varied from case to case. The general approach for the research purpose is suggested to start from theory model construction
until the model is validated. The approach of this validation is to codify the business excellence model which is based on EFQM criteria into three ABCD and develop a three vertical models ABCD1, ABCD2 and ABCD3, also horizontal models are required to distinguish between the common enablers and the results.
3.1.3 Degree of Well Enabled
[image:7.595.66.533.353.515.2]The Degree of well enabled will indicate not only how to validate but how good the validation is. The evaluation of the relationship among the criteria is summarised into three categories i.e. low enabled, marginal enabled and well enabled, as can be seen in tables 1, 2 and 3. Well enabled means the relationship are well established. Marginal enabled indicate the average relationship and low enabled represent the poor relationship among the criteria.
Table 1: Degree of Well Enabled Evaluation to ABCD1
Category
in EFQM Leadership Strategy
Partnership & Resources
Process People Result
Customer Result
Society Result
Degree of Well Enabled
People 3/1 Very
Strong Strong N/A Strong Moderate N/A N/A Well Enabled
People 3/2 Very
Strong Weak N/A
Very Strong
Very
Strong N/A N/A Well Enabled
People 3/3 Very
Strong Moderate N/A
Very
Strong Strong N/A N/A Well Enabled
People 3/4 Very
Strong Strong N/A Strong
Very
Strong N/A N/A Well Enabled
People 3/5 Very
Strong Moderate N/A Very weak
Very
Strong N/A N/A Marginally Enabled
People 3/6 Weak Weak N/A Weak Very
Strong N/A N/A Marginally Enabled
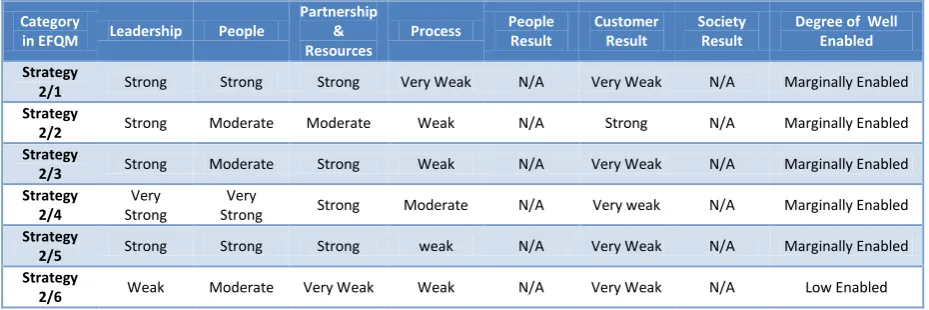
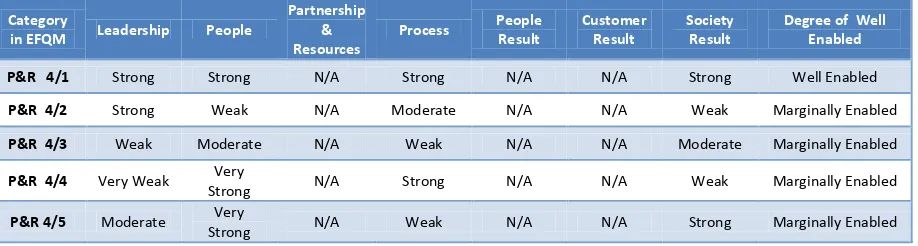
Table 2: Degree of Well Enabled Evaluation to ABCD2
Category
in EFQM Leadership People
Partnership & Resources
Process People Result
Customer Result
Society Result
Degree of Well Enabled
Strategy
2/1 Strong Strong Strong Very Weak N/A Very Weak N/A Marginally Enabled
Strategy
2/2 Strong Moderate Moderate Weak N/A Strong N/A Marginally Enabled
Strategy
2/3 Strong Moderate Strong Weak N/A Very Weak N/A Marginally Enabled
Strategy 2/4
Very Strong
Very
Strong Strong Moderate N/A Very weak N/A Marginally Enabled
Strategy
2/5 Strong Strong Strong weak N/A Very Weak N/A Marginally Enabled
Strategy
[image:7.595.66.531.543.698.2]Table 3: Degree of Well Enabled Evaluation to ABCD3
Category
in EFQM Leadership People
Partnership & Resources
Process People Result
Customer Result
Society Result
Degree of Well Enabled
P&R 4/1 Strong Strong N/A Strong N/A N/A Strong Well Enabled
P&R 4/2 Strong Weak N/A Moderate N/A N/A Weak Marginally Enabled
P&R 4/3 Weak Moderate N/A Weak N/A N/A Moderate Marginally Enabled
P&R 4/4 Very Weak Very
Strong N/A Strong N/A N/A Weak Marginally Enabled
P&R 4/5 Moderate Very
Strong N/A Weak N/A N/A Strong Marginally Enabled
In this stage three analysis methods (Exploratory, Synthesis, and Hypothesis) are deployed in which the selection of these analyses or other analysis should be critically reviewed based on the requirements of the model subject for validation.
3.1.4 Exploratory analysis
Exploratory analysis aims to find research patterns that aren’t predicted by the researcher’s current knowledge or pre-conceptions. Researcher thus collected the studied data and constructed the data into matrix table. An analysis is established to ensure the cause-effect relation in between the components for further research.
3.1.5 Synthesis Analysis
Synthesis analysis is to discrete the studied model into individual groups for the detail research on the particular characteristics.
3.1.6 Hypothesis Analysis
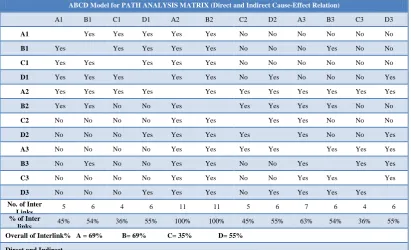
Hypothesis analysis is performed to confirm the outcome from the exploratory analysis by making various assumptions. A series of tests is established based on these assumptions and the data from the testing is analysed. To investigate any business excellence model such as EFQM, a model is constructed in AMOS. The EFQM theory model in figure 5, is viewed as three groups as shown in figure 6, the first group called ABCD1 and consist of the leadership, people, process, people result and key result, second group ABCD2 has Leadership, strategy, process, customer result and key results, and the third group is Leadership, Partnership & Resources, process, society result and key results and called ABCD3. "A" Category generally represent the Leadership which is considered to be the driver of the model. As shown in table 4, the
leadership represents 10% of weighted criteria, but represent approximately 69% of the inter link of all components. It focus on the importance of the tie-in up from driver to results and ensure that the chain of all excellent practice (sub-criteria) has a great positive influence. "B" Category represent 30% of overall model and consists of three enablers in parallel , people, strategy and resources & partnership and about 69% of the inter link of related components. These three enablers can generally be managed through the Leadership as a driver and a process as a system and a result as an outcome."C" Category describe the process and represent 10% of overall model and 35% of the inter link of the criteria and its sub criteria, because most activities and approaches need process to implement. “D” Category represents the results of the model and represents 50% of the overall model and around 55% of the inter link of the five enablers (leadership, People, Strategy, Partnership and resources and Process, service and product).
3.1.7 Model Specification
Figure 6: EFQM theory model is built to clearly map out the overview of study.
Table 4: ABCD Categorization of Components in a business model and Cause Effect Relation Matrix. ABCD Model for PATH ANALYSIS MATRIX (Direct and Indirect Cause-Effect Relation)
A1 B1 C1 D1 A2 B2 C2 D2 A3 B3 C3 D3
A1 Yes Yes Yes Yes Yes No No No No No No
B1 Yes Yes Yes Yes Yes No No No Yes No No
C1 Yes Yes Yes Yes Yes No No No No No No
D1 Yes Yes Yes Yes Yes No Yes No No No Yes
A2 Yes Yes Yes Yes Yes Yes Yes Yes Yes Yes Yes
B2 Yes Yes No No Yes Yes Yes Yes Yes No No
C2 No No No No Yes Yes Yes Yes No No No
D2 No No No Yes Yes Yes Yes Yes No No Yes
A3 No No No No Yes Yes Yes Yes Yes Yes Yes
B3 No Yes No No Yes Yes No No Yes Yes Yes
C3 No No No No Yes Yes No No Yes Yes Yes
D3 No No No Yes Yes Yes No Yes Yes Yes Yes
No. of Inter
Links 5 6 4 6 11 11 5 6 7 6 4 6 % of Inter
links 45% 54% 36% 55% 100% 100% 45% 55% 63% 54% 36% 55% Overall of Interlink% A = 69% B= 69% C= 35% D= 55%
[image:9.595.93.505.420.670.2]3.2 Stage 2: Build
To validate a model, two models needs to be built, theory and measurement model. The behavior of independence of individual groups is considered into hypotheses analysis and also Break and Make should be conducted as and when modification is necessary.
3.2.1 Hypothesis Development into questionnaire
The observed data is collected through survey questionnaire where are developed from hypothesis analysis. The expectation to collect feedback from the data provider should be estimated. Certain information may be sensitive to the data provider or the reaction from data provider may not be suitable for the study. Alternate channel for the data collection should be ready and the data filtering may be required.
There are numbers of online questionnaires or survey service solutions are provided a low cost, faster and simpler design methodologies. Some of them also provide the solution to convert the collected data into particular statistical analysis software format such as SPSS
3.2.2 Instrument for data collection & processing (SPSS)
SPSS software is utilised to process the collected survey data into a set of database which will be used to check reliability value of the data and then integrate them in the AMOS modelling. AMOS is one of the popular software programs (Analysis of Moment Structures) (Arbuckle, 1997; Kline, 2005). Structural Equation Model (SEM) emerged in the mid 1980’s
3.2.2.1 SPSS Data & Variables Structure Setting
This section introduces the SPSS information structure. The collected data from the questionnaire must be in SPSS data format or otherwise format conversion is required.
SPSS consists of two major parts is store the base information, i.e. data views and variable views. The Data view reflects the collected data whereas variable view configures variables.
Data view shows the raw data sets. The rows represents individual cases and the columns represent variables.
Variables’ configuration is needed to set and determine the results especially “Type, “Value” and “Measure”.
“Type” of the variables can be set to either “Numeric” or “String”. “Numeric” type means the variable may contain number only whereas “String” type may contain letters or numbers.
“Value” indicates the label by different numbers. In this research study, the label of answer represent the numerical values are as following
1.00 = “Strongly Disagree” 2.00 = “Disagree”
3.00 = “I don’t know” 4.00 = “Agree”
5.00 = “Strongly Agree”
“Measure” indicates the level of measurement. In our case we use “Ordinal”.
a. Nominal- A variable can be treated as nominal when its values represent categories with no intrinsic ranking. Examples: brown, blue and green.
b. Ordinal -A variable can be treated as ordinal when its values represent categories with some intrinsic ranking i.e. the highest the value represent the highest rank. Examples: 1 = Strongly Disagree; 5 = Strongly Agree.
c. A variable can be treated as scale when its values represent ordered categories with a meaningful metric. Example three people of heights 1.5m, 1.75m, and 2m.
3.2.3 Modelling- AMOS
Measurement Model can be constructed using one of the families of statistical procedures that includes techniques such as path analysis. One available software for this purpose is the Structural equation modelling (SEM) software; it allows to evaluate hypotheses by testing whether a theoretical model of what tests suppose to measure is consistent with the observed covariance (Kline, 2005; Cole and Maxwell 2003).
AMOS (Analysis of Moment Structures) is sub-software for SPSS. It is a graphical interface to specify model by illustrating them in drawing. AMOS implements the general approach to data analysis know as structural equation modeling (SEM), also known as analysis of covariance structures, or casual modeling.
AMOS is used as it will determine the successful completion of AMOS estimation.
a. Positive degree of freedom b. Enough number of cases c. Model fitness indices
d. Avoid missing data/ duplicated data
3.3 Stage 3: Check
The check covers all the tests required to validate and verify the model fitness. It has two parts; the first part starts with the Reliability tests, and model identification, and the second parts finalise the model fitness tests.
3.3.1 Reliability test
Alpha Cronbach Reliability Test normally conducted to evaluate the reliability of a set of measurement data such as questionnaire, survey. Nunnally (1978) indicated that in the reliability test result should not be less than 0.7 for the further estimation and calculation. The groups of the data from at least two observed variables to the particulate latent variables are needed to be tested in a single reliability test.
In SPSS software, there is a feature to improve the reliability value by estimate “deletion for improvement” between the data. However, this is not the perfect solution. The worst case for unacceptable value is to redo the data collection. The reliability value must reach at least 0.7 or else the data will not be accepted.
3.3.2 Check Model Identification (Degree of freedom)
Before testing the relationship among model components/ variables, the model must be over-identified i.e. the degree of freedom are positive or the numbers of known parameter is more than unknown. The results should determine that the model is over-. If the model is found to be just identified or under-identified, necessary fixing action should be done such as adding the variables to the model. The degree of freedom may be changed during model modification to improve the fitness. Therefore, no further action for “over-identified” condition is required.
3.3.3Breakdown Detection
Breakdown test is required to detect the existing common limitations in the model. Breakdown
including collinearity, misspecification and autocorrelation will be minimized in this step.
Collinearity or Multicollinearity (Carriquiry, 2004; Rajdeep, 2004; Vijay, 2000; Fernandez, (1997) is always exists between variables. It is defined as two or more independent variables that highly correlated to each other thus given an inaccurate regression to the respective depend variable. Calvo at el (2013) encourages application of variance inflation factor (VIF) to investigate of multi-correlation among more than three variables in order to avoid the violation of basic assumptions for regression analysis. The researcher may face the difficulty in interpretation of the model because of this inaccurate regression.
The detection can be done by using variance inflation factor (VIF) calculation (Belsley et al., 1980; Greene, 1993) i.e.
���
=
��−��
(1)
�� is the coefficient of determination. The indicative value of problematic collinearity is 10 or more which need corrective action against it. Corrective action such as removing redundant independent variables and aggregating similar independent variables will effectively solve the collinearity.
Autocorrelation is a frequent breakdown in time series analysis when the residual term to a variables present is showing significant coefficient. The appearance of autocorrelation will cause the estimated of standard errors coefficient biased and larger thus the expected result from the studied model will not be achieved.
3.3.4 Regression Estimation
statistic software is used to compute the correlation such as AMOS (Analysis of Moment Structures). In AMOS, the regression and correlation between the variables are calculated. All values are meaning full to the model. However, the result may be influenced by breakdown. Therefore breakdown analysis should go through to minimize the influence.
For the model estimation, the equation (Greene, 2007) should be defined from two ways which mentioned in the step of Correlation Analysis. . Aleš at el (2013) compared two type of correlations; Pearson and Spearman and suggested that spearman's correlation is more suitable for non linearity related variables over the Pearson's correlation which is a statistical measure of the strength of a linear relationship between paired data. We define the targets as dependent variables, �� and the n numbers of predicting factors which are observerable as independent variables, ���. How the ��� to affect the ��which much rely on the certain
unknown coefficient, β� or correlation values/ regression is our concern in this section. The common structural equation is described as follow (Vijay, 2000; Kline, 2005; Greene, 2007):
�� = β�+ β����+β����+ … + β����+ ε� (2)
Where β0 is intercept and εi. is the disturbance
that is not correlated to the regression. In Normal equation, it is written as
�= ��+����+����+. . . + ���� (3)
Note: The Roman letters (the b’s) are estimates of the corresponding Greek letters (the β’s)
It also can be intrepreted as Total effect, � = sum of direct effect, b0 and indirect effect of ����.
3.3.5 Model Fitness
The ability to test measurement model across multiple groups also provide a way to evaluate measurement invariance or construct bias, which means that the fitness test measures the same constructs with the same accuracy in different samples. Computer programs are essential tools for conducting analysis and other type of SEM.
There are common type of SEM such as Path Analysis (Barbara, 2001), Confirmatory Factor Analysis (CFA) (Schereiber, 2006), Exploratory Factor Analysis (EFA) (Ullman, 2001) and Structural Regression Model. The path analysis,
which also known as causal modelling, focuses on examining the network of relationships among the observed variables.
Fitness measure is designed to evaluate how the model fits the data in dataset. In most of the research literatures, 5 or more than 5 fitness criteria are measured. The popular fitness criteria are Ratio between X2 and degree of freedom, Adjunct fit indices (AFI), Goodness-Of-Fit (GFI), Root Mean Square Error of Approximation (RMSEA), Root Mean Square Residual (RMR), Adjusted Goodness-Of-Fit (AGFI), Bentler-Bonett Non-Normed Fit Index (NNFI), Comparative Fit Index (CFI) and etc. Various empirical researches (Chen, 2008, ; Shih 2009; Hsien, 2010) applied a set of goodness of fit indices in their studies which are popular such as are Ratio between X2 and degree of freedom, Adjunct fit indices (AFI), Goodness-Of-Fit (GFI), Root Mean Square Error of Approximation (RMSEA), Root Mean Square Residual (RMR), Adjusted Goodness-Of-Fit (AGFI), Bentler-Bonett Non-Normed Fit Index (NNFI), Comparative Fit Index (CFI) and etc. However Daire at el (2008) states fit indices are a useful guide, a structural model should also be examined with respect to substantive theory.
3.4 Stage 4: Decide
The last stage of validation is when analysis is completed, building the model is successfully achieved and all the necessary checks carried out to verify the model fitness, the last stage is to decide the fitness for purpose by a clear set of criteria. During the decision it is understood that any changes and modification can take place to bring the results up to the satisfactory levels of validation.
3.4.1 Decide Model Validation
It is important to verify and determine the correlation values, the regression and Model fitness tests. This step is mainly focus on decision making process for every test and the final decision of model validation.
3.4.2 Decide Model Fit Criteria
At least 5 fitness criteria to be met in the test or else the model should be modified with theory justification.
3.4.3 Model Modification and Refitting
adjusted and the model to be retested. Most of the solutions such as re-specify the fixed and free parameters, adding paths or covariance are the common practices in such cases. The modification should meet with the theory interpretation or else the modification is not recommended. Every single parameter or path modification require single test on it until the fitness achieved. Trim the unwanted variables or insignificant variables or adding a possible connection to variables may contribute significant relationship.
3.4.4 Interpretation of the valid model
All valid models should be interpreted. It must be carried out for both theory model and valid measurement model, the comparison for both maybe different due to the realistic factors. The popular fitness criteria are as follow:
• Ratio between X2 and degree of freedom < 5 • Adjunct fit indices (AFI) > 0.9
• Goodness-Of-Fit (GFI) >0.9
• Root Mean Square Error of Approximation (RMSEA) < 0.05
• Root Mean Square Residual (RMR) < 0.05 • The Adjusted Goodness-Of-Fit (AGFI) > 0.8 • Bentler-Bonett Non-Normed Fit Index (NNFI)
>0.9
• Comparative Fit Index (CFI) > 0.9
3.4.5 Fitness for Purpose
The conclusion to announce the validity of the model when the model is tested with reliable data, good model fitness and able to be interpreted.
4. Conclusion and contribution to
knowledge
A practical ABCD Model analysis was developed as a management tool to enable researchers and practitioners to validate step by step and study a business excellence model with a systematic approach.
The ABCD Model Analysis also verify the interlinks between the components and their practices that enable the business model to achieve their results. These enablers were verified through ABCD lances “Degree of Well enabled” which accordingly will represents the effectiveness of the
enablers in the model. ABCD Model Analysis is a new method for successful validation process that ensures simplicity, systematic, scientific step by step eliminating all the drawbacks and limitations of different techniques. Also the ABCD Model Analysis is innovative integrated framework that contains various best practice techniques and methods for different steps of validation process. When designing the conceptual model that can be either a new business excellence model or an existing one.
The ABCD Model Analysis is simple, direct, focus, accurate, logical, informative, and practical. It also complies with the best practice of the most validation techniques and overcomes the drawbacks and limitations associated with the current validation methods.
The ABCD Model is not only Validation tool and it is not only tells you how to validate but tells you how good your validation is through the ABCD validation score.
5. Limitation and future work
This paper introduces the new ABCD Model Analysis and therefore it may require improvements and modification based on the feedback of the ABCD validation practitioner. The ABCD Model Analysis focused only on the Business Excellence Models, it can be expanded to cover the other models such as Business Process Models and Decision Making Models that may be required for validation. The ABCD Model Analysis can be further developed in a form of software that can operate and provide validation through seamless of information and data shared in a common platform or apply online and obtain results within minimum time required.
References:
[1] Aleš Kubíček, Ondřej Nowak, Jiří Hnilica
(2013), ‘An Empirical Study of the Corporate Governance Effectiveness in the Czech Republic’, International Journal of Economics and Statistics, Volume 1, 2013
[2] Arbuckle, J. L. (1997), ‘Amos user’s guide: version 3.6’, Chicago, SmallWaters Corp. [3] Barbara, M.B. (2001), ‘Structural
[4] Belsley, D.A., Kuh, E. and Welsch, R.E. (1980) ‘Regression Diagnostics. Identifying Influential Data and Sources of Collinearity.’ New York: John Wiley & Sons.
[5] Boris Mutafelija, Harvey Stromberg (2003) ‘Systematic Process Improvement Using ISO
9001:2000 and CMMI’ Artech House,
ISBN1580536395, 9781580536394
[6] Calvo-Mora Schmidt, Arturo, Picón Berjoyo, A., Ruiz Moreno, C., & Cauzo Bottala, L. (2013). ‘Soft-Hard TQM factors and key business results’, WSEAS Transactions on Business and Economics, 1(10), 14-23.
[7] Carriquiry, A. (2004) ‘Model Diagnosis Multicollinearity.’ Stat328.
[8] Chen, C. H., & Lee, H. Y. (2008). ‘Empirical analysis of the customer loyalty problem in the
international logistics market’. WSEAS
Transactions on business and economics, 5(4), 107-117.
[9] Cole, D. A. and Maxwell, S.E (2003) ‘Testing Mediational Models with Longitudinal Data: Questions and Tips in the Use of Structural Equation Modeling.’ Journal of Abnormal Psychology, Vol. 112(4), Nov 2003, 558-577. [10] Cole, D. A. and Preacher, K. J. (2014)
‘Manifest Variable Path Analysis: Potentially Serious and Misleading Consequences Due to Uncorrected Measurement Error’, Psychological Methods, Vol. 19: pp. 300 – 315. [11] Daire Hooper, Joseph Coughlan, and
Michael R. Mullen, (2008) ‘Structural Equation Modelling: Guidelines for Determining Model Fit’, Electronic Journal of Business Research Methods Volume 6 Issue 1 2008 (53-60)
[12] EFQM (2013), ‘RADAR as a management tool” EFQM Webinar, Abingdon & Witney College
[13] Fernandez, G. C. (1997) ‘Detection of model specification, outlier, and multicollinearity in multiple linear regression model using partial regression residual plots.’ P.1246-1251. SAS Users Group International Conference, San Diego, CA.
[14] Ghaziani, A. and Ventresca, M.J (2005) ‘Keywords and cultural change’: Frame analysis of business model public talk 1975-2000. Sociological Forum, Vol. 20: 523-559. [15] Greene, W.H. (1993) ‘Econometric
Analysis. Englewood Cliffs’, NJ, Prentice-Hall. [16] Greene, W. H. (2007) ‘Multiple Regression
Basic Collection’ New York University.
[17] Howarth, Tim and Watson, Paul (2008) ‘Applying project management concepts and tools to built environment research projects.’
Northumbria Working Paper Series: Interdisciplinary Studies in the Built and Virtual Environment, 1 (2). pp. 159-170. ISSN 1756-247
[18] Hsien-Lun Wong, Mei-Chi Tsai, (2010) ‘The Effects of Service Encounter and Experiential Value on Consumer Purchasing Behavior’. Wseas Transactions on Business and Economic, 2(7), 59-68
[19] John C. Goodpasture (2010) ‘Project Management the Agile Way: Making it Work in
the Enterprise’ J. Ross Publishing,
ISBN1604270276, 9781604270273
[20] Kline, R.B. (2005) ‘Principles and Practice of Structural Equation Modeling’ 2nd Edition, New York: The Guilford Press.
[21] Morris, M. , Minet, S. and Jeffrey, A. (2005) ‘The entrepreneur’s business model: toward a unified perspective’, Journal of Business Research, Vol. 10, No. 10, Issue 16, Witting Chair in Entrepreneurship, Syracuse University, Syracuse, NY 13244, US, Miami University, Oxford, OH 45056, USA, University of Central Florida, Orlando, FL 32816, USA respectively.
[22] Michel Jaccard, (2013), ‘The Objective is Quality: An Introduction to Performance and Sustainability Management Systems’, CRC Press, ISBN146657299X, 9781466572997
[23] Mitchell, D.W. and Coles, C.B. (2004) ‘Establishing a continuing business model innovation process’, Journal of Business Strategy, Vol. 25 Iss: 3 pp. 39 - 49.
[24] Nunnally, J. C. (1978) ‘Psychometric theory’ (2nd ed.). New York: McGraw-Hill. [25] Rappa, M, (2001) ‘Business models on the
web managing the digital enterprise’. Last Accessed 1st December 2014 from digitalenterprise.org/models/models.html.
[26] Rajdeep Grewal, Joseph A. Cote, and Hans Baumgartner (2004) ‘Multicollinearity and Measurement Error in Structural Equation Models: Implications for Theory Testing’ Marketing Science Fall 2004, Vol. 23, pp.519-529
[27] Schereiber, J. N. (2006) ‘Reporting Structural Equation Modeling and Confirmatory Factor Analysis Results: A Review.’ The Journal of Educational Research, Vol. 99, No. 6, pp. 323-337.
[28] Shih, M. L., Lin, S. H., Hsiao, S. H., Huang, L. M., Chiu, C. C., & Chen, K. Y. (2009). ‘The study of the correlation among personality traits, leadership competence and
Transactions on Business and Economics, 1(6), 11-20.
[29] Sokovic, M., Pavletic, D., & Pipan, K. K. (2010). ‘Quality improvement methodologies– PDCA cycle, RADAR matrix, DMAIC and DFSS’. Journal of Achievements in Materials and Manufacturing Engineering, 43(1), 476-483.
[30] Tom Ritchey (2012) ‘Outline for a Morphology of Modelling Methods-Contribution to a General Theory of Modelling’. Acta Morphologica Generalis. AMG Vol.1 No.1 (2012)
[31] Ullman, J. B. (2001) ‘Structural equation modeling’. In Tabachnick B.G & L. S. Fidell L.S .(Editors), Using multivariate statistics (4th Ed. pp. 653-771)”. Needham Heights, MA: Allyn & Bacon.
[32] Vijay Gupta. (2000) ‘Regression Explained in Simple Terms’ VJBook Inc. (last Accessed on 12/8/2014,