Study of the electronic nematic phase of Sr
3Ru
2O
7with precise control of
the applied magnetic field vector
J. A. N. Bruin,1R. A. Borzi,2S. A. Grigera,1,3A. W. Rost,1R. S. Perry,4and A. P. Mackenzie1,5 1SUPA, School of Physics and Astronomy, University of St. Andrews, St. Andrews KY16 9SS, United Kingdom
2Instituto de Investigaciones Fisicoqu´ımicas Te´oricas y Aplicadas, UNLP-CONICET, 1900 La Plata, Argentina
3Instituto de F´ısica de L´ıquidos y Sistemas Biol´ogicos, UNLP-CONICET, 1900 La Plata, Argentina
4SUPA, School of Physics, University of Edinburgh, Edinburgh EH9 3JZ, United Kingdom
5Max-Planck Institute for Chemical Physics of Solids, D-01187 Dresden, Germany
(Received 16 January 2013; published 12 April 2013)
We report a study of the magnetoresistivity of high purity Sr3Ru2O7, in the vicinity of its electronic nematic
phase. By employing a triple-axis (9/1/1 T) vector magnet, we were able to precisely tune both the magnitude and direction of the in-plane component of the magnetic field (H). We report the dependence of the resistively determined anisotropy onHin the phase, as well as across the wider temperature-field region. Our measurements reveal a high-temperature anisotropy which mimics the behavior of fluctuations from the underlying quantum critical point, and suggest the existence of a more complicated phase diagram.
DOI:10.1103/PhysRevB.87.161106 PACS number(s): 71.27.+a, 72.15.−v, 74.70.Pq
Since the pioneering work of Pomeranchuk,1 it has been
known that a fluid of interacting electrons might, in principle, develop a spontaneous macroscopic anisotropy. Through the 1990’s, solutions of idealized models of electrons on lattices showed that a variety of spin and charge orders can occur that break the symmetries of the underlying lattice and are purely driven by electron-electron interactions. The most celebrated of these, stripes, have been widely discussed in relation to the cuprate high-temperature superconductors.2 When the
stripes are static there is both a macroscopic anisotropy and an observable translational symmetry breaking, but states in which translational symmetry is preserved may also exist. The analogy between this behavior and that seen in liquid crystals has led to the adoption of liquid crystal terminology in correlated electron systems: A static stripe phase is equivalent to an electronic smectic, while a metal showing rotational but not translational symmetry breaking is often referred to as an electronic nematic.3
In recent years, rapid advances have been made. Electronic nematicity has been reported in high purity two-dimensional electron gases (2DEGs),4,5 Sr
3Ru2O7,6 cuprates,7–10 pnictides,11–13 and URu
2Si2,14 stimulating a considerable body of theoretical work.15 In some cases, however, interpretation of the observations is complicated by the coexistence of nematicity with other ordering phe-nomena. One of the main requirements for further progress is identifying systems in which the onset of anisotropy can be unambiguously determined, and their physical properties established in depth. The material that is the subject of this Rapid Communication, Sr3Ru2O7, is a particularly attractive host for such experiments. It is a layered perovskite metal in which conduction occurs in stacks of Ru-O bilayers. The two Ru-O planes in each bilayer couple relatively strongly, but bilayer-bilayer coupling is weak, so the electronic structure is nearly two dimensional.16–19 In high magnetic fields of
approximately 8 T applied normal to the Ru-O planes, a novel phase forms in the purest crystals.20,21 Tilting the field
to a small angle θ produces an in-plane field component which uncovers a large twofold in-plane transport anisotropy
whose easy and hard directions are perpendicular and parallel, respectively, to the direction of the in-plane field.6
While neutron studies were unable to resolve any ac-companying anisotropic response of the lattice to the onset of the electronic anisotropy,6 it was recently shown by dilatometry measurements to be less than one part in 106.22 This suggests that the coupling of the electronic distortion to the crystal lattice is extremely weak, and means that Sr3Ru2O7 offers, in principle, an ideal opportunity to study the way in which electronic nematics form and behave. In this Rapid Communication, we report an experimental study of the transport-derived nematic susceptibility which reveals the full richness of the Sr3Ru2O7phase diagram.
In order to investigate the effect of an in-plane field with high experimental precision, it is necessary to tune its magnitude and orientation with respect to the sample. This cannot be done directly using a standard single-axis rotator. Although interesting experiments can be attempted using octagonal samples with multiple contact configurations,23
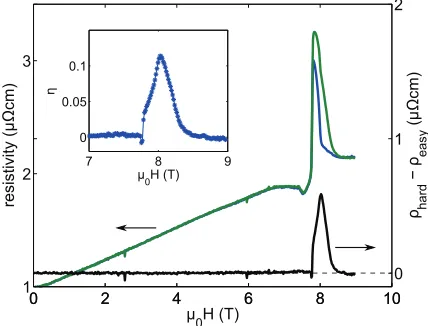
FIG. 1. (Color online) Magnetoresistance of Sr3Ru2O7 vs an
applied field tilted atθ=6.4◦parallel (green trace) and perpendicular (blue trace) to a current applied along the tetragonalaaxis, as well as the difference between these (black trace). The inset shows the dimensionless anisotropyη(see main text). Up to 7.78 T it is zero within our experimental resolution but then jumps sharply into a region of strong transport anisotropy, which weakens gradually before returning to zero above approximately 8.5 T.
In Fig.1we show the magnetoresistivity of a single crystal of Sr3Ru2O7 as a function of the applied field modulus at θ=6.4◦ and T =100 mK. At this tilt angle the in-plane field H reaches 1 T when the c-axis field is 9 T. In both measurements the current was passed along the tetragonala axis,25 but for the blue curve the in-plane field component is perpendicular to the current (the easy direction), while for the green curve it is parallel to it (the hard direction). Both the current and voltage contacts to the crystal remain identical, so this is a precise measurement of whether or not the resistivity changes for the two perpendicular in-plane field directions. Within our resistivity noise level of 2 ncm/√Hz, the resistivity is identical until the sharp jump at 7.78 T, as demonstrated by the black curve (ρhard−ρeasy) in Fig.1. At higher fields there is a clear resistive anisotropy, which then falls to zero within experimental resolution near the experimentally limited maximum field. A convenient dimensionless measure of the degree of anisotropy is the ratio η=(ρhard−ρeasy)/(ρhard+ρeasy). We illustrate the onset and subsequent disappearance of anisotropy by plotting η as a function of field in the inset of Fig.1.
The data shown in Fig.1emphasize the first key result of this Rapid Communication: the uniqueness of Sr3Ru2O7as a model material for the investigation of electronic nematicity. In all the systems in which large anisotropies have been observed, a symmetry-breaking field has been required to reveal them. In the 2DEGs, sample strain has been suggested as the source of this symmetry-breaking field,4 while in the
cuprates and pnictides it arises from a preexisting lattice anisotropy. In the latter case, deconvolving the nematicity due to electronic interactions from coupling to the anisotropic lattice is challenging, though ways of doing so have been proposed.7,11,26 In Sr
3Ru2O7, two issues could in principle complicate the interpretation of transport data. First, there is one report of a small lattice anisotropy of approximately five
parts in 104 even at zero applied magnetic field.27 Although
small, and not reported in other crystallographic studies,28,29
it could be a source of twofold transport anisotropy. Second, an in-plane field component could lead to transport anisotropy because of the difference between transverse and longitudinal magnetoresistance.30 The fact that we resolve twofold
trans-port anisotropy only in a restricted range of fields shows that both effects are negligible in Sr3Ru2O7. Combined with the dilatometry data showing that the lattice anisotropy introduced by entering the region of twofold transport is less than one part in 106, this provides strong evidence that the twofold transport in Sr3Ru2O7 is induced by electron interactions. Further, the fact that the magnetoresistance makes such well-defined changes from fourfold (η=0 to within high experimental precision) to twofold (η >0) strongly suggests that it is associated with symmetry breaking of the interacting electron system.
In Fig. 2(a) we show data in the close vicinity of the region of resistive anisotropy, forθ=7.5◦andT =100 mK. The field labels facilitate comparison with previous thermody-namic and magnetic data, which have established the existence of first-order phase transitions atH1 andH2 on the basis of dissipative peaks in the imaginary part of low-frequency ac susceptibility31 and features in the magnetocaloric effect.21
The data show that, as the field increases, the initial sharp rise in the anisotropy occurs atH1. Although there is a feature in ρhardatH2, anisotropy does not disappear there, but persists to the higher fieldH3.
The existence of resistive anisotropy betweenH2 andH3, beyond the boundaries of the previously identified phase, is the second key result reported in this Rapid Communication. Electrical transport in Sr3Ru2O7is based mainly on bands with Ru 4dxy, 4dxz, and 4dyzcharacter. A body of theoretical work
has shown that electronic anisotropy can arise from instabil-ities of either the quasi-one-dimensional (1D) 4dxz,yz-based
bands32,33 or from a (bilayer-split) quasi-two-dimensional (2D) model.34,35The real Fermi surface is quite complicated,
however, and the portions which are most strongly renor-malized have hybrid 4dxy and 4dxz,yz character.18 It seems
plausible, therefore, that multiple instabilities may exist, as addressed recently in a model predicting a multicomponent phase diagram,36 and evidence for lattice constant anisotropy
aboveH2has also been reported.37
The observed transport anisotropy between H2 and H3 shows that the phase diagram of Sr3Ru2O7 is more complex than previously thought, motivating a thorough investigation of the field, temperature, andθdependence of the anisotropy. We have performed such a study, measuringηin the vector magnet for 7 T< B <8.5 T, 0.1 K< T <6 K, andθ=1◦, 2◦, 4◦, 6.4◦, and 7.5◦. In Figs.2(b)and2(c)we show samples from this data set, namely, the temperature dependence ofη atθ =7.5◦, for temperatures between 6 K and 100 mK, for fields between theH1andH2, and fields aboveH2and below H1, respectively.
[image:2.608.65.279.72.235.2](a)
(b)
(c)
FIG. 2. (Color online) (a) Data for magnetoresistance along the hard (green) and easy (blue) directions as a function of field tilted to θ=7.5◦, T =100 mK. The labelsH1 and H2 mark the fields
at which peaks in the magnetic susceptibility have been identified (see main text), taking into account the weakθdependence of these features (Ref.32). (b), (c) Dimensionless anisotropyη(see main text) as a function of temperature forH1< H < H2andH2< H < H3,
respectively. The data (solid markers) are interpolated from field sweeps at fixed temperature. The insets present points of greatest slope inη(T) (blue markers), as well as the loci ofH1(red markers)
andH2 (black markers), extracted as the points of greatest slope in
ρhard(H).
to be accompanied by the formation of domains which would mask the microscopic anisotropy from observation in macroscopic measurements.6 In layered compounds such as Sr3Ru2O7 it is also possible that even in monodomain samples the preferred direction might rotate from layer to layer, again preventing the observation of anisotropy.34,35 If
a microscopic order parameter exists, the field that is applied to reveal the anisotropy must couple to it, so what is actually
measured is the response of the system to the application of that field, which in the case of Sr3Ru2O7 is H. The first feature of Fig.2(b)that is consistent with this basic picture is the pronounced high-temperature “tail” seen inη. Small but resolvable anisotropy exists to 6 K, the maximum temperature shown. Below approximately 1 K, η rises rapidly from its “background” value. As shown in the inset (blue markers), the temperatures at which this happens agree closely with those of second order phase transitions previously identified for H=0.21 The finite high-temperature anisotropy along
with a pronounced increase at 1 K are characteristic of the behavior expected for an ordered system in the presence of an external field to which it couples, and are reminiscent of previous measurements on the anisotropic state that exists at high field in high purity 2DEGs.4
Data forH2< H < H3[Fig.2(c)] share some but not all of the features of the data shown in Fig.2(b). The “tail” extending to 6 K is still evident, as is the rise inηat low temperatures. The temperatures at which this rise occurs are lower and there is no evidence for the low-temperature saturation ofη seen at most fields betweenH1 andH2, but the data close to H2 show little qualitative difference on either side of it. This suggests that there might be a second phase betweenH2 and H3, raising the question of why it has not so far been observed in thermodynamic measurements. The issue may be disorder. The previously identified phase betweenH1andH2is strongly dependent on sample purity, and only becomes well defined in samples with mean free paths of several thousand angstroms. If there were a phase betweenH2andH3with a lower transition temperature, it might be expected to suffer significant disorder broadening even at this high level of sample purity, making a thermodynamic signature difficult to observe. Our transport observations motivate further thermodynamic experiments to clarify this issue.
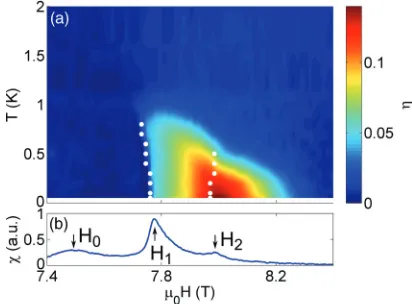
[image:3.608.73.270.68.505.2]FIG. 3. (Color online) (a) The temperature and field dependence of the dimensionless anisotropy ratioηmeasured, as described in the main text, in a field tilted atθ=7.5◦. The white dots show the loci of H1andH2, as extracted from points of greatest slope ofρ(H). The
endpoints of the first order lines were determined by comparison to ac magnetic susceptibility. (b) The field dependence of the ac magnetic susceptibility at 100 mK,θ≈7◦, over the same range of magnetic fields (background subtracted).
In Fig.3(a)we summarize all the data in the vicinity of the regions of strong anisotropy in a color scale contour plot ofη forθ=7.5◦, based on interpolating data taken at 17 closely spaced temperatures. The data shown in the insets of Figs.2(b) and2(c)forH1andH2are superposed here as white dots. The contouring ofηin the higher field region is suggestive of that region being associated with a second phase.
Comparison with magnetic susceptibility data for similar θ [Fig.3(b)] reveals a final noteworthy feature of the phase diagram. In addition to the sharp peaks atH1andH2, which are known to signal first-order phase transitions,20,21,38 there
is a broader peak at the lower field H0. Although it is associated with a larger moment change than that at H2,
there is no evidence from either the imaginary part of the magnetic susceptibility or the magnetocaloric effect that it signals a first-order magnetic transition. It might in principle be a crossover or a broadened second-order transition (either a critical endpoint or a symmetry-breaking transition to finite q order of some kind). Whether it is a crossover or a phase transition, it is clearly not associated with the onset of low-temperature transport anisotropy. The resistivity falls slightly, but retains fourfold symmetry within our experimental resolution. In contrast, the disappearance of anisotropy atH3 does not coincide with any large feature in the magnetic susceptibility. The overall picture that emerges from these measurements is that the phase diagram of Sr3Ru2O7may be richer than previously thought. High-precision thermodynamic measurements extending to temperatures below 100 mK are highly desirable.
In conclusion, we have used a vector magnetic field to per-form a series of high-precision measurements of anisotropic transport in Sr3Ru2O7. Within our high experimental res-olution, we observe well-defined transitions from fourfold to twofold to fourfold symmetry of in-plane resistivity as a function of magnetic field. Transport anisotropy exists in a region of field higher than that bounding a previously identified anisotropic phase. Even when the resistivity is fourfold symmetric at low temperatures, some anisotropy can be induced at higher temperatures, consistent with nematic fluctuations being an integral feature of the broader quantum critical phase diagram that is known to exist for Sr3Ru2O7.
We thank S. A. Kivelson and S. Raghu for stimulating discussions. This work was supported by the EPSRC (UK), R.A.B. and S.A.G. were partially supported by the Royal Society (UK), CONICET and ANPCyT (Argentina), and A.P.M. was supported by a Royal Society–Wolfson Research Merit Award.
1I. J. Pomeranchuk, JETP35, 524 (1958).
2S. A. Kivelson, I. P. Bindloss, E. Fradkin, V. Oganesyan, J. M.
Tranquada, A. Kapitulnik, and C. Howald,Rev. Mod. Phys.75, 1201 (2003).
3S. Kivelson, E. Fradkin, and V. Emery,Nature (London)393, 550
(1998).
4M. P. Lilly, K. B. Cooper, J. P. Eisenstein, L. N. Pfeiffer, and K. W.
West,Phys. Rev. Lett.82, 394 (1999).
5W. Pan, R. R. Du, H. L. Stormer, D. C. Tsui, L. N. Pfeiffer,
K. W. Baldwin, and K. W. West, Phys. Rev. Lett. 83, 820 (1999).
6R. A. Borzi, S. A. Grigera, J. Farrell, R. S. Perry, S. J. S. Lister,
S. L. Lee, D. A. Tennant, Y. Maeno, and A. P. Mackenzie,Science
315, 214 (2007).
7Y. Ando, K. Segawa, S. Komiya, and A. N. Lavrov,Phys. Rev. Lett.
88, 137005 (2002).
8V. Hinkov, D. Haug, B. Fauqu, P. Bourges, Y. Sidis, A. Ivanov,
C. Bernhard, C. T. Lin, and B. Keimer, Science 319, 597 (2008).
9R. Daou, J. Chang, D. LeBoeuf, O. Cyr-Choiniere, F. Laliberte,
N. Doiron-Leyraud, B. J. Ramshaw, R. Liang, D. A. Bonn, W. N. Hardy, and L. Taillefer,Nature (London)463, 519 (2010).
10M. J. Lawler, K. Fujita, J. Lee, A. R. Schmidt, Y. Kohsaka, C. K.
Kim, H. Eisaki, S. Uchida, J. C. Davis, J. P. Sethna, and E.-A. Kim, Nature (London)466, 347 (2010).
11T.-M. Chuang, M. P. Allan, J. Lee, Y. Xie, N. Ni, S. L. Budko,
G. S. Boebinger, P. C. Canfield, and J. C. Davis,Science327, 181 (2010).
12J.-H. Chu, J. G. Analytis, K. De Greve, P. L. McMahon, Z. Islam,
Y. Yamamoto, and I. R. Fisher,Science329, 824 (2010).
13S. Kasahara, H. J. Shi, K. Hashimoto, S. Tonegawa, Y. Mizukami,
T. Shibauchi, K. Sugimoto, T. Fukuda, T. Terashima, A. H. Nevidomskyy, and Y. Matsuda,Nature (London)486, 382 (2012).
14R. Okazaki, T. Shibauchi, H. J. Shi, Y. Haga, T. D. Matsuda,
E. Yamamoto, Y. Onuki, H. Ikeda, and Y. Matsuda,Science331, 439 (2011).
15E. Fradkin, S. A. Kivelson, M. J. Lawler, J. P. Eisenstein, and A. P.
[image:4.608.68.274.71.223.2]16S.-I. Ikeda, Y. Maeno, S. Nakatsuji, M. Kosaka, and Y. Uwatoko,
Phys. Rev. B62, R6089 (2000).
17D. J. Singh and I. I. Mazin,Phys. Rev. B63, 165101 (2001). 18A. Tamai, M. P. Allan, J. F. Mercure, W. Meevasana, R. Dunkel,
D. H. Lu, R. S. Perry, A. P. Mackenzie, D. J. Singh, Z.-X. Shen, and F. Baumberger,Phys. Rev. Lett.101, 026407 (2008).
19J.-F. Mercure, A. W. Rost, E. C. T. O’Farrell, S. K. Goh, R. S. Perry,
M. L. Sutherland, S. A. Grigera, R. A. Borzi, P. Gegenwart, A. S. Gibbs, and A. P. Mackenzie,Phys. Rev. B81, 235103 (2010).
20S. A. Grigera, P. Gegenwart, R. A. Borzi, F. Weickert, A. J.
Schofield, R. S. Perry, T. Tayama, T. Sakakibara, Y. Maeno, A. G. Green, and A. P. Mackenzie,Science306, 1154 (2004).
21A. W. Rost, R. S. Perry, J.-F. Mercure, A. P. Mackenzie, and S. A.
Grigera,Science325, 1360 (2009).
22C. Stingl, R. S. Perry, Y. Maeno, and P. Gegenwart,Phys. Rev. Lett.
107, 026404 (2011).
23R. A. Borzi, A. McCollam, J. A. N. Bruin, R. S. Perry, A. P.
Mackenzie, and S. A. Grigera,Phys. Rev. B84, 205112 (2011).
24J. A. N. Bruin, Ph.D. thesis, University of St. Andrews, 2012. 25In the unfolded tetragonal zone theaaxis is along the Ru-Ru bond
direction.
26J.-H. Chu, H.-H. Kuo, J. G. Analytis, and I. R. Fisher,Science337,
710 (2012).
27R. Kiyanagi, K. Tsuda, N. Aso, H. Kimura, Y. Noda, Y. Yoshida,
S.-I. Ikeda, and Y. Uwatoko,J. Phys. Soc. Jpn.73, 639 (2004).
28H. Shaked, J. Jorgensen, O. Chmaissem, S. Ikeda, and Y. Maeno,J.
Solid State Chem.154, 361 (2000).
29B. Hu, G. T. McCandless, M. Menard, V. B. Nascimento, J. Y. Chan,
E. W. Plummer, and R. Jin,Phys. Rev. B81, 184104 (2010).
30If a lattice anisotropy of five parts in 104 creates no observable
transport anisotropy, a change over two orders of magnitude less is not expected to do so either, while any difference between transverse and longitudinal magnetoresistance is a strong inverse function of the scattering rate, which is higher in the anisotropic region than outside it.
31R. S. Perry, K. Kitagawa, S. A. Grigera, R. A. Borzi, A. P.
Mackenzie, K. Ishida, and Y. Maeno,Phys. Rev. Lett.92, 166602 (2004).
32S. Raghu, A. Paramekanti, E-.A. Kim, R. A. Borzi, S. A. Grigera,
A. P. Mackenzie, and S. A. Kivelson,Phys. Rev. B 79, 214402 (2009).
33W.-C. Lee and C. Wu,Phys. Rev. B80, 104438 (2009).
34C. Puetter, H. Doh, and H.-Y. Kee,Phys. Rev. B76, 235112 (2007). 35H. Yamase,Phys. Rev. B80, 115102 (2009).
36C. M. Puetter, S. D. Swiecicki, and H.-Y. Kee,New J. Phys.14,
053027 (2012).
37C. Stingl, R. S. Perry, Y. Maeno, and P. Gegenwart,Phys. Status
Solidi B250, 450 (2013).
38S. A. Grigera, R. A. Borzi, A. P. Mackenzie, S. R. Julian, R. S.