(will be inserted by the editor)
Signalling Paediatric Side Effects using an Ensemble
of Simple Study Designs
Jenna M. Reps · Jonathan M. Garibaldi · Uwe Aickelin · Daniele Soria · Jack E. Gibson · Richard B. Hubbard
Received: date / Accepted: date
Abstract Background: Children are frequently prescribed medication ‘off-label’, meaning there has not been sufficient testing of the medication to determine its safety or effectiveness. The main reason this safety knowledge is lacking is due to ethical restrictions that prevent children from being included in the majority of clinical trials.
Methods: Multiple measures of association are calculated for each drug and med-ical event pair and these are used as features that are fed into a classifier to determine the likelihood of the drug and medical event pair corresponding to an adverse drug reaction. The classifier is trained using known adverse drug reactions or known non-adverse drug reaction relationships.
Results: The novel ensemble framework obtained a false positive rate of 0.149, a sensitivity of 0.547 and a specificity of 0.851 when implemented on a reference set of drug and medical event pairs. The novel framework consistently outperformed each individual simple study design.
Conclusion: This research shows that it is possible to exploit the mechanism of causality and presents a framework for signalling adverse drug reactions effectively.
Key Points
– The ensemble of simple study designs outperformed each single simple study design when considering both the overall ability to rank adverse drug reactions and the signalling performance at a natural threshold.
– The ensemble method is adaptable as it can incorporate any new measures of association that are propose over time.
Jenna M. Reps·Jonathan M. Garibaldi·Uwe Aickelin·Daniele Soria IMA, The University of Nottingham,Nottingham, NG8 1BB
Tel.: +44 (0) 115 95 14299 E-mail: [email protected]
Jack E. Gibson·Richard B. Hubbard
– The results of the paper highlight the potential benefit of applying supervised learning for adverse drug reaction signalling.
1 Introduction
There is an abundance of evidence to support the impression that side effects in children currently present a significant public health problem [2, 7]. When there is a causal relationship between a drug and medical event it is termed an adverse drug reaction (ADR). Children of all ages can suffer from diseases that require them to take medication but the suitability of drugs in the paediatric population (0-17 years old) is generally unexplored. The majority of paediatric prescriptions are ‘off-label’ meaning the licensed medication is used in situations that have not had sufficient investigation to determine the drug efficiency or safety. Examples of off-label prescriptions are prescribing a different dosage or frequency than recom-mended, prescribing a drug for a different indication than the drug was tested for or prescribing the drug to age groups such as children where the drug has not been extensively evaluated. The paediatric population are rarely involved in clinical tri-als, so there is little evidence available to determine if a medication is efficient and safe [18] and many drugs do not have licenses for children. A study that observed a paediatric hospital in Derby, UK found that 23% of the prescribed drugs were off-label and this was lower than the off-label rate observed in four other european hospitals [7].
The problem with ‘off-label’ prescribing within the paediatric population is that there are clear physiological differences between adults and children, so the efficiency and safety knowledge discovered during clinical trials in the adult pop-ulation cannot be accurately extrapolated for the paediatric poppop-ulation [5]. Con-sequently, there has been a recent demand for incorporating more children into randomised controlled trials [6] so drug efficiency and safety can be directly evalu-ated for children. In addition to being able to assess the efficiency of drugs within the paediatric population and determine suitable dosages, there are also advan-tages for the children enrolled in trials such as access to new medicine that may reduce morbidity. However, there are also many downsides including both physical and mental discomfort, separation from parents [6] and the standard risks associ-ated with adult clinical trials [13]. These downsides may be magnified in children due to potential errors in initially estimating ‘adult equivalent’ doses, and due to additional impacts of drugs on still-developing tissues. In the worse case, a clinical trial could result in child mortalities. Therefore, if possible, it is more preferable to develop alternative means to identify ADRs that do not have these negative effects.
system database that is used to identify ADRs. As the database only contains reports detailing cases when a drug is taken and a suspected ADR occurs, and not the cases when a drug is taken and no ADRs is suspected, the frequency that drugs are prescribed is unknown. Furthermore, as the reporting is done voluntarily, it is common for data to be missing, incorrect or duplicated [4]. Consequently, there are no current algorithms that can be applied to spontaneous reporting system databases that are capable of detecting ADRs with a high accuracy, nor are the algorithms able to quantify the frequency that the ADRs occur. It is the combi-nation of a lack of clinical trials coupled with the general SRS limitations that makes the paediatric population potentially more susceptible to ADRs. Research into developing novel algorithms that are able to efficiently and effectively dis-cover qualitative and quantitative ADR information for the paediatric population is required to reduce child morbidities and mortalities.
A new type of database, called the longitudinal observational database, has started to emerge as a potentially new source of ADR information. The longitudi-nal observatiolongitudi-nal database contains sequences of patients’ medical data often span-ning decades of years and offers a new perspective for ADR discovery. One exam-ple of a longitudinal observational database is The Health Improvement Network (THIN) database that contains medical records extracted directly from general practitioners’ databases across the UK (www.thin-uk.com). The THIN database contains validated personal information about each patient in the database includ-ing their year of birth and gender. There is also a complete medical record and prescription history for each patient during the time they have been registered at the practice. However, patients may not inform their doctors of all the medical events they experience, especially minor ones, and use of over-the-counter medica-tion for self-treatment is unlikely to be recorded. As the THIN database contains information about how many patients are prescribed a drug, it may be possible to extract quantitative information about ADRs. The effect of dosage and frequency of prescription could also be investigated to identify the optimal treatment for each child. This knowledge could then be used to help personalise medication for paediatric patients based on their medical state, age and gender.
medica-tion are likely to be very healthy due to a lack of chronic or degenerative illnesses whereas children who require certain medication are likely to be very unhealthy. It follows that a novel method that does not suffer from confounding by indica-tion or require long periods of historic medical history should be more effective at signalling ADRs.
Recently, a supervised framework [17] that learns from known ADRs has been proposed to signal ADRs by using features based on the Bradford Hill causality criteria, criteria that are frequently used to determine causality. This framework was shown to perform well, and obtained a low false positive rate even when the frequency of the ADR was low. Unfortunately, the calculation of many of the Bradford Hill features require knowledge of a long medical history and this is often not available for paediatric patients. Consequently, the framework using Bradford Hill criteria based features faces difficulties when applied to detect ADRs within the paediatric population. One possible solution would be to implement an analogous framework that uses features based on the counterfactual method for causal inference, as these features can be chosen such that a large medical history is not required. This may enable rapid detection of paediatric ADRs and the framework may yield a low false positive rate. The main benefit of this method is that it does not have the risks associated with clinical trials.
In this paper we aim to investigate whether an ensemble of specifically chosen simple study designs can signal acute ADRs within the paediatric population with a low false positive rate. A comparison will be implemented to determine whether the ensemble offers an improvement over each individual simple study design. The ensemble requires generating multiple distinct measures of association between a drug and medical event based on the counterfactual method for causal inference. However, each measure of assocaition will be chosen such that a distinct type of main confounding effect will be introduce. The motivation of combining these measures of association via an ensemble is that it may be possible to exploit any causal mechanism structures. Using drug and medical event pairs definitively known to represent ADRs or non-ADRs, the various measures of association are calculated for each drug and medical event pair to generate the labelled data used to train a random forest classifier. The measures of association for any drug and medical event pair with an unknown ADR status can then be calculated and fed into the trained random forest to determine whether the pair corresponds to an ADR.
The objective of this paper is to investigate whether an ensemble of simple study designs can be implemented to signal acutely occurring side effects effectively within the paediatric population by using historical longitudinal data. The major-ity of pharmacovigilance techniques are unsupervised, but this research presents a supervised framework.
2 Material
are known. Each medical record specifies the patient that the record corresponds to, the record date and the medical event experienced by the patient. The medical events have a tree structure, with the medical event becoming more specific as its node depth (i.e., the length of the path from the root to the node) increases. Therefore, medical event nodes with a depth of 1 are the most general and medical event nodes with a depth of 5 are the most specific.
Each prescription within the THIN database contains details about the spe-cific drug prescribed and contains a code corresponding to the drug known as the British National Formulary (BNF) code [11]. The BNF code has a hierarchal struc-ture that can be used to identify similar drugs. For example, BNF codes starting with 05 (e.g., 05-xx-xx-xx) correspond to drugs used to treat infections, and BNF codes starting with 05-01-01 (e.g., 05-01-01-xx) correspond to penicillins. A drug family is the set of drugs with the same BNF code. For example, the drug family benzlypenicillin sodium and phenoxymethlypenicillin have a corresponding BNF code of 05-01-01-01 the drug family penicillinase-resistant penicillins have a BNF code of 05-01-01-02 and the drug family broad-spectrum penicillins have a BNF code of 05-01-01-03. These are the three drug families used to evaluate the novel framework presented in this paper. The number of records for each of the drug families in the THIN database is presented in Table 1. These drug families were chosen as they are frequently prescribed so their ADRs are generally well known and the creation of a reference set of definitive ADRs and non-ADRs was possible.
3 Methodology
3.1 Ensemble of Simple Studies Design Framework Overview
The proposed Ensemble of Simple Studies Design (ESSD) framework for signalling the acute ADRs that occur within the paediatric population is:
1. Generate simple studies labelled data
– Choosen drug families of interest, where each drug family is denoted by Dk, k∈[1, n].
– Determine the risk medical events (RM EDk), these are all the medical
events that are potential acutely occurring ADRs to the drugs inDk.
– For each drug family Dk and medical event ∈ RM EDk pair, determine
whether the medical event is a known ADR or non-ADR of the drug family Dkand add labels. The label for the ithpair is denoted byyi. For example, if the ith pair corresponds to an ADR then yi = 1 but if the ith pair corresponds to a non-ADR thenyi = 0.
– Generate the features for each pair (Dk+event∈RM EDk) by applying the
simple study designs to calculate multiple estimated causal effect values (the measure of association). The feature vector for the ithpair is denoted byxi.
2. Train a random forest model using the labelled data ({(xi, yi)})
– Apply 20-fold cross validation to tune the random forest classifier.
3. Apply the trained random forest classifier to the simple study design features of any unlabelled drug family and medical event pair (not known to correspond to an ADR or non-ADR) and classify the pair as an ADR or non-ADR.
3.1.1 Risk Medical Events
For each drug family Dk, the medical events investigated are determined using temporal information. As we are interested in acutely occurring ADRs, we restrict our attention to only investigate medical events that are observed within the month after a prescription of any drug withinDkis first prescribed. A month was chosen to be a suitable trade off to enable a sufficient amount of time for the patient to report the medical event while not introducing a surplus quantity of noise. Therefore, given a drug family Dk, the risk medical events of Dk (RM EDk) are
defined as the set of all medical events that are observed for a minimum of three patients within the month after any prescription of a drug within Dk. We chose to add a limit of three or more patients experiencing the potential ADR as it is difficult to determine whether a medical event is an ADR if it is experienced by less than three patients.
3.1.2 Generating Features
For each drug family (Dk) and medical event ∈ RM EDk pair, we extract six
different estimates of the causal effect ofDk on the medical event. These are the six simple study designs. The target population is the patients prescribedDkand the etiological time period (the period we investigate) is the month after the first prescription. The estimates of the causal effect are calculated by either using a different target population (Target Substitution) or using a different etiological time period in (Etiological Substitution).
x1: Etiological Substitution (SSD1)- The causal effect is approximated by com-paring the risk of the medical event during the month after the prescription for the target population with the risk during the month before the prescrip-tion for the target populaprescrip-tion. The main confounding effect is caused by a covariate of ‘medical state’ as the target population medical states are likely to change between the month before and the month after the prescription. This causal effect estimate is likely to be large for progressive medical events (e.g., progressions of the cause of taking the drug) even though they are not caused by the prescription.
x2: Etiological Substitution (SSD2)- The causal effect is approximated by com-paring the risk of the medical event during the month after the prescription for the target population with the risk during the year after for the target population. The main confounding effect is a covariate of ‘medical sate’, but unlikex1the causal effect estimate is likely to be small for progressive medical events that become more common as the population ages and large for medical events that occurred acutely after the drug.
main confounding effect is caused by a covariate of ‘indication’ as the target population all have certain illnesses causing them to require the drug but the substitute population does not. This causal effect estimate is likely to be large for medical events linked to the indication (i.e., the cause of taking the drug). x4: Target Substitution (SSD4)- The causal effect is approximated by comparing the risk of the medical event during the month after the prescription for the target population with the risk during the month after for a substitute popula-tion that are given a similar drug (i.e., a similar BNF code) and have the same indications. The main confounding effects are caused by a covariate of ‘medical caution’ as patients may be prescribed different drugs for the same indication due to medical cautions (i.e., one patient has kidney issues preventing them from having the standard medication) or covariates of ‘age and gender’ as age and gender may influence the choice of drug prescribed.
x5: Etiological Substitution (SSD5)- First, a mapping is performed to ‘generalise’ the medical event descriptions. This is done by mapping medical event nodes that have a depth greater than 3 to their depth 3 ‘parent node’. The causal effect is then approximated using the mapped data by comparing the risk of the corresponding depth 3 ‘parent node’ medical event during the month after the prescription for the target population with the risk during the month before for the target population. This causal effect measure is less vulnerable to covariates of ‘medical event recording’, where different medical events that correspond to the same/similar illness can be recorded due to redundancy or illness progression.
x6: Etiological Substitution (SSD6)- First, a mapping is performed to ‘generalise’ the medical event descriptions. This is done by mapping medical event nodes that have a depth greater than 4 to their depth 4 ‘parent node’. The causal effect is then approximated by comparing the risk of the corresponding depth 4 ‘parent node’ medical event during the month after the prescription for the tar-get population with the risk during the month before for the tartar-get population. This causal effect measure is less vulnerable to a covariate of ‘medical event recording’, where different medical events that correspond to the same/similar illness can be recorded due to redundancy or illness progression.
The vectorxi = (x1i, x2i, ..., x6i) contains the six estimates of the causal effect for the i th drug family and medical event pair. We also create three additional features from the original,
x7i =
x1i/x2i if|x2i|>0 x1i else
x8i =
x1i/x4i if|x4i|>0 x1i else
x9i =
x1i/x5i if|x5i|>0 x1i else
3.1.3 Random Forest Classifier
A random forest is a supervised classifier. The task of supervised learning is to use the training data to learn a mapping between the feature vector and the class. This mapping can then be used to predict the class for unseen data. The random forest is known as a ensemble classifier as it trains and combines weak and diverse classifiers. Each weak classifier is a decision tree that uses a subset of the available features (the simple design study measures of association) to predict the class (ADR or non-ADR). The advantages of the random forest classifier is that it can have features that are both discrete and continuous and does not require the features to be pre-processed (e.g., centred and scaled). The parameter of the random forest that needs to be chosen is the number of features that each decision tree can use, this is referred to as mtry. In this research we used the R implementation of the random forest [12].
The random forest is trained using the labelled drug family and medical event pair data,XL ={(xi, yi)|the label is known }. We applied 20-fold cross valida-tion, this means that the data are partitioned into 20 sets and for each set the random forest is trained on the other nineteen sets and then apply to predict the class of each data-point within the set. The trained random forest is then evalu-ated by a user defined criteria, in our case the area under of receiver operating characteristic curve (AUC), and the average value corresponding to this measure over the twenty sets determines how well the random forest has performed. This performance measure is used to select the parameter mtry, as various random forests are train with difference values of mtry and the mtry that results in the highest AUC is selected. When we refer to the trained random forest we mean the random forest that has been trained using themtry value that was optimal.
3.2 Evaluation
To evaluate the ESSD framework, we created a reference set of drug families and medical events pairs that are known to be ADRs or non-ADRs. The drug families used to create the reference set are the penicillins with the BNF codes 05-01-01-01, 05-01-01-02 and 05-01-01-03. The reference is used to train the random forest and evaluate it. The reference set data corresponding to two of the drug family is used as labelled data to train the random forest and the reference set data corresponding to the remaining drug family is used for evaluation.
3.2.1 Creating the Reference Set
The reference set was created by investigating all theRM EDkfor eachDk. Medical
incorrect out of all the labels as it is difficult to show that a medical event is not an ADR, as even events that cause the drug to be taken could also be ADRs.
3.2.2 Evaluation Measures
The ESSD framework is evaluated by considering its ability to signal ADRs at its natural threshold and its ability to rank drug family and medical event pairs by how likely they correspond to ADRs. The ESSD is compared with each individual simple study design (SSDi).
The natural threshold evaluation measures are the number of true positives (TP), this is the number of pairs corresponding to ADRs that the method classes as ADRs and the number of false positives (FP) is the number of pairs corresponding to non-ADRs that the method classes as ADRs. Similarly, the number of false negatives (FN) is the number of pairs that correspond to ADRs but the method classes as non-ADRs and the number of true negatives (TN) is rhe number of pairs that correspond to non-ADRs and the method classes as non-ADRs. The natural threshold measures can be calculated as:
Sensitivity =T P/(T P+F N) Specificity =T N/(F P+T N) False positive rate (FPR) =F P/(F P+T N)
(1)
The general ranking ability of the methods are measured by the average pre-cision (AP) and the AUC. The AUC is the area under the curve of the sensitivity plotted against 1 minus the specificity for various thresholds. The AUC can be interpreted as the probability of a uniformly chosen ADR pair being ranked above a uniformly chosen non-ADR pair. If a method performs poorly at its natural threshold but has a high AUC, then this may mean the natural threshold needs to be modified.
4 Results
The ESSD framework was evaluated three times. Each time the reference set data for two of the drug familities were used to train the random forest and the reference set data for the third drug family was used for evaluation. A table containing the full reference set data and the confidences returned by the ESSD framework can be found in the electronic supplementary material. A summary of each of the three evaluations is presented in Table 2. The optimalmtryobtained when training the model is presented and also the result of the AUC for the cross-validation.
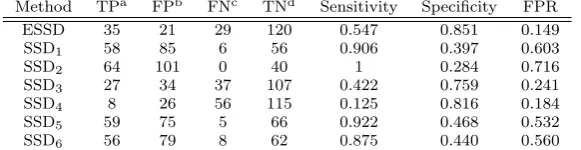
At their natural thresholds, the ESSD obtained a lower overall FPR of 0.149 compared to the other methods that obtained FPRs between 0.184−0.716. The ESSD had a sensitivity of 0.547. Although other methods obtained a higher sensi-tivity, they also had a very high false positive rate (≥0.532) which is not desirable. The results of methods at their natural thresholds for each individual evaluation are presented in Table 3 and the overall results with the sensitivity, specificity and false positive rate are displayed in Table 4.
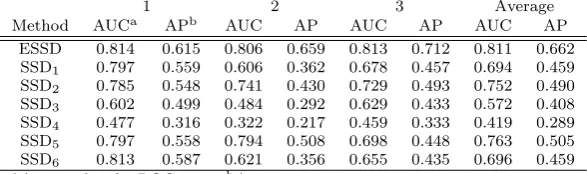
respectively. The highest AUC value out of all the other methods was 0.813, 0.794 and 0.729 for the evaluations 1 to 3 respectively. The AP value obtained by the ESSD was also greater for each evaluation, with the ESSD obtaining 0.615, 0.659 and 0.717 for evaluation 1 to 3 respectively, whereas the highest AP obtained by any other method over evaluation 1 to 3 was 0.587, 0.508 and 0.493 respectively. The results of the general ranking ability at presented in Table 5.
5 Discussion
The results show that the ESSD framework consistently outperformed the indi-vidual simple study design measures. It consistently obtained a higher AP and AUC for all three BNF families investigated. At its natural threshold the ESSD framework was able to signal just over half the true ADRs while only signalling approximately 15% of the non-ADRs. However, as it is difficult to prove a medical event is not an ADR, some of the non-ADR labels may be incorrect, so the proba-bility of signalling an non-ADRs may actually be lower (i.e., the FPR is probably less than the value obtain within this research). The ESSD framework is also ef-ficient, as the simple measures can be calculated readily and the classifier can be trained quickly. Once trained, the prediction is fast and could be implemented regularly when new data is added to the longitudinal database. As the ESSD has a low false positive rate and is efficient, it may be a useful framework to implement for signal generation. However, the signals that are generated will still need to be refined as it does not have a zero false positive rate.
There have been few attempts to apply supervised learning to the field of pharmacovigilance but this is an interesting area, as the results of supervised clas-sifier can be improved when more labelled data is available. Therefore, supervised methods should improve over time as as more ADR knowledge is gained. It may be possible to feedback the results of the supervised methodologies to further improve them via methods such as semi-supervised techniques. The ESSD also has the ad-vantage of being adaptable, as it could incorporate new measures of association that get proposed over time as features.
In this paper we have trained the ESSD using similar BNFs to the BNF used for the evaluation. The justification for this is that similar BNF drugs are likely to have similar underlying patterns. It would be interesting to see whether the random forest within the ESSD framework could be trained on a variety of different BNFs and still perform well. This would indicate whether the underlying structures are independent of the drug.
6 Conclusion
In this paper we have proposed a novel framework, called the ensemble of simple study designs (ESSD), specifically for signalling acute ADRs within the paediatric population. The framework does not require knowledge of a patient’s medical his-tory of more than a month prior to the prescription. The results show that the ESSD can outperform each individual simple study design measures and appears to be more consistent. The ensemble still misclassifies some non-ADRs but it ob-tained a false positive rate of 0.149, making it competitive with existing methods. The advantage of this methodology is that it is supervised, so as new ADRs are discovered its performance should increase as more labelled data will be available for training it.
Future work could involve researching new methods for refining the ADR sig-nals that are generated and reducing the false positive rate further or investigating different features based on alternative substitutions for the hypothetical counter-factual situation. For example, features that deal with alternative forms of con-founding such as the time of the year could be incorporated. It is also of interest to see whether adding more complex study design methods such as Temporal Pattern Discovery [14] or HUNT [10] can improve the ensemble and a comparison between these methods and the ESSD would be useful.
Acknowledgements This study was funded by the Department of Computer Sciences,
Uni-versity of Nottingham, UK. J.M. Reps, J.M. Garibaldi, U. Aickelin, D. Soria, J.E. Gibson and R.B. Hubbard have no conflicts of interest that are directly relevant to the content of this study.
References
1. Aagaard, L.: Knowledge creation about adverse drug reactions in the paediatric popula-tion. Ugeskrift for Laeger175(6), 342–345 (2013)
2. Aagaard, L., Christensen, A., Hansen, E.H.: Information about adverse drug reactions reported in children: a qualitative review of empirical studies. British Journal of Clinical Pharmacology70(4), 481–491 (2010)
3. Avery, A., Anderson, C., Bond, C., Fortnum, H., Gifford, A., Hannaford, P., Hazell, L., Krska, J., Lee, A., McLernon, D., et al.: Evaluation of patient reporting of adverse drug reactions to the UK ‘Yellow card scheme’: Literature review, descriptive and qualitative analyses, and questionnaire surveys. Health Technology Assessment15(20), 1–234 (2011) 4. Bate, A., Evans, S.: Quantitative signal detection using spontaneous ADR reporting.
Phar-macoepidemiology and Drug Safety18(6), 427–436 (2009)
5. Bwakura-Dangarembizi, M., Musesengwa, R., Nathoo, K.J., Takaidza, P., Mhute, T., Vhembo, T.: Ethical and legal constraints to childrens participation in research in Zim-babwe: experiences from the multicenter pediatric HIV ARROW trial. BioMed Central Medical Ethics13(1), 17 (2012)
6. Caldwell, P.H., Murphy, S.B., Butow, P.N., Craig, J.C.: Clinical trials in children. The Lancet364(9436), 803–811 (2004)
7. Conroy, S., Choonara, I., Impicciatore, P., Mohn, A., Arnell, H., Rane, A., Knoeppel, C., Seyberth, H., Pandolfini, C., Raffaelli, M.P., et al.: Survey of unlicensed and off label drug use in paediatric wards in European countries. British Medical Journal320(7227), 79–82 (2000)
8. Greenland, S., Neutra, R.: Control of confounding in the assessment of medical technology. International Journal of Epidemiology9(4), 361–367 (1980)
10. Jin, H., Chen, J., He, H., Kelman, C., McAullay, D., O’Keefe, C.M.: Signaling poten-tial adverse drug reactions from administrative health databases. IEEE Transactions on Knowledge and Data Engineering22(6), 839–853 (2010)
11. Joint Formulary Committee: British National Formulary. 66 ed. London: BMJ Group and Pharmaceutical Press (2013)
12. Liaw, A., Wiener, M.: Classification and regression by randomForest. R News2(3), 18–22 (2002). URL http://CRAN.R-project.org/doc/Rnews/
13. Lidz, C.W., Appelbaum, P.S., Grisso, T., Renaud, M.: Therapeutic misconception and the appreciation of risks in clinical trials. Social Science & Medicine58(9), 1689–1697 (2004) 14. Nor´en, G.N., Hopstadius, J., Bate, A., Star, K., Edwards, I.R.: Temporal pattern discovery in longitudinal electronic patient records. Data Mining and Knowledge Discovery20(3), 361–387 (2010)
15. Overhage, J.M., Ryan, P.B., Reich, C.G., Hartzema, A.G., Stang, P.E.: Validation of a common data model for active safety surveillance research. Journal of the American Medical Informatics Association19(1), 54–60 (2012)
16. Reps, J.M., Garibaldi, J.M., Aickelin, U., Soria, D., Gibson, J., Hubbard, R.: Comparison of algorithms that detect drug side effects using electronic healthcare databases. Soft Computing17(12), 2381–2397 (2013). DOI 10.1007/s00500-013-1097-4
17. Reps, J.M., Garibaldi, J.M., Aickelin, U., Soria, D., Gibson, J.E., Hubbard, R.B.: A novel prescription drug side effect classifier. Submitted to IEEE Transactions on Knowledge and Data Engineering
18. Rose, K., van den Anker, J.N.: Guide to Paediatric Drug Development and Clinical Re-search. KARGER (2010)
19. Ryan, P.B., Madigan, D., Stang, P.E., Marc Overhage, J., Racoosin, J.A., Hartzema, A.G.: Empirical assessment of methods for risk identification in healthcare data: results from the experiments of the Observational Medical Outcomes Partnership. Statistics in Medicine
31(30), 4401–4415 (2012)
20. Simpson, S.E.: Self-controlled methods for postmarketing drug safety surveillance in large-scale longitudinal data. Ph.D. thesis, Columbia University (2011)
21. Zorych, I., Madigan, D., Ryan, P., Bate, A.: Disproportionality methods for pharmacovig-ilance in longitudinal observational databases. Statistical Methods in Medical Research
Table 1 Details about the records within the subset of The Health Improvement Network (THIN) database for a selection of three penicillin drugs prescribed to patients aged 17 years or less.
Drug Family BNFa Number of Prescriptions
Total First in 3 months benzlypenicillin sodium and
phe-noxymethlypenicillin
05-01-01-01 1520866 456926
penicillinase-resistant penicillins 05-01-01-02 310622 252947 broad-spectrum penicillins 05-01-01-03 6490455 1448563
[image:13.595.70.434.218.268.2]aBritish national formulary code.
Table 2 The details of the evaluation experiments.
Evaluation Training/testing Set Optimalmtry Training AUCa Evaluation Set
1 05−01−01− {02,03} 4 0.885 05−01−01−01 2 05−01−01− {01,03} 6 0.827 05−01−01−02 3 05−01−01− {01,02} 9 0.875 05−01−01−03
aArea under the ROC curve obtained by the 20-fold cross validation.
Table 3 For each evaluation experiment ,the number of TP, FP, FN and TN returned for the ensemble of simple study designs (ESSD) and each individual simple study design (SSDi).
1 2 3
Method TPa FPb FNc TNd TP FP FN TN TP FP FN TN
ESSD 9 9 8 30 9 6 9 40 17 6 12 50
SSD1 17 21 0 18 15 31 3 15 26 33 3 23
SSD2 17 22 0 17 18 42 0 4 29 37 0 19
SSD3 5 4 12 35 5 13 13 33 17 17 12 39
SSD4 2 4 15 35 2 17 16 29 4 5 25 51
SSD5 17 19 0 20 17 26 1 20 25 30 4 26
SSD6 17 19 0 20 15 29 3 17 24 31 5 25
aTrue positivebFalse positivecFalse negativedTrue negative
Table 4 The average number of TP, FP, FN and TN returned for the ensemble of simple study designs (ESSD) and each individual simple study design (SSDi) and the overall specificity, sensitivity and false positive rate (FPR).
Method TPa FPb FNc TNd Sensitivity Specificity FPR
ESSD 35 21 29 120 0.547 0.851 0.149
SSD1 58 85 6 56 0.906 0.397 0.603
SSD2 64 101 0 40 1 0.284 0.716
SSD3 27 34 37 107 0.422 0.759 0.241
SSD4 8 26 56 115 0.125 0.816 0.184
SSD5 59 75 5 66 0.922 0.468 0.532
SSD6 56 79 8 62 0.875 0.440 0.560
[image:13.595.75.417.313.399.2] [image:13.595.101.392.456.531.2]Table 5 A comparison of the general ADR ranking ability of the ensemble of simple study designs (ESSD) and each individual simple study design (SSDi).
1 2 3 Average
Method AUCa APb AUC AP AUC AP AUC AP
ESSD 0.814 0.615 0.806 0.659 0.813 0.712 0.811 0.662 SSD1 0.797 0.559 0.606 0.362 0.678 0.457 0.694 0.459
SSD2 0.785 0.548 0.741 0.430 0.729 0.493 0.752 0.490
SSD3 0.602 0.499 0.484 0.292 0.629 0.433 0.572 0.408
SSD4 0.477 0.316 0.322 0.217 0.459 0.333 0.419 0.289
SSD5 0.797 0.558 0.794 0.508 0.698 0.448 0.763 0.505