uPAR isoform 2 forms a dimer and induces
severe kidney disease in mice
Changli Wei, … , M. Amin Arnaout, Jochen Reiser
J Clin Invest.
2019;
129(5)
:1946-1959.
https://doi.org/10.1172/JCI124793
.
Soluble urokinase plasminogen activator receptor (suPAR) is an immune-derived
circulating signaling molecule that has been implicated in chronic kidney disease, such as
focal segmental glomerulosclerosis (FSGS). Typically, native uPAR (isoform 1) translates to
a 3-domain protein capable of binding and activating integrins, yet the function of additional
isoforms generated by alternative splicing is unknown. Here, we characterized mouse
uPAR isoform 2 (msuPAR2), encoding domain I and nearly one-half of domain II, as a dimer
in solution, as revealed by 3D electron microscopy structural analysis. In vivo, msuPAR2
transgenic mice exhibited signs of severe renal disease characteristic of FSGS with
proteinuria, loss of kidney function, and glomerulosclerosis. Sequencing of the glomerular
RNAs from msuPAR2-Tg mice revealed a differentially expressed gene signature that
includes upregulation of the suPAR receptor
Itgb3
, encoding
b
3integrin. Crossing
msuPAR2-transgenic mice with 3 different integrin
b
3deficiency models rescued
msuPAR2-mediated kidney function. Further analyses indicated a central role for
b
3integrin
and c-Src in msuPAR2 signaling and in human FSGS kidney biopsies. Administration of
Src inhibitors reduced proteinuria in msuPAR2-transgenic mice. In conclusion, msuPAR2
may play an important role in certain forms of scarring kidney disease.
Research Article
Nephrology
Find the latest version:
Introduction
Urokinase receptor or urokinase plasminogen activator receptor (uPAR) is a glycosylphosphatidylinisotol-anchored (GPI–anchored) protein that acts as a receptor for prourokinase and facilitates the generation of activated plasmin. Removal of the GPI anchor from uPAR by phosphatidylinositol-specific phospholipase C generates soluble uPAR (suPAR) (1), which can be detected in different body fluids, such as blood and urine (2). A large body of evidence has shown that suPAR could serve both as an inflammatory biomarker and as a signaling molecule (2). A role for suPAR in kidney disease was first noted in patients with focal segmental glomerulosclero-sis (FSGS), in whom high levels were associated with recurrence of FSGS after transplantation (3). Elevated suPAR accounting for kidney injury is thought to originate from bone marrow myeloid
stem cells (4). We have suggested that suPAR promotes pathologic changes in kidney function mainly through activation of αvβ3 integ-rin on podocytes (3). This activation is enhanced in the presence of CD40 autoantibodies or apoL1 risk variants (5, 6). High suPAR lev-els have been associated with a long-term decline in renal function and incident chronic kidney disease (CKD) in a variety of patient cohorts (cardiovascular, healthy middle-aged, prediabetic, dialysis patients) (7–10), suggesting a role for suPAR as a biomarker and potential risk factor for kidney disease. The underlying reasons for the difference in clinical presentation in suPAR-associated FSGS and non-FSGS kidney disease are unclear and may be due to differ-ent isoforms of suPAR.
Notably, uPAR has multiple isoforms in humans and mice due to alternative splicing of the 7 encoding exons in both species (11, 12). The distinct biological roles of these isoforms, however, are not yet clear. As part of our initial study in defining the role of suPAR in kidney disease, we cloned mouse uPAR isoform 2 (msuPAR2) from cultured mouse podocytes and showed that its transduced expression caused rapid nephropathy in mice (3). In contrast, transgenic mouse models expressing the soluble form of msuPAR1 did not develop any renal phenotype over a 6-week period (13), but rather required several months to develop such a phenotype (4). Similarly, administration of recombinant msuPAR1 per se did not cause proteinuria in mice (14), suggesting that msuPAR1 and msuPAR2 might have diverse roles with regard to kidney pathogenesis. In this study, we purified msuPAR2 protein Soluble urokinase plasminogen activator receptor (suPAR) is an immune-derived circulating signaling molecule that has been
implicated in chronic kidney disease, such as focal segmental glomerulosclerosis (FSGS). Typically, native uPAR (isoform 1) translates to a 3-domain protein capable of binding and activating integrins, yet the function of additional isoforms generated by alternative splicing is unknown. Here, we characterized mouse uPAR isoform 2 (msuPAR2), encoding domain I and nearly one-half of domain II, as a dimer in solution, as revealed by 3D electron microscopy structural analysis. In vivo, msuPAR2 transgenic mice exhibited signs of severe renal disease characteristic of FSGS with proteinuria, loss of kidney function, and glomerulosclerosis. Sequencing of the glomerular RNAs from msuPAR2-Tg mice revealed a differentially expressed gene signature that includes upregulation of the suPAR receptor Itgb3, encoding β3 integrin. Crossing msuPAR2-transgenic mice with 3 different integrin β3 deficiency models rescued msuPAR2-mediated kidney function. Further analyses indicated a central role for β3 integrin and c-Src in msuPAR2 signaling and in human FSGS kidney biopsies. Administration of Src inhibitors reduced proteinuria in msuPAR2-transgenic mice. In conclusion, msuPAR2 may play an important role in certain forms of scarring kidney disease.
uPAR isoform 2 forms a dimer and induces severe
kidney disease in mice
Changli Wei,1 Jing Li,1 Brian D. Adair,2 Ke Zhu,1 Jian Cai,3 Michael Merchant,3 Beata Samelko,1 Zhongji Liao,4 Kwi Hye Koh,1
Nicholas J. Tardi,1 Ranadheer R. Dande,1 Shuangxin Liu,1 Jianchao Ma,1 Salvatore Dibartolo,1 Stefan Hägele,1 Vasil Peev,1
Salim S. Hayek,5 David J. Cimbaluk,6 Melissa Tracy,1 Jon Klein,3 Sanja Sever,2 Sanford J. Shattil,4 M. Amin Arnaout,2
and Jochen Reiser1
1Department of Medicine, Rush University Medical Center, Chicago, Illinois, USA. 2Harvard Medical School, Division of Nephrology, Massachusetts General Hospital, Charlestown, Massachusetts, USA.
3University of Louisville, Louisville, Kentucky, USA. 4Department of Medicine, UCSD, La Jolla, California, USA. 5University of Michigan Frankel Cardiovascular Center, Ann Arbor, Michigan, USA.
6Department of Pathology, Rush University Medical Center, Chicago, Illinois, USA.
Related Commentary: p. 1827
Conflict of interest: JR and SS are inventors on pending and issued patents related to antiproteinuric therapies. They stand to gain royalties from present and future commercialization. They also are cofounders and advisors to TRISAQ, a biotechnology company. CW has a pending patent on suPAR in diabetes. He stands to gain royalties from future commercialization products concerning this application (see Supplemen-tal Data for complete information).
Copyright: © 2019, American Society for Clinical Investigation.
Submitted: September 10, 2018; Accepted: February 5, 2019; Published: April 2, 2019. Reference information: J Clin Invest. 2019;129(5):1946–1959.
lel, we examined msuPAR1 transgenic mice that were generated exactly the same way for comparison. We have shown using an ELISA assay that msuPAR1-Tg mice had a high level of msuPAR1 in both serum and urine samples (4). Since there is no ELISA kit available for a specific msuPAR2 measurement, we first exam-ined adipose tissues for msuPAR2 expression driven by an AP2 promoter. Compared with littermate controls, msuPAR2 mRNA expression increased by 11-fold in msuPAR2-Tg mice (Figure 2B). The msuPAR2 expression in adipocytes at the protein level was confirmed by immunohistochemical staining with an anti–c-Myc antibody (Figure 2C). Next, we developed a peptide-based rabbit polyclonal antibody specific to msuPAR2 (Supplemental Figure 4, A and B). Using this antibody, we performed Western blot analy-sis with albumin-depleted serum samples. We detected msuPAR2 in the sera of msuPAR2-Tg mice, but not in uPAR-KO (Plaur–/–) or msuPAR1-Tg mice (Figure 2D). The specificity of msuPAR2 detec-tion was indicated by msuPAR2 peptide blocking (Supplemental Figure 4C). In addition, a msuPAR2 fragment of 10 to 15 kDa, but not intact msuPAR2, was detected in the urine of msuPAR2-Tg mice (Figure 2E). As expected, this msuPAR2 fragment was absent from the urine of msuPAR1-Tg and uPAR-KO mice (Figure 2E). Moreover, this msuPAR2 fragment was only recognized by the above-described rabbit anti-suPAR2 antibody, but not the anti– c-Myc antibody. Note that both msuPAR1 and msuPAR2 have C-terminal c-Myc tag in their transgenes, and the anti–c-Myc anti-body detected msuPAR1 in the urine of msuPAR1-Tg mice (Sup-plemental Figure 5). Next, we isolated the msuPAR2 fragment from msuPAR2-Tg mouse urine and performed liquid chroma-tography–MS (LC-MS) analysis, which confirmed its identity by detecting N-terminal, but not C-terminal, peptides (Figure 2F).
msuPAR2-Tg mice develop CKD characteristic of FSGS.
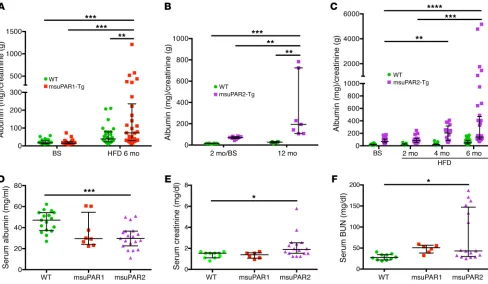
Circulat-ing suPAR levels have been shown to predict CKD progression in humans (7). In msuPAR1-Tg mice, there was no proteinuria at base-line, but one-third of animals developed proteinuria after 2 months of high-fat diet (HFD) treatment to stimulate msuPAR1 produc-tion via the AP2 promoter (4). Addiproduc-tional analyses revealed that proteinuria in msuPAR1-Tg mice peaked after 6 months of HFD treatment (Figure 3A). In contrast, msuPAR2-Tg mice maintained on regular chow developed spontaneous proteinuria starting at 2 months of age (baseline) without HFD treatment, which increased significantly to a severe level by 12 months (Figure 3B). Of note, proteinuria was not observed in WT littermate control mice. Next, we treated msuPAR2-Tg mice with HFD, as with msuPAR1-Tg, to stimulate the AP2 promoter and thus suPAR production starting from 2 months of age. With HFD treatment, msuPAR2-Tg, but not littermate control, mice developed accelerated and progressive proteinuria up to 8 months of age (Figure 3C), at which time death occurred spontaneously in some msuPAR2-Tg mice and thus the experimental endpoint was reached. Considering the average of all examined mice, msuPAR2-Tg mice had significantly more proteinuria after 6 months of HFD treatment (albumin/creatinine ratio [ACR], 596.6 ± 191.5 mg/g), when compared with msuPAR1-Tg mice (ACR, 165.6 ± 43.7 mg/g, P < 0.05). As decreased serum albumin levels are a key feature of nephrotic syndrome in humans, we measured serum albumin in both msuPAR1-Tg and msuPAR2-Tg mice after 6 months of HFD. We found that msuPAR2-msuPAR2-Tg mice had significantly lower serum albumin levels when compared with from HEK cells and characterized its structure as a dimer. In vivo,
utilizing different transgenic mouse models, we found msuPAR2, but not msuPAR1, induces a severe kidney disease characteristic of FSGS via the integrin αvβ3-Src signaling axis.
Results
msuPAR2 forms a dimer in solution. msuPAR1 and msuPAR2 share
100% homology for uPAR domain I (D1) and the N-terminal por-tion of D2, while msuPAR2 lacks the C-terminal end of D2 and the entire D3 domain, and thus the GPI anchor (Supplemental Figure 1; supplemental material available online with this arti-cle; https://doi.org/10.1172/JCI124793DS1). To characterize the corresponding proteins, we cloned and expressed msuPAR1 (without the GPI anchor) and msuPAR2 in HEK293 cells. Both msuPAR1 and msuPAR2 proteins are glycosylated (Figure 1A). Under reducing conditions, msuPAR1 migrated as a single band between 50 and 60 kDa before and approximately 35 kDa after treatment with PNGase F, while msuPAR2 migrated at 32 to 33 kDa before and approximately 25 kDa after deglycosylation (Fig-ure 1A, Supplemental Fig(Fig-ure 2A). msuPAR1 and msuPAR2 were verified by mass spectrometry (MS) analysis after deglycosylation (Figure 1B). Under nonreducing conditions, msuPAR1 migrated as multiple bands consistent with a monomer, a dimer, and higher- order multimers. In contrast, msuPAR2 remained as a mono-mer (Supplemental Figure 2B). Under native conditions, while msuPAR1 migrated as multiple bands, msuPAR2 presented as 1 band at approximately 66 kDa, suggesting formation of homodi-mers (Supplemental Figure 2C). As the structure of msuPAR1 was already determined by x-ray crystallography (15), we examined msuPAR2 by electron microscopy (EM). Reference-free class aver-ages of msuPAR2 particles displayed clear multidomain features (Supplemental Figure 3), with 3 to 4 distinct domains with diam-eters of approximately 70–100 Å. The expressed construct pos-sessed a full D1 domain and a small, disulfide-linked region from D2 (Figure 1C). These known folding domains would not have a diameter greater than 50 Å, indicating that the particles visu-alized in the micrographs are too large to be monomers. Single- particle reconstructions with an imposed 2-fold symmetry pro-vided a good fit for the reference-free particle data and con-verged with a final resolution of 17 Å (Supplemental Figure 3). The resulting map indicates an isosurface set to enclose density for the expected volume of the 25 kDa msuPAR2 core protein. At this isosurface, 2 symmetry-related domains provide a good fit for the intact D1 domain (Figure 1C). These domains do not interact with one another, but are connected by a third domain containing the dimer interface and are of a suitable size to contain the N-ter-minal portion of D2 in the construct, but the resolution does not permit precise fitting of this domain into the map. Taken togeth-er, our data imply that, in contrast to msuPAR1, msuPAR2 forms a dimer with distinct structural characteristics.
msuPAR2 is detected in adipocytes, blood, and urine. Since
paral-dl for littermate controls, P < 0.05), but not in msuPAR1-Tg (48.20 ± 4.15 mg/dl for msuPAR1-Tg versus controls, P = 0.61), after 6 months of HFD treatment (Figure 3F). Thus, kidney function is sig-nificantly impaired in msuPAR2-Tg mice after 6 months of HFD, when elevation of msuPAR2 is shown in the blood circulation.
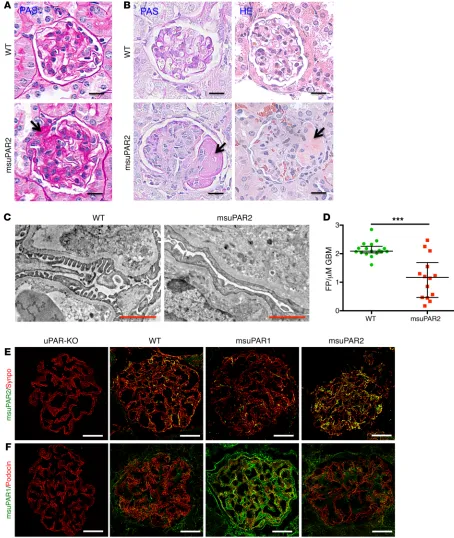
To explore kidney histopathology, we performed periodic acid–Schiff (PAS) and H&E staining. Without HFD treatment, msuPAR2-Tg mice were sacrificed at 12 months of age, when a high amount of proteinuria was detected. While WT control mice presented normal kidney morphology, msuPAR2-Tg mice main-tained on regular chow showed FSGS-like glomerular features (Figure 4A and Supplemental Figure 6A). After 6 months of HFD treatment, 22% ± 3 % of msuPAR2-Tg mice developed kidney littermate controls (30.63 ± 2.50 g/l for msuPAR2-Tg versus 45.84
± 2.38 g/l for controls, P < 0.0001) (Figure 3D). In contrast, serum albumin levels did not decrease significantly in msuPAR1-Tg mice (36.23 ± 5.55 g/l for msuPAR1-Tg versus controls, P = 0.10).
[image:4.585.54.536.47.481.2]As the next step, we examined serum markers of kidney func-tion of msuPAR1-Tg and msuPAR2-Tg mice. As shown in Figure 3E, serum creatinine was significantly increased in msuPAR2-Tg mice after 6 months of HFD (2.20 ± 0.29 mg/dl for msuPAR2-Tg versus 1.38 ± 0.09 mg/dl for controls, P < 0.05). In contrast, serum creat-inine did not change in msuPAR1-Tg mice (1.34 ± 0.18 mg/dl for msuPAR1-Tg versus controls, P = 0.99). Similarly, serum blood urea nitrogen (BUN) levels were significantly increased in msuPAR2-Tg mice (79.06 ± 15.35 mg/dl for msuPAR2-Tg versus 28.74 ± 2.28 mg/
Figure 1. Characterization of msuPAR recombinant proteins. (A) SDS gel analysis of purified msuPAR1 and msuPAR2 before (S2 and S1) and after (S2/P
suggest that msuPAR2 overexpression but not HFD was associated with FSGS-like kidney disease. Transmission EM (TEM) analysis of msuPAR2-Tg mice revealed that podocyte foot process efface-ment increased significantly compared with that in littermate con-trols (Figure 4, C and D). Along with progressive proteinuria and impaired kidney function, these results indicate that msuPAR2-Tg mice developed FSGS-type changes.
[image:5.585.51.546.49.489.2]pathology that mimicked human FSGS: some, but not all, glom-eruli were sclerotic; some segments, but not the whole glomer-ulus, were equally affected (Figure 4B and Supplemental Figure 6B). In contrast, msuPAR1-Tg mice showed only mild glomerular hypertrophy, hypercellularity, and hyalinosis, but no FSGS-like changes (Supplemental Figure 6C). As both WT control mice and msuPAR1-Tg mice also received HFD for 6 months, these data
Figure 2. Detection of msuPAR2 in adipocytes, serum, and urine. (A) Schematic of msuPAR2-Tg construction and msuPAR2-Tg mouse treatment. (B)
qPCR analysis of muPAR2 in fat tissues. The value was calculated as a ratio of muPAR2 differential expression between littermate controls (WT) and msuPAR2-Tg mice over that of housekeeping gene GAPDH. muPAR2 mRNA was increased significantly compared with littermate controls. Mann-Whitney
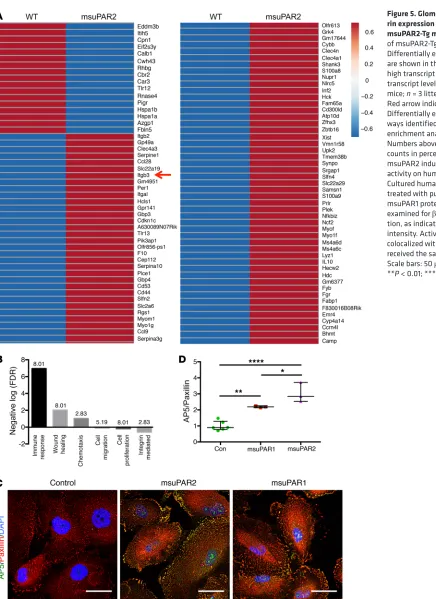
msuPAR2-Tg mice and littermate controls. We found 81 mRNAs including Itgb3 (encoding β3 integrin) were significantly upregulat-ed, while 17 mRNAs were downregulated in suPAR2-Tg glomeruli (Figure 5A). When gene enrichment analysis was used to identify key pathways driving these transcriptional changes, the top dif-ferentially expressed pathways in suPAR2-Tg glomeruli included immune response, wound healing, chemotaxis, cell migration, cell proliferation, and integrin-mediated pathways (Figure 5B).
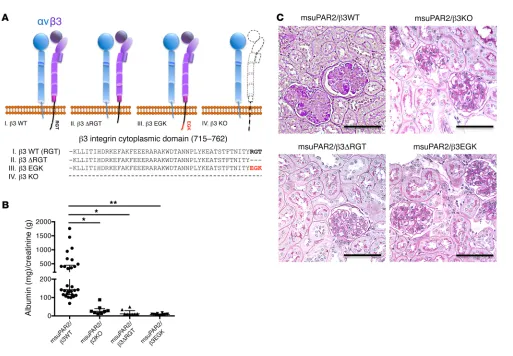
As β3 integrin has been implicated in our previous studies as a suPAR downstream effector, we chose to corroborate its role in msuPAR2-Tg mice. We first showed that msuPAR2 is a stron-ger activator of β3 integrin than msuPAR1 in human podocytes (Figure 5, C and D). Next, we crossed msuPAR2-Tg mice with integrin β3 KO (Itgb3–/–) mice as well as with 2 integrin knockin mouse models, β3ΔRGT and β3EGK, respectively (18, 19). As indicated in Figure 6A, β3ΔRGT knockin mice lack the 3 C-ter-minal β3 tail residues (RGT), resulting in defective β3 interaction with c-Src and Kindlin-3 (19). Conversely, in β3EGK mice, the replacement of the RGT residues of β3 with the corresponding residues of β1(EGK) restores the interaction of β3 with kindlins, but not with c-Src (19). As with msuPAR2-Tg mice, msuPAR2-Tg/ Since we observed glomerular pathology in msuPAR2-Tg mice,
we determined whether msuPAR2 could be localized in the glom-eruli using immunofluorescence labeling. While only minimal levels could be detected in the glomeruli of littermate WT control mice, msuPAR2 expression was readily observed in the glomeruli of msuPAR2-Tg mice. Of note, msuPAR2 staining did not overlap either with α–smooth muscle actin (SMA), a marker for mesangial cells (16), or with VE-cadherin (Supplemental Figure 7), an endo-thelial cell marker (17), but did overlap with the podocyte marker synaptopodin, indicating that msuPAR2 was localized largely to podocytes (Figure 4E). In parallel, we examined the expression of msuPAR1 in the glomeruli of msuPAR1-Tg and msuPAR2-Tg mice. Compared with littermate WT control, there was an increase of msuPAR1 in the glomeruli of msuPAR1-Tg mice, partially local-ized in podocytes. In contrast, no obvious change of msuPAR1 was appreciated in the glomeruli of msuPAR2-Tg mice (Figure 4F). Together, these data suggest that circulating msuPAR can be deposited into podocytes.
msuPAR2-induced renal pathogenesis requires β3 integrin. To
[image:6.585.44.532.56.340.2]explore the molecular mechanisms underlying msuPAR2 induced kidney disease, we performed RNA-Seq on isolated glomeruli from
Figure 3. msuPAR2-Tg mice develop progressive proteinuria and severe kidney dysfunction. (A) Proteinuria profiling in msuPAR1-Tg mice. Proteinuria, in
terms of ACR, which was absent before HFD treatment at baseline, developed in msuPAR1-Tg mice after 6 months of HFD. n = 25 WT/baseline (BS); n = 26 msuPAR1-Tg/BS; n = 27 WT/HFD6mo; n = 30 msuPAR1-Tg/HFD6mo. Two-way ANOVA; data were log-transformed to normal distribution. (B) Spontaneous proteinuria in msuPAR2-Tg mice. Without HFD treatment, proteinuria was evident in msuPAR2-Tg mice at 2 months of age and increased significantly by 12 months of age. n = 9 at 2 mo (2 month) /BS; n = 7 at 12 mo. Two-way ANOVA. (C) With HFD treatment, msuPAR2-Tg mice developed accelerated and progres-sive proteinuria over a period of 6 months. n = 30 WT/BS; n = 26 msuPAR2-Tg/BS; n = 9 WT/HFD2mo; n = 16 msuPAR2-Tg/HFD2mo; n = 13 WT/HFD4mo; n = 16 msuPAR2-Tg/HFD4mo; n = 31 WT/HFD6mo; n = 36 msuPAR-Tg/HFD6mo. Baseline was at 2 months old, before HFD treatment. Two-way ANOVA. Data were log-transformed to normal distribution. (D) Serum albumin decreased significantly in HFD-treated msuPAR2-Tg mice compared with WT (littermate control) mice. n = 17 WT; n = 8 msuPAR1-Tg; n = 19 msuPAR2-Tg mice. One-way ANOVA. (E) Serum creatinine increased significantly in HFD-treated msuPAR2-Tg mice.
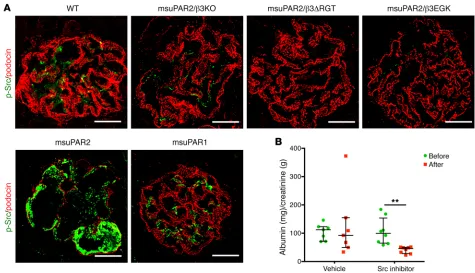
β3-KO, msuPAR2-Tg/β3ΔRGT, and msuPAR2-Tg/β3EGK mice were then treated with HFD starting at 2 months of age. While msuPAR2-Tg mice developed proteinuria, all 3 double-transgenic mice with impaired β3 integrin expression or function were pro-tected from msuPAR2-induced proteinuria (Figure 6B). Finally, kidney histological analysis by PAS staining revealed normal
[image:8.585.41.477.47.646.2]kid-neys absent changes characteristic of FSGS in either msuPAR2-Tg/β3 KO, or msuPAR2-Tg/β3ΔRGT or in msuPAR2-Tg/β3EGK mice (Figure 6C). These data suggest that msuPAR2 signals through intact integrin β3 and, by implication, that an intact αvβ3 integrin heterodimer is required via c-Src–dependent signaling for msuPAR2-induced kidney injury.
Figure 5. Glomerular β3
integ-rin expression is increased in
msuPAR2-Tg mice. (A) RNA-Seq
of msuPAR2-Tg mouse glomeruli. Differentially expressed genes are shown in the heatmap. Red, high transcript levels; blue, low transcript levels. n = 7 suPAR2-Tg mice; n = 3 littermate controls. Red arrow indicates Itgb3. (B) Differentially expressed path-ways identified by gene-set enrichment analysis via DAVID. Numbers above the bars represent counts in percentage. (C and D) msuPAR2 induces β3 integrin
activity on human podocytes. Cultured human podocytes were treated with purified msuPAR2 or msuPAR1 protein at 1 ng/ml and examined for β3 integrin
activa-tion, as indicated by AP5 staining intensity. Activated β3 integrin
teinuria in msuPAR2-Tg mice (Figure 7B). Collectively, our data suggest that msuPAR2-induced kidney injuries are mediated by glo-merular Src activity, employing the αvβ3 integrin signaling pathway.
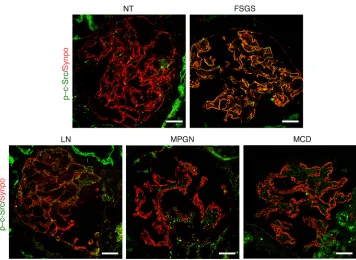
To investigate the implication of c-Src activity in human glo-merular kidney disease, we performed immunofluorescent stain-ing for phosphorylated c-Src (p–c-Src) on kidney biopsies from primary FSGS, lupus nephritis [LN], membranoproliferative glo-merulonephritis [MPGN], and minimal change disease [MCD]). While minimal p–c-Src expression was observed in normal glom-eruli, signal intensity was increased in the glomeruli of 6 out of 10 examined FSGS patients, but not in any glomeruli from LN, MPGN, or MCD patients (Figure 8). Overlapping with the podo-cyte marker synaptopodin indicates that the increase of c-Src activity is largely localized in podocytes. Of note, in these FSGS patients with elevated expression of glomerular p–c-Src, 46%, but not all, observed glomeruli were stained positive with variable intensity. In summary, increased glomerular c-Src phosphory-lation is observed in human FSGS kidney as well as in msuPAR2 transgenic mice; blocking c-Src could decrease proteinuria, impli-cating c-Src activation in FSGS.
Blocking Src activity reduces proteinuria. To further examine
the role of c-Src kinase in msuPAR2-Tg mice, we examined the glomerular c-Src phosphorylation by immunofluorescence. Com-pared with littermate controls, Src phosphorylation was increased in glomeruli of msuPAR2-Tg mice (Figure 7A). Interestingly, the enhancement of c-Src activity was abolished not only in msuPAR2-Tg/β3 KO, but also in msuPAR2-Tg/β3ΔRGT and in msuPAR2-Tg/ β3EGK mice. Additionally, the phosphorylation of c-Src was not observed in the glomeruli of msuPAR1-Tg mice (Figure 7A). Tak-en together, these results indicate that msuPAR2 but not msuPAR1 activate glomerular Src kinase via β3 integrin in the development of kidney disease.
Next, we tested pharmacologic modulation of Src kinase and its effects on proteinuria in msuPAR2-Tg mice. Src inhibitor 1 is a potent, selective, dual-site Src tyrosine kinase inhibitor, and it has been used together with PP1 to inhibit Src kinase (20). Thus, we administered both Src inhibitors into msuPAR2-Tg mice via i.p. injection and monitored proteinuria before and after Src inhibitor treatment. While vehicle-only administration did not change teinuria levels, Src inhibitor treatment significantly reduced
pro-Figure 6. msuPAR2-induced kidney disease requires the presence of intact β3 integrin. (A) Schematic delineations of the cytoplasmic domain of 3
genet-ically engineered β3 integrin mouse models. Dashed line represents absence. In terms of β3 integrin KO, αv integrin was able to dimerize with β5 or another
[image:9.585.45.558.45.401.2]tein sequence, msuPAR2 was assumed to be soluble but unstable due to its number of cysteine residues (21). We originally cloned muPAR2 mRNA from cultured mouse podocytes, performed a HEK cell–based coimmunoprecipitation assay with integrin β3, delivered the muPAR2 transcript into C57BL/6 mice via electro-poration, and observed a renal phenotype in these mice (3). In this study, we purified msuPAR2 protein from HEK cells and charac-terized it as a stable protein, forming a dimer comprising D1 and part of D2. The single long strand of the β-sheet in the D2 region might pair with the strand from its dimer partner. Note that the splice junction in msuPAR2 transcript disrupts a disulfide bond between residues 116 and 145, leaving a free cysteine in D2.
Continuing our investigations into animal models, we showed that msuPAR2-Tg mice on regular chow develop spontaneous pro-teinuric injury from the age of 2 months and that by 12 months, glomerular changes that suggest FSGS could be appreciated. With HFD treatment to stimulate the AP2 promoter, kidney damage was accelerated as msuPAR2-Tg mice developed hypoalbumin-emia and glomerular sclerosis along with reduced renal functions by 8 months of age (i.e., 6 months after HFD initiation). These data suggest that msuPAR2-Tg mice develop a pathology that resem-bles human FSGS. In contrast, mice expressing msuPAR1 exhib-ited kidney glomerular changes with less penetrance with HFD treatment (4). Of note, our msuPAR1-Tg mouse model is different from another msuPAR1 transgenic model reported by Spinale et Finally, we investigated whether there are alternative human
uPAR isoforms expressed in human cells. Quantitative PCR (qPCR) with primer pairs specific for each isoform in peripheral blood mononuclear cells (PBMCs) harvested from healthy human subjects identified mRNA expression of human uPAR isoforms 1 to 4 (H1 to H4) (Supplemental Figure 8), indicating that alterna-tive human uPAR isoforms are indeed expressed in humans.
Discussion
Nearly 3 decades ago, 2 alternatively spliced mouse uPAR mRNAs were identified in the gastrointestinal tract, with muPAR1 local-ized in the luminal epithelial cells and muPAR2 found in the bas-al epithelibas-al cells (11). While most subsequent studies focused on muPAR1, the so-called canonical form, muPAR2 expression at the protein level was not confirmed. The present study shows that, in contrast to muPAR1, msuPAR2 forms a stable protein and its overexpression induces severe kidney disease in mice, which is dependent on expression of integrin β3 and, by extrapolation, on outside-in signaling through the integrin αvβ3-Src axis.
In contrast to muPAR1, which has 3 intact domains (D1 to D3) and 7 predicted sites of glycosylation, muPAR2 has only intact domain, D1 (encoded by exons 2 and 3), and part of D2 (encoded by exon 4), lacking the remaining of the native proteins (part of D2 and all of D3, encoded by exons 5–7), and consequently miss-es 5 N-glycosylation sitmiss-es and the GPI anchor. Based on its
pro-Figure 7. Blocking Src activity reduces proteinuria in msuPAR2-Tg mice. (A) Glomerular Src activity was determined by immunofluorescent staining of the
[image:10.585.49.524.54.327.2]Figure 8A). Since msuPAR2 is associated with FSGS-like kidney changes in our mouse model, we raise the possibility that overex-pression of one or more of these human isoforms may be associ-ated with induction of FSGS in humans. Of these, human isoform 3 appears to be the closest structurally to msuPAR2: it has a dele-tion of exon 5 and hence lacks the 3 C-terminal β-strands in D2. An important difference is that in the human isoform, exon 5 is spliced in frame, resulting in both D3 and the GPI anchor remain-ing intact, while in mouse isoform 2, exon 5 is spliced out of frame such that D3 and the GPI sequences are absent. Nevertheless, human isoform 3 would most likely form the same dimer assem-bly as we observed in the msuPAR2 structure. Human isoform 1 is equivalent to canonical mouse uPAR1, with 3 intact Ly6/uPAR domains and a GPI anchor sequence. For the remaining 2 variants, it is difficult to speculate on the impact of exon deletion on struc-ture. Human isoform 4 has an in-frame deletion of exon 6, which contributes the N-terminal sheet assembly to D3, but retains the 3 C-terminal strands of D3 and the GPI anchor. Human isoform 2 shares with msuPAR2 an out-of-frame splice junction follow-ing deletion of exon 7; it resembles msuPAR2 in lackfollow-ing a GPI anchor sequence and a single unpaired β-strand. The C terminus of this form contains the N-terminal strands from D3 followed by a short, 30-residue sequence generated from mistranslation. As this sequence contains 3 cysteine residues, the effect on structure cannot be predicted. Clearly, further studies on alternative human uPAR isoforms are required to determine their respective roles in the pathogenesis in kidney disease and to characterize their dis-tinct structures via EM or x-ray crystallography.
In conclusion, we report that overexpression of msuPAR2 forms a dimer in solution. Overexpression of msuPAR2, but not msuPAR1, in mice is associated with a high-penetrance FSGS-like morphology in kidneys and laboratory abnormalities that are reminiscent of severe CKD. Mechanistically, msuPAR2 requires al. in which no renal phenotype was observed over 6 weeks (13).
The phenotype discrepancy between these 2 msuPAR1-Tg mouse models likely results from (a) variances of protein expression sites (liver versus fat); (b) the amount of circulating msuPAR1 protein; and (c) differences in the period of exposure of suPAR to the kid-ney and monitoring time.
We previously showed that suPAR isoform 1 interacts with and activates β3 integrin, thereby contributing to the development of FSGS (3). The critical role of integrin β3 was verified here with msuPAR2-induced FSGS in msuPAR2-Tg mice, as lack of integrin β3 protected the msuPAR2-Tg/β3–KO mice from developing protein-uria. More importantly, crossing msuPAR2-Tg mice with 2 integrin β3 knockin models that either lack β3 RGT at the C terminus of the β3 cytoplasmic tail or where RGT is replaced with EGK from the β1 tail suggests that αvβ3 integrin signaling via Src is necessary for induc-tion of renal pathology. This concept is confirmed by an increased glomerular Src phosphorylation in msuPAR2-Tg mice. Src family kinases belong to nonreceptor protein tyrosine kinases and have been implicated in many CKD models (22). In particular, Src activity is increased in the animal models of autosomal dominant polycys-tic kidney disease (ADPKD) (23). In human patients with ADPKD, bosutinib (SKI-606), an oral dual Src/Bcr-Abl tyrosine kinase inhib-itor, could reduce kidney growth compared with placebo (24). Here, we found for what we believe is the first time that c-Src activation as indicated by c-Src phosphorylation was increased in the podocytes of human FSGS, but not in other examined nephropathies, includ-ing LN, MPGN, and MCD. Additionally, treatment with Src inhibi-tors PP1 and Src inhibitor-1 could reduce proteinuria in msuPAR2-Tg mice, not only verifying the involvement of glomerular c-Src kinase activity in FSGS, but also generating a possible therapeutic concept via modulating glomerular Src activity.
[image:11.585.46.402.54.314.2]In humans, we have detected transcripts for each of the 4 human isoforms in PBMCs from healthy subjects (Supplemental
Figure 8. Glomerular c-Src activity is increased in human FSGS kidney.
The trypsinized peptides were analyzed by an UltiMate 3000 nanoLC and the Q Exactive HF Orbitrap MS System (Thermo Scien-tific). Peptides in samples were trapped on a μ-precolumn and then transferred to and separated on an in-house packed C18 analytic col-umn (particle size 3.6 μm, 100 μm i.d. × 135 mm) with a solvent gra-dient. The mobile phase consisted of 0.1% FA as solvent A and ACN with 0.1% FA as solvent B. The gradient started from 2.5% solvent B at 200 nl/min, was increased from 2.5% to 30% solvent B from 5 to 20 minutes, was increased from 30% solvent B at 200 nl/min to 95% solvent B at 300 nl/min in 5 minutes, was maintained at 95% solvent B and 300 nl/min for 2.5 minutes, was decreased to 2.5% solvent B at 300 nl/min in 2.5 minutes, and was maintained at 2.5% solvent B and 300 nl/min for 10 minutes. Elute from the column was directly ionized by a nanospray source and analyzed by MS in data-dependent acquisition (DDA) or parallel reaction monitoring (PRM) mode, which monitored 10 peptides of msuPAR1 and msuPAR2. The mass resolu-tion was 60,000 and 15,000 for MS and MS/MS respectively. AGC, isolation window, and off-set were set to 2 × 10⁵, 2 m/Z, and 0.5 m/Z.
EM analysis of protein. Aliquots of purified msuPAR2 were allowed to adhere for 30 seconds to 1 minute to carbon-coated copper grids and then stained with 0.75% uranyl formate (Ted Pella). Images were recorded under minimum electron dose conditions using a CM10 electron microscope (Philips Electron Optics). Images were recorded at 100 kV on either a Gatan Orius 2k × 2k CCD camera at a nominal magnification of ×27,500, generating an image at 2.06 Å/pixel, or on Kodak 4489 film at a nominal magnification of ×52,000. The film micrographs were digitized with a CoolScan 9000 scanner (Nikon Instruments) at 8 bits per pixel and 6.35 μm per pixel, which was sub-sequently averaged to 12.7 μm per pixel for a final 2.44 Å/pixel. The optical density for each negative was adjusted to give a mean value of approximately 127 over the total range of 0 to 255.
Image reconstruction. Image processing was performed with the EMAN2 suite (26). Images were manually evaluated for minimal drift and astigmatism and CTF parameters determined for each micrograph. For preliminary sample evaluation, data from the Gatan Orius CCD was employed. A total of 1334 particles were selected from 31 micro-graphs and CTF phase corrections applied. Particles were subjected to iterative reference-free classification and averaging and 17 resulting classes used to generate a preliminary 3D model generated without any imposed symmetry using the EMAN2 routine e2initialmodel.py. A starting model displaying C2 symmetry was selected and fur-ther refined against the individual particles in the preliminary data set using a multireference alignment algorithm with C2 symmetry imposed. The full structural analysis employed data collected on film. A total of 14,125 particles were selected from 20 micrographs using the semiautomated boxing routine in EMAN2. CTF-corrected parti-cles were subjected to 4 rounds of iterative reference-free classifica-tion and averaging, with particles contributing to clearly aggregated averages excluded at each step and particles possessing low signal-to-noise ratio excluded at the final round, resulting in a final data set of 8455 particles. The data set was split and subjected to iterative refinement in EMAN with the same starting model generated above and imposed C2 symmetry. Progress of the refinement was evaluated by Fourier shell correlation between succeeding models and ceased after the sixth round, when subsequent models generated by the refinement failed to display improvement in resolution. Resolution of the final model was determined by Fourier shell correlation between the presence of β3 integrin-Src signaling to generate proteinuria.
Modulating glomerular Src activity may provide a framework for therapeutic strategies in proteinuria management.
Methods
Cloning, expression and purification. cDNA fragments encoding mouse isoform 1 (GenBank NM_011111) and isoform 2 (GenBank BC010309) were amplified by PCR with total RNA isolated from cul-tured mouse podocytes (3, 25). msuPAR1 (isoform 1 mature protein, aa 24–297) was subcloned into the pSecTag2 vector with C-terminal Myc/His tag (Thermo Fisher Scientific), while isoform 2 was sub-cloned into pSecTag2, p3xFLAG-CMV-14 (E7908, MilliporeSigma), or pCMV6-Entry with C-terminal Myc/FLAG tag (Origene), respective-ly, for maximum protein yield. For protein expression and purification, pSecTag2-derived plasmid DNA was transfected and expressed into the FreeStyle 293 expression system (Thermo Fisher Scientific) for 4 to 5 days. The cultured medium was then harvested for msuPAR1 or msuPAR2 purification with Pierce anti–c-Myc agarose gel (Ther-mo Fisher Scientific) following the manufacturer’s instructions. For p3xFLAG-CMV-14 or pCMV6-based msuPAR2 expression and puri-fication, the plasmid DNA was transfected into HEK293T cells and incubated for 48 to 72 hours. The cells were then harvested and lysed with CelLytic M (MilliporeSigma), with the cell lysates centrifuged at 13,800 g for 20 minutes. After centrifugation, the supernatants were incubated with anti-FLAG M2 affinity agarose gel (MilliporeSigma) for 2 hours at 4°C. After sufficient washing, msuPAR2 protein was elut-ed from the anti-FLAG M2 affinity agarose gel with 0.1 M glycine-HCl. Reducing, nonreducing, and native PAGE. To characterize the above purified mouse suPAR recombinant proteins, 1 to 2 μg of msuPAR1 or msuPAR2 was incubated with reducing sample buffer containing both LDS and DTT (Thermo Fisher Scientific) and heated to 70°C for 10 minutes before being loaded into NuPAGE 4%–12% Bis-Tris gel (Ther-mo Fisher Scientific) for electrophoresis. For nonreducing PAGE, equal amounts of msuPAR recombinant proteins were incubated with LDS sample buffer before being loaded into NuPAGE 4%–12% Bis-Tris gel for separation following the manufacturer’s instructions. To visualize the proteins, the gels were stained with GelCode Blue Reagent (Ther-mo Fisher Scientific). To perform native PAGE, both msuPAR1 and msuPAR2 were buffer exchanged to PBS, and 2–3 μg of each protein was mixed with NativePAGE sample buffer and loaded directly into 4%–16% Bis-Tris NativePAGE gel (Thermo Fisher Scientific) for electrophoresis at 4°C for 2 hours. Afterwards, the gel was stained with NOVEX Colloi-dal Blue Staining Kit (Thermo Fisher Scientific) to visualize the proteins. Similarly, human uPAR proteins, including isoform 1 (R&D Systems), isoform 2 (Origene, corresponding to NM_001005376), and isoform 3 (purified in house as above stated), were analyzed with SDS gel under reducing and nonreducing conditions as well and visualized with Impe-rial Protein Stain (Thermo Fisher Scientific).
incubated with anti-msuPAR2 antibody for 30 minutes at room tem-perature, and duplicated blots were processed with peptide-antibody mixture simultaneously, as with msuPAR2 antibody, for comparison.
Adipocyte tissue qPCR and immunohistochemistry. To examine msuPAR2 expression, gonadal fat tissues were excised out immedi-ately after the mice were sacrificed. Total RNA was isolated with the RNeasy Lipid Tissue Mini Kit (QIAGEN). qPCR was performed with Bio-Rad’s CFX96 Touch Real-Time PCR Detection System. The msuPAR2 primer pairs were as follows: forward, ACTACCGTGCTTC-GGGAATG; reverse, AATGTTGGTCCCGTGACTGT.
For immunohistochemistry, paraffin-embedded fat tissues were sectioned at 4 μm and rehydrated. The sections were heated at 95°C with Antigen Unmasking Solution (Vector Laboratories) for 5 to 10 minutes and treated with 3% hydrogen peroxide for 10 minutes, fol-lowed by 0.5% Triton X-100 for 1 hour. After blocking with Avidin/ Biotin Blocking Kit (Thermo Fisher), sections were incubated with rabbit anti–c-Myc antibody (1:400) overnight at 4°C. Then the bioti-nylated goat anti-rabbit IgG (Vector Laboratories) was added for 30 minutes. Thereafter, positive staining was revealed by ImmPACT DAB Peroxidase (HRP) Substrate (Vector Laboratories). Counterstain-ing was performed with CAT Hematoxylin (Biocare Medical).
RNA-Seq. Kidney glomeruli were isolated from msuPAR2-Tg mice and their littermate controls with the aid of Dynabeads (Thermo Fish-er), as described elsewhere (28). Total RNA of the glomeruli was iso-lated using the RNeasy Mini Kit (QIAGEN). RNA quality was assessed by Agilent Bioanalyzer 2100 and RIN scores of 7 or above were used. Libraries were prepared by the Illumina TruSeq RNA Preparation Kit. Samples were sequenced using Illumina HiSeq for single-reads up to 50 bp. The short reads were mapped to the UCSC mouse mm10 refer-ence genome using TopHat (29, 30). Next, the alignment results were processed using Cufflink to perform differential analysis on both the gene and transcript levels (31). The raw P values were adjusted by the Benjamini–Hochberg correction (32). Gene-set enrichment analysis was performed with the Database for Annotation, Visualization and Integrated Discovery (DAVID) (33).
Kidney immunofluorescence. Frozen mouse kidney tissues were cut at 4 μm thickness and fixed with cold acetone for 10 minutes. After blocking with blocking solution (5% chicken normal serum for 1 hour; samples were stained with goat anti-mouse uPAR antibody, 1:200; R&D) for msuPAR1 and rabbit anti-mouse suPAR2 (1:200, in house) for msuPAR2. Rabbit anti-human podocin antibody (1:300, MilliporeSig-ma) or goat anti-human synaptopodin (1:300, Santa Cruz Biotechnol-ogy Inc.) was used to label podocytes. The secondary antibodies for msuPAR1 labeling were Alexa Fluor 488–conjugated chicken anti-goat IgG (1:1000; Molecular Probes) and Alexa Fluor 594–conjugated chicken anti-rabbit IgG (1:1,000; Molecular Probes). For msuPAR2 labeling, the secondary antibody combination was Alexa Fluor 488– conjugated chicken anti-rabbit IgG (1:1000; Molecular Probes) and Alexa Fluor 594–conjugated chicken anti-goat IgG (1:1,000; Molec-ular Probes). Src phosphorylation was labeled with p–c-Src antibody (A96, 1:100, Santa Cruz Biotechnology Inc.). After sufficient washing, stained samples were mounted with ProLong Gold Antifade Reagent with DAPI (Molecular Probes, P36935). Images were obtained and analyzed using a LSM 700 confocal microscope (Carl Zeiss).
To explore the involvement of c-Src activity in human kidney dis-eases, a retrospective study with deidentified renal biopsy specimen was performed. The cryosections were fixed in 4% PFA for 15 minutes, each independently refined model. The isosurface for the final model
was determined from the molecular weight of the full dimer (50 kD), which enclosed a volume of 61,000 Å3 using a protein partial-specific volume of 0.74 cm3/g. The Chimera molecular visualization system was used for visual analysis of the 3D structures and to fit the atomic coordinates for the mouse D1 within the EM density (27). The coordi-nates for the partial D2 were placed manually.
Mice. C57BL/6j mice (stock no. 000664), uPAR-KO mice (stock no. 002829), and integrin β3 KO mice (stock no. 004669) were pur-chased from Jackson Labs. β3ΔRGT and β3EGK mouse models were generated in-house.
Generation of msuPAR transgenic mouse models. We generated mouse models that express mouse uPAR isoform 1 and isoform 2, respectively. Isoform 1 (msuPAR1-Tg) corresponds to NM_011111 in GenBank, cover-ing the mature protein without the GPI anchor. Isoform 2 (msuPAR2-Tg) corresponds to BC010309 in GenBank. Both msuPAR1 and msuPAR2 were under the control of the AP2 promoter, followed immediately by a secretion signal peptide (Igκ). This experimental model system should result in the expression of suPAR protein in fat tissue and release into the blood circulation thereafter. Genotyping-positive founder mice were backcrossed with C57BL/6 mice for at least 5 generations to estab-lish the colony. Both msuPAR1-Tg and msuPAR2-Tg mice were viable and fertile. Both lines of msuPAR-Tg mice presented with body weights similar to those of their non-Tg littermate controls. To enhance msuPAR production, regular rodent diet was replaced by HFD (Research Diets) when the mice were 2 months old, and the animals were kept on the HFD until they were sacrificed for further experiments. In order to generate double-transgenic mice, including msuPAR2-Tg/β3KO, msuPAR2-Tg/
β3ΔRGT, msuPAR2-Tg/β3EGK, msuPAR2T-Tg mice were crossed with integrin β3 KO mice, and β3ΔRGT and β3EGK mice, respectively. To monitor proteinuria development and progression, spot urine was col-lected periodically from the above-mentioned mice. Urinary albumin and creatinine were determined using mouse albumin ELISA (Bethyl Labs, E99-134) and creatinine assay (Cayman Chemical, 500701) kits according to manufacturers’ protocols.
Administration of Src inhibitors. Fifteen 10- to 12- week-old msuPAR2-Tg mice were randomly divided into the Src inhibitor treat-ment group (n = 8) and the vehicle control group (n = 7). PP1 (Calbio-chem) and Src inhibitor 1 (MilliporeSigma) were dissolved in DMSO and injected into msuPAR2-Tg mice via i.p. at 5 mg/kg. Vehicle control mice received the same amount of DMSO. Spot urine was collected before and after treatment to monitor proteinuria in terms of ACR.
distributed data set, log transformation was performed. All data are presented as median and IQR, unless otherwise indicated. P < 0.05 was considered significant.
Study approval. Animal studies were approved by the IACUC at Rush University Medical Center. All mice received humane treatment per protocol. The retrospective study with deidentified human biopsy specimens was approved by Rush IRBs (no. 14051401).
Author contributions
CW and JR developed the concept and designed the study. CW, JL, BDA, KZ, JC, MM, BS, KHK, NJT, RRD, SH, SD, VP, SL, and JM performed experiments. BDA and MAA carried out the structural studies. ZL and SJS provided β3 integrin knockin mouse models. DJC and SL provided anonymous renal specimens. CW, JR, BDA, JC, SS, SJS, and JK analyzed and interpreted the cell, biochemical, and animal data. CW and JR wrote the paper. SSH provided statis-tical input. BDA, JC, SS, SJS, JK, MAA, and MT were involved in editing the paper.
Acknowledgments
This work was supported in part by NIH grant 1R01 DK101350. We are grateful for the contributions of the participants who made this study possible. In particular, we thank Hong Hu from Core for Research Informatics, University of Illinois at Chicago, for assis-tance with RNA-Seq analysis. We thank Yingcai Wang from the University of Miami for assistance with suPAR transgenic mice. MAA was supported by RO1 DK48549 and RO1 DK088327. SJS was supported by HL78784.
Address correspondence to: Changli Wei, Department of Medi-cine, Rush University Medical Center, 1735 West Harrison Street, Cohn Research Building, 7th Floor, Suite 716, Chicago, Illinois, 60612, USA. Phone: 312.942.0131; Email: Changli_Wei@rush. edu. Or to: Jochen Reiser, Department of Medicine, Rush Universi-ty Medical Center, 1715 West Congress Parkway, Kellogg Building, Suite 1003, Chicago, Illinois 60612, USA. Phone: 312.942.6639; Email: [email protected].
followed by a brief heating process in a microwave oven. The staining procedures were as described above with p–c-Src antibody (A96, 1:50, Santa Cruz Biotechnology Inc.) and synaptopodin antibody (P-19, 1:100, Santa Cruz Biotechnology Inc.).
TEM. TEM was performed as previously described (3). In brief, renal tissues were collected and dissected into 2 × 2 mm pieces. The tissues were fixed in 4% PFA overnight, washed 3 times in PBS, and post-fixed in 1% OsO4. Tissues were washed in 0.1 M cacodylate buf-fer, dehydrated, and embedded in Epon812 (EMS). 70 nm sections were mounted onto Formvar-coated Ni slot grids (EMS). Grids were stained for 15 minutes in 5% uranyl acetate followed by 0.1% lead citrate for 5 minutes. Electron micrographs were obtained and ana-lyzed using the Zeiss Sigma HDVP Electron Microscope.
Detection of human uPAR isoforms in PBMCs. To determine whether human uPAR isoforms exist, PBMCs were harvested from unidentified healthy blood donors and total RNA was isolated for qPCR. Primers or probes were designed to detect uPAR isoforms 1 to 4 specifically. The respective amplicon sequences were as follows: isoform 1 fragment: 163 bp, CCCAATCCTGGAGCTTGAAAATCT- GCCGCAGAATGGCCGCCAGTGTTACAGCTGCAAGGGGAA- CAGCACCCATGGATGCTCCTCTGAAGAGACTTTCCTCATT- GACTGCCGAGGCCCCATGAATCAATGTCTGGTAGCCAC-CGGCACTCACGAACCGAAAAAC; isoform 2 fragment: 96 bp, CTCACGAACGCTCACTCTGGGGAAGCTGGTTGCCATGTA- AAAGTACTACTGCCCTGAGACCACCATGCTGTGAGGAAGC-CCAAGCTACTCATGTAT; isoform 3 fragment: 88 bp, CACTGAG- GTGAAGAAGTCCTGGAGCTTGAAAATCTGCCGCAGAATGG-CCGCCAGTGTTACAGCTGCAAGGGGAACAGCACCCATGGAT; and isoform 4 fragment: 75 bp, CTGAAATGCTGCAACACCAC- CAAATGCAACGAGGGCCCAAAACCGAAAAACCAAAGCTATAT-GGTAAGAGGCTGT.
Statistics. Statistical analysis was done with Prism 5.0 software (GraphPad). Differences between 2 groups were analyzed by Stu-dent’s 2-tailed t test or the Mann-Whitney U test when appropriate. Differences between more than 2 groups were analyzed using 1-way ANOVA. Differences between groups containing 2 variables were assessed by 2-way ANOVA. In cases in which there was no normally
1. Ploug M, Rønne E, Behrendt N, Jensen AL, Blasi F, Danø K. Cellular receptor for urokinase plas-minogen activator. Carboxyl-terminal processing and membrane anchoring by glycosyl-phosphati-dylinositol. J Biol Chem. 1991;266(3):1926–1933. 2. Thunø M, Macho B, Eugen-Olsen J. suPAR:
the molecular crystal ball. Dis Markers. 2009;27(3):157–172.
3. Wei C, et al. Circulating urokinase receptor as a cause of focal segmental glomerulosclerosis. Nat
Med. 2011;17(8):952–960.
4. Hahm E, et al. Bone marrow-derived immature myeloid cells are a main source of circulating suPAR contributing to proteinuric kidney dis-ease. Nat Med. 2017;23(1):100–106. 5. Delville M, et al. A circulating antibody panel
for pretransplant prediction of FSGS recurrence after kidney transplantation. Sci Transl Med. 2014;6(256):256ra136.
6. Hayek SS, et al. A tripartite complex of suPAR, APOL1 risk variants and αvβ3 integrin on podo-cytes mediates chronic kidney disease. Nat Med.
2017;23(8):945–953.
7. Hayek SS, et al. Soluble urokinase receptor and chronic kidney disease. N Engl J Med. 2015;373(20):1916–1925.
8. Drechsler C, et al. Soluble urokinase plasminogen activator receptor and outcomes in patients with diabetes on hemodialysis. Clin J Am Soc Nephrol. 2017;12(8):1265–1273.
9. Schaefer F, et al. Association of serum soluble urokinase receptor levels with progression of kidney disease in children. JAMA Pediatr. 2017;171(11):e172914.
10. Luo S, et al. Soluble urokinase-type plasminogen activator receptor in black americans with CKD.
Clin J Am Soc Nephrol. 2018;13(7):1013–1021.
11. Kristensen P, Eriksen J, Blasi F, Danø K. Two alter-natively spliced mouse urokinase receptor mRNAs with different histological localization in the gastro-intestinal tract. J Cell Biol. 1991;115(6):1763–1771. 12. Pyke C, et al. An alternatively spliced variant of
mRNA for the human receptor for urokinase plas-minogen activator. FEBS Lett. 1993;326(1–3):69–74.
13. Spinale JM, et al. A reassessment of soluble uroki-nase-type plasminogen activator receptor in glo-merular disease. Kidney Int. 2015;87(3):564–574. 14. Cathelin D, et al. Administration of recombinant soluble urokinase receptor per se is not sufficient to induce podocyte alterations and proteinuria in mice. J Am Soc Nephrol. 2014;25(8):1662–1668. 15. Lin L, Gårdsvoll H, Huai Q, Huang M, Ploug M.
Structure-based engineering of species selectiv-ity in the interaction between urokinase and its receptor: implication for preclinical cancer thera-py. J Biol Chem. 2010;285(14):10982–10992. 16. Johnson RJ, et al. Expression of smooth muscle
cell phenotype by rat mesangial cells in immune complex nephritis. Alpha-smooth muscle actin is a marker of mesangial cell proliferation. J Clin
Invest. 1991;87(3):847–858.
18. Ablooglu AJ, Kang J, Petrich BG, Ginsberg MH, Shattil SJ. Antithrombotic effects of targeting alphaIIbbeta3 signaling in platelets. Blood. 2009;113(15):3585–3592.
19. Liao Z, et al. Interaction of kindlin-2 with inte-grin β3 promotes outside-in signaling respons-es by the αVβ3 vitronectin receptor. Blood. 2015;125(12):1995–2004.
20. Bain J, et al. The selectivity of protein kinase inhibitors: a further update. Biochem J. 2007;408(3):297–315.
21. Suh TT, Nerlov C, Danø K, Degen JL. The murine urokinase-type plasminogen activator receptor gene. J Biol Chem. 1994;269(42):25992–25998. 22. Wang J, Zhuang S. Src family kinases in
chron-ic kidney disease. Am J Physiol Renal Physiol. 2017;313(3):F721–F728.
23. Sweeney WE, von Vigier RO, Frost P, Avner ED.
Src inhibition ameliorates polycystic kidney dis-ease. J Am Soc Nephrol. 2008;19(7):1331–1341. 24. Tesar V, et al. Bosutinib versus placebo for
auto-somal dominant polycystic kidney disease. J Am
Soc Nephrol. 2017;28(11):3404–3413.
25. Mundel P, et al. Rearrangements of the cytoskel-eton and cell contacts induce process formation during differentiation of conditionally immor-talized mouse podocyte cell lines. Exp Cell Res. 1997;236(1):248–258.
26. Tang G, et al. EMAN2: an extensible image pro-cessing suite for electron microscopy. J Struct
Biol. 2007;157(1):38–46.
27. Goddard TD, Huang CC, Ferrin TE. Software extensions to UCSF chimera for interactive visu-alization of large molecular assemblies.
Struc-ture. 2005;13(3):473–482.
28. Takemoto M, et al. A new method for large scale
isolation of kidney glomeruli from mice. Am J
Pathol. 2002;161(3):799–805.
29. Trapnell C, Pachter L, Salzberg SL. TopHat: dis-covering splice junctions with RNA-Seq.
Bioinfor-matics. 2009;25(9):1105–1111.
30. Fujita PA, et al. The UCSC Genome Brows-er database: update 2011. Nucleic Acids Res. 2011;39(Database issue):D876–D882. 31. Trapnell C, et al. Transcript assembly and
quantification by RNA-Seq reveals unannotated transcripts and isoform switching during cell dif-ferentiation. Nat Biotechnol. 2010;28(5):511–515. 32. Hochberg Y, Benjamini Y. More powerful proce-dures for multiple significance testing. Stat Med. 1990;9(7):811–818.
33. Dennis G, et al. DAVID: Database for Annotation, Visualization, and Integrated Discovery. Genome