© 2019, IRJET | Impact Factor value: 7.211 | ISO 9001:2008 Certified Journal
| Page 6289
Application of Time Divisions Scheduling Techniques for Duration and
Quantity based Project Control is a Vivacious Decision Process
Balaprasad Vitthal Gajul
1, Gaurav Desai
21
Postgraduate student, Department of Civil Engineering, School Engineering and Technology, Sandip University
Nashik, Maharashtra, India
2
Assistant Professor, Department of Civil Engineering, School Engineering and Technology, Sandip University
Nashik, Maharashtra, India.
---***---
Abstract— the scheduling plays crucial part for planning, executing, controlling, monitoring and closing the construction projects within stipulated time and in budget. The construction projects are complex in nature because there are various activities which are interconnected to each other and have to be completed in stipulated time limit and given budget. The Gantt chart and CPM have some drawbacks make these tools insufficient for project tracking, monitoring and reviewing of projects on account of both these tools are based on only duration of project activities. But, it is observed that in actual construction projects activities are connected to each other not only related to duration but also with the quantity of work. Hence the project unable to perform as per planned schedule requirements.This study offers a modified new scheduling technique to overcome the limitations of Gantt and Critical path method using Unit Time & Work Divisions Technique tool that offers a daily tracking, monitoring and reviewing of project schedule. To overcome periodical review of schedule by adopting the duration as well as work quantity of each activity into separate divisions. This new scheduling technique is expected to help project managers to achieve a better level of control over projects with better conceptualization, optimization and determination reinforce to meet project success.
Key words: Monitoring and reviewing, Interrelationship of activities, Critical Path Divisions scheduling Technique (CPD), Work quantity and Project control.
1.INTRODUCTION
The successful completion of project in construction industry mainly depends on completion of project in scheduled time and in budget. The Project Tracking, Monitoring and Control based on Duration and quantity divisions scheduling Techniques is a vivacious decision process. The construction project consist number of activities which are interconnected to each other hence management tracking monitoring reviewing and controlling of such projects till completion of project entirely is very distraught and complexity job,. The project managers/ site Engineer are generally handle project with Gantt Charts and Critical Path Method (CPM). The project manager/ site Engineer use Gantt charts and critical path method to determine the inter relationship of activities. While schedule of the project mainly the project duration, activities float times, data about the degree flexibleness related to the schedule of project and the critical or non-criticalness of the activities are very important.
Project managers/ site Engineer generally adopt two methods that are Gantt Chart Method and Critical Path Method (CPM). The short coming of these two methods that these methods are based on only duration of project tracking. These two methods neither tracked duration as well as quantity of work. There are some lacunas in Critical Path Method (CPM) and Gantt Chart Method this study gives the new method of scheduling technique considering Critical Path Division (CPD) techniques that gives a daily tracking monitoring and reviewing of project scheduling by showing the duration as well as quantity of each activity into different divisions. The technique is supportive to project manager/ site Engineer to control the project not only from start to end with excellent control but also give support to take decision each day duration as well as quantity wise to complete the project within stipulated time period successfully.
2.METHODOLOGY
© 2019, IRJET | Impact Factor value: 7.211 | ISO 9001:2008 Certified Journal
| Page 6290
Figure No: 1 Flow Chart of Methodology
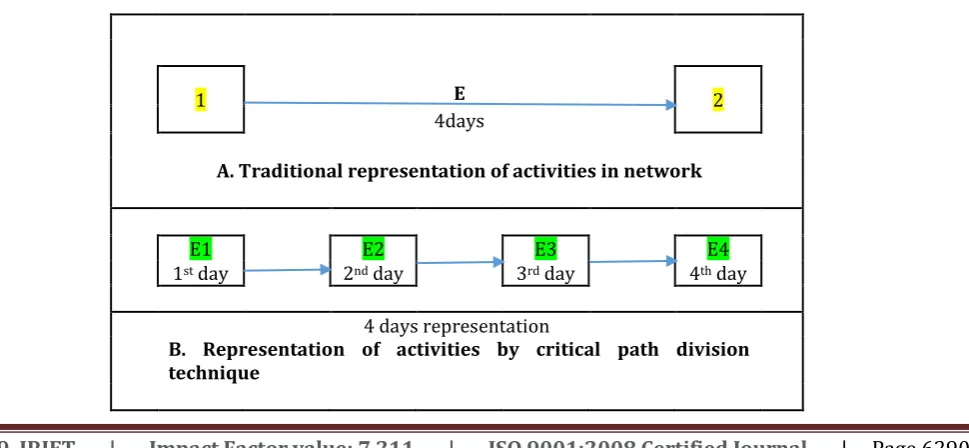
The following way traditional activity duration is divided in number of days as shown below
Table 1. Show the activity in network analysis as per critical path division technique
1 E 2
4days
A. Traditional representation of activities in network
E1 E2 E3 E4
1st day 2nd day 3rd day 4th day
4 days representation
B. Representation of activities by critical path division technique
Result discussion and conclusion Validation of modified techniques
Develop a new alternative scheduling model by modifying the above of commonly used techniques by handling the relationship between activities by divisonal the time in seperate time divisions work out quantities of each activity and determine
the work quantity for each time division for individual activity
Find out the areas in the above techniques which makes themless effcienet for project control and hence project success
Identify the commonly used management techniques for planning, scheduling and project control CPM and Gantt Chart
Study of various management techniques
by literature survey by discussion with field professionals
[image:2.595.69.554.563.787.2]© 2019, IRJET | Impact Factor value: 7.211 | ISO 9001:2008 Certified Journal
| Page 6291
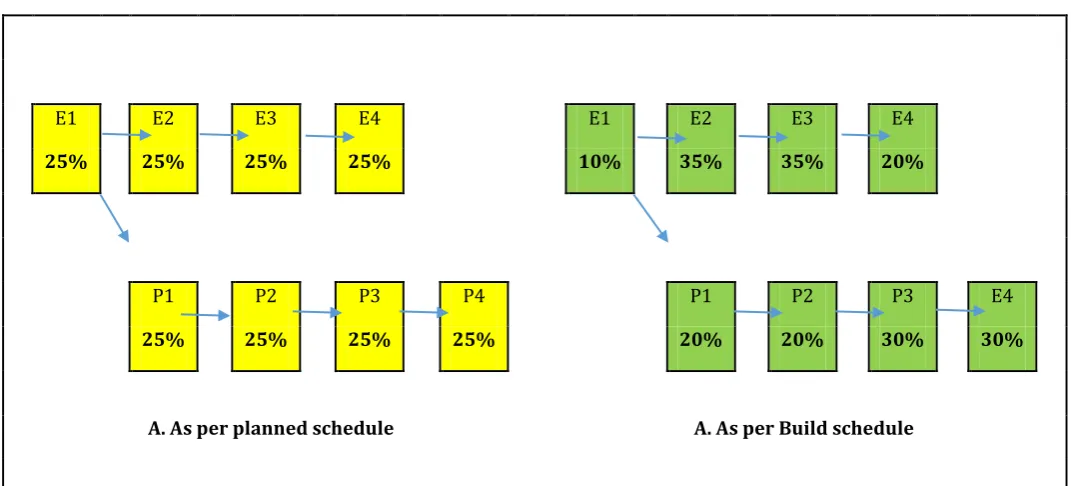
[image:3.595.103.493.144.380.2]The work quantity of activities are divided in day work and duration also suppose the exaction is going to executed in 4 days then each day the work should be done 25% as per base plan schedule. Presentation can be shown as following.
Table 2. Representation of Work by duration as well as Quantity of an activity
Excavation activity split in 4 days i.e 100/4 = 25%
E1 E2 E3 E4
1st day 2nd day 3rd day 4th day
25% 25% 25% 25%
4 days representation
Representation of activities by time and work division technique
This technique able to do day to day activity dividing rather than activity-by-activity which provided in critical path method (CPM). This technique helps to monitor base line to work done schedule on time division technique. (Daily monitoring the progress not only on duration basis but also work quantity basis).
Table 3. Representation of Day by Day Update in Scheduling
3.OBJECTIVES OF RESEARCH
The construction industry have number of activities and they are interconnected to each other hence to complete the project in stipulated time and budget. This study develop an effective method of scheduling model for construction
E1 E2 E3 E4 E1 E2 E3 E4
25% 25% 25% 25% 10% 35% 35% 20%
P1 P2 P3 P4 P1 P2 P3 E4
25% 25% 25% 25% 20% 20% 30% 30%
A. As per planned schedule A. As per Build schedule
[image:3.595.30.566.449.692.2]© 2019, IRJET | Impact Factor value: 7.211 | ISO 9001:2008 Certified Journal
| Page 6292
projects. It beats the hindrances of management techniques, which are commonly used during project control, Tracking, review and monitoring.
Detailed objectives:
The scheduling techniques used in construction industry commonly by professionals and its study.
The discussion with experts, and extensive review on advantages disadvantages and effectiveness of different scheduling techniques like Gantt chart and (CPM) critical path method. Literature review and survey on different scheduling and management technique. The questioner data survey.
The detail study procedures of implementation and improvement in CPM and Gantt chart.
Develop an alternative and improved new scheduling technique model mechanism that is based on divisional activity durations and work quantity.
4.NEED OF THESTUDY
The construction industry project manager/ site Engineer using Gantt chart and critical path method for scheduling construction projects even though there are some lacunas in these techniques. The traditional representation of critical path method and Gantt chart lacks the ability to clearly represent and record details as-built information like slow or fast progress of project and complete, representation of work interruptions caused by the various parties involved. Critical path method is based on two unrealistic assumptions: that the project deadline is not restricted and that resources are unlimited. Therefore, the most cost-effective corrective actions needed in order to recover delays and overruns in project is required in these techniques.
Both these techniques are when acts as baseline for measuring progress, it is difficult to use it to initiate appropriate corrective actions for recovering delays and overruns. The following list shows the most critical views of CPM and Gantt Charts.
In critical path method activates considers only Finish to Start relationship while many construction activities consists Start to Start and Finish to Finish relationships. Gantt Charts shows the relationship of all activities all but not able to decide critical and non-critical activities. Both critical path method and Gantt chart are not provide the perfect critical days of individual activities,
Gantt chart and critical path method considers only time relationship of activities but the construction industry project activities are interrelated to each other related not only duration but also quantity of work.
Critical path method and Gantt chart techniques are in sufficient to daily decision making and revision of project plan and schedule.
These critical path method and Gantt chart could be difficult to update. After several updates have been done, it becomes hard to read. Schedules updates are usually out of date when they are finished.
The construction industry project have many complex projects the scheduling technique CPM network may be complicated. That makes it very difficult to communicate and understand.
When the construction project comes in execution stage the monitoring and tracking was important to track the project as per base line schedule of project.
As per general practice the project tracking and monitoring activity done by critical path method and Gantt chart periodically as per planned start and finish time only.
The construction industry in many countries in world done survey for delays. The study conducted in India by the
© 2019, IRJET | Impact Factor value: 7.211 | ISO 9001:2008 Certified Journal
| Page 6293
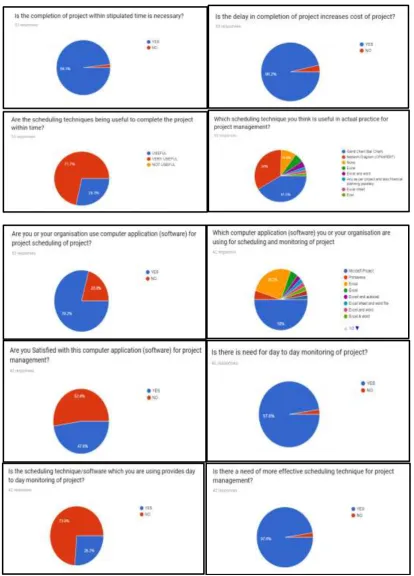
5.DATA COLLECTION QUESTIONER SURVEY
[image:5.595.91.506.140.717.2]Questioner survey denoted that there is requirement of day to day monitoring in simple excel format for consultants, project manage and site Engineer.
© 2019, IRJET | Impact Factor value: 7.211 | ISO 9001:2008 Certified Journal
| Page 6294
Data collection
Name of project: Residential Building.
Address: Sr.No.886/B, P.No.6 Rane nagar Mumbai Agra road, Nashik-422009
Name of owner: Shri. Dattatray Kondaji Thete Through Developer and GPA Holder Shree Gurudatta Construction Through Proprietor
shri. Yadunath Baburao Vibhute Area of Construction: 805.25sq.M Type of Building: G+4RCC Structure
Total Duration of Project (Planned): 180 days. Start Date: 12/03/2018.
End Date (Planned): 03/05/2019.
Name of contractor: Shri. Anil N Yeola and Stru. Engg. Anil N Yeola of Nashik.
[image:6.595.47.553.106.346.2]Total no. of Activities: 73
Figure 3 show the completed residential project
6. DATA ANALYSIS
1. Analysis of Data collected from Questionnaire Survey
The questionnaire survey show that the most consultant/ site Engineer/ contractor generally use excel sheet for their daily work but it is insufficient to show daily tracking of project duration wise and quantity wise hence this study initiated.
2. Analysis of Data Collected from the case study
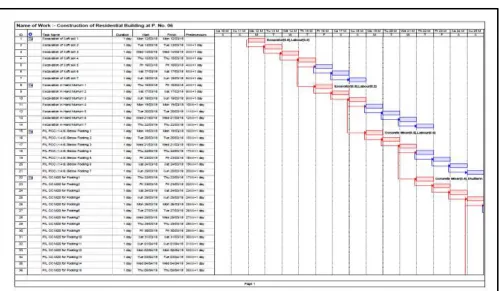
[image:6.595.49.552.452.743.2]© 2019, IRJET | Impact Factor value: 7.211 | ISO 9001:2008 Certified Journal
| Page 6295
In above Gantt chart the activity split in the days duration hence it shows that the activity is not itself critical but some of days of activity are critical.
- The red capsule indicate the critical days of that activity.
- The blue capsule indicate the non-critical days of that activity.
7. Result and discussion:
The traditional representation of Gantt chart represented by using MS-Project shows the critical activities of project which are shown by red colour bars for total activities which is Critical activities.
Figure No 4 shows the same Gantt chart but based on the unit division scheduling mechanism which describes each segments ( activity dived in days) of every activity of entire project. As it is also represented by using MS-project it provides exact critical days of activities involved in project. Excavation Activity has only three days are critical shown by red colour where as traditional Gantt chart shows the whole activity is critical for the same schedule. This shows the effectiveness of Unit division Scheduling Technique over traditional Gantt chart technique for scheduling.
8. Conclusion
In mainly construction industry the two scheduling methods adopted that are Critical path method and Gantt chart (Bar Chart), Critical Path Method (CPM) generally in commonly used for scheduling the construction projects by project Engineer/ project managers. This two Critical path method and Gantt Chart (Bar Chart) methods have some drawbacks to provide successful decision making reinforce for projects Critical path method (CPM ) shows Critical activities and critical path but not able to show the data of interrelationship of activities that are in project. . Gantt chart not able to show data of critical activities.
The completion of project in schedule time and given budget the project the project manager/ site Engineer deal to actual monitoring of project and to overcome lacunas in Critical Path Method (CPM) and Gantt Chart Method this study gives the new method of scheduling technique considering Critical Path Division(CPD) techniques with its mathematical formulation that gives a daily tracking monitoring and reviewing of project scheduling by showing the duration as well as quantity of each activity into different divisions.
In this method the production and time base relationship between the each activates. This two component based method gives vivacious decision process having following advantage.
At very Nano- level critical path division method. Nice approach to understanding the project scheduling In progress of work very less time required to re schedule.
We can avoid the very complex project relationship in activities scheduling.
Nice construction project monitoring tracking reviewing by using not only duration but also quantity (production) based scheduling for completion of project in time and budget.
It gives us very accurate analysis of schedule during the execution and after execution of project.
REFERENCES
1. Shailla (2014), “Comparative Study of Management Operation System Techniques (MOST) and CPM in Construction Scheduling.” International Journal of Engineering Trends and Technology (IJETT), 18-8, pp371-379.
2. David Arditi, Onur B. Tokdemir2 and KangsukSuh (2002), “Challenges in Line-of-Balance Scheduling.” Journal of Construction Engineering and Management, ASCE, 128, pp545-556.
3. Ron Winter, F. BurakEvrenosoglu (2011), “MS Project for Construction Schedulers.” The AACE International 55th Annual Meeting, California, USA.
4. Fang-Ying Shen, Andrew S. Chang (2014), “Effectiveness of Coordination Metods in Construction Projects.” Journal of Management in Engineering, ASCE.
5. Gunnar Lucko (2009), “Productivity Scheduling Method: Linear Schedule Analysis with Singularity Functions.” Journal of Construction Engineering and Management, ASCE, 135, pp246-253.
6. YakubuOlawale and Ming Sun (2013), “PCIM: Project Control and Inhibiting-Factors Management Model.” Journal of Management in Engineering, ASCE, 29, pp60-70.
© 2019, IRJET | Impact Factor value: 7.211 | ISO 9001:2008 Certified Journal
| Page 6296
8. TarekHegazy, and Wail Menesi, (2008), “Delay Analysis under Multiple Baseline Updates.” Journal of Construction Engineering and Management, ASCE, 136, pp1078-1085
9. Galloway P. D. (2006). "Survey of the construction industry relative to the use of CPM scheduling for construction projects." Journal of Construction Engineering and Management, ASCE, 132(7), pp697–711
10. D. K. H. Chua, L. J. Shen and S. H. Bok (2003), “Constraint-Based Planning with Integrated Production Scheduler over Internet.” Journal of Construction Engineering and Management, ASCE, 129, pp293-301.
11. Rene´ A. Yamı´n and David J. Harmelink (2001), “Comparison of Linear Scheduling Model (LSM) and Critical Path Method (CPM).” Journal of Construction Engineering and Management, ASCE, 127, pp374-381.
12. Patricia D. Galloway. (2006). “Survey of the Construction Industry Relative to the Use of CPM Scheduling for Construction Projects.” Journal of Construction Engineering and Management, ASCE, 132, pp697-711.
13. Su-Ling Fan and H. P. Tserng (2006), “Object-Oriented Scheduling for Repetitive Projects with Soft Logics.” Journal of Construction Engineering and Management, ASCE, 132, pp35-48.
14. Ming Lu1 and Heng Li (2003), “Resource-Activity Critical-Path Method for Construction Planning.” Journal of Construction Engineering and Management, ASCE, 129, 412-420.
15. William Ibbs, Long D. Nguyen (2007), “Schedule Analysis under the effect of resource Allocation.” Journal of Construction Engineering and Management, ASCE, 133, 133-138.
16. PasitLorterapong, MongkolUssavadilokrit (2013), “ Construction Scheduling Using the Constraint Satisfaction Problem Method.” Journal of Construction Engineering and Management, ASCE, 139, pp414-422.
17. Daniel Castro-Lacoture, Gursel A Suer, Julian Gonzalez-joaqui and J. K. Yates (2009), “Construction Project Scheduling with Time, Cost and Material Restrictions using Fuzzy Mathematical Models and Critical Path Method.” Journal of Construction Engineering and Management, ASCE, 135, pp1096-1104
![Protocol for a randomised controlled trial of treatment of asymptomatic candidiasis for the prevention of preterm birth [ACTRN12610000607077]](data:image/gif;base64,R0lGODlhAQABAIAAAP///wAAACH5BAEAAAAALAAAAAABAAEAAAICRAEAOw==)