warwick.ac.uk/lib-publications Manuscript version: Author’s Accepted Manuscript
The version presented in WRAP is the author’s accepted manuscript and may differ from the published version or Version of Record.
Persistent WRAP URL:
http://wrap.warwick.ac.uk/118365
How to cite:
Please refer to published version for the most recent bibliographic citation information. If a published version is known of, the repository item page linked to above, will contain details on accessing it.
Copyright and reuse:
The Warwick Research Archive Portal (WRAP) makes this work by researchers of the University of Warwick available open access under the following conditions.
Copyright © and all moral rights to the version of the paper presented here belong to the individual author(s) and/or other copyright owners. To the extent reasonable and
practicable the material made available in WRAP has been checked for eligibility before being made available.
Copies of full items can be used for personal research or study, educational, or not-for-profit purposes without prior permission or charge. Provided that the authors, title and full
bibliographic details are credited, a hyperlink and/or URL is given for the original metadata page and the content is not changed in any way.
Publisher’s statement:
Please refer to the repository item page, publisher’s statement section, for further information.
1
Identification of Incident Parameters of Interference Beams Using Angular Power Spectral Density
Yumeng Song, Xianping Liu, Yanling Tian
*School of Engineering, University of Warwick, Coventry, CV4 7AL, UK
Corresponding author email: [email protected]
Abstract:
Laser interferencelithography is attracting increasing interest of researchers because of its high-efficiency and low-cost in fabrication of patterns. However, there are always operational errors in the set-up of interference systems, which have a significant effect on the final produced interference pattern. This paper has systematically investigated the influences of incident parameters including incident angle, azimuth angle and polarization angle on interference patterns. An algorithm has been proposed to extract interference fringes from complicated multi-beam interference patterns using the angular power spectral density (APSD) function. The incident parameters were calculated based on the data extracted from the APSD images. Simulations were carried out to validate the effectiveness of the proposed algorithm. 3-D periodic patterns were fabricated on silicon wafers using three-beam interference lithography. The topographies of the samples were measured using an optical profiler. Based on the established model, incident parameters of the interference system set-up were calculated. The computational results are in good agreement with the pre-set values. The results have demonstrated the validation of the developed algorithm for incident parameter identification of interference beams.1.
Introduction
Laser induced fabrication has long been used as one of the common methods to fabricate functional surfaces [1]. Among them, laser interference lithography is an efficient technique to fabricate periodic micro- and nano-structures. The fabrication speed can reach 0.9 m2/min [2, 3]. The spatial resolution of structures can be
achieved for a range from 300 nm to several microns [4, 5]. Compared with another widely utilized technique, direct laser writing, which can only process structures as small as 25 μm [6], with a relative low speed of areal fabrication, depending on the structure size [2], laser interference lithography shows great superiority in structure size and processing efficiency.
With laser interference lithography, structures can be processed on large areas with multiple exposure [3]. This paved the way for numerous applications including fabrication of hydrophobic surfaces [4, 7], anti-reflective surfaces for solar cells [8-10], photonic crystals [11], micro lenses [12], substrates for growth of multi-scale structures [13, 14] and many other functional surfaces. With proper selection of different incident parameters, various patterns can be generated using laser interference lithography.
Different types of laser interference system set-ups have been established, including diffractive optical elements (DOE) induced configurations [15, 16] and beam splitter induced configurations [17, 18]. For the DOE system configurations, the parameters of different incident beams can only be adjusted simultaneously by changing optical elements. In contrast to the DOE configurations, the beam splitter induced configurations offer the flexibility in adjusting and tuning the incident parameters through individual incident beams. However, in beam splitter configurations, position errors are very common due to the manual operations in
the setting up process. A misalignment in the set-up may cause a distortion in the interference pattern [18, 19]. For periodically patterned functional surfaces, a change in the period, size, shape or depth of the structures may all affect the practical performance [20]. Hence, it is of great importance to calibrate the incident parameters in order to minimise the influence of error in the set-up of the interference system.
Efforts have been made to calibrate the incident parameters in two-beam interference systems by manually measurements of the structure period on the sample surfaces [21, 22], however, significant errors can exist in manual measurements. It is also a challenge to measure directly the complicated patterns generated by multi-beam interference. The Fast Fourier Transform (FFT) has been applied in the characterization of two-beam interference patterns [3, 23]. By extracting other information from the angular power spectral density (APSD) image, which is generated from the FFT result, it is possible to calibrate the incident parameters in multi-beam interference.
This paper analyses the generation process of the interference pattern, as well as the influences of incident angle, azimuth angle and polarization angle on the interference pattern. An algorithm is established to extract period, orientation and intensity of interference fringes from the interference pattern, and calculate the incident parameters of the laser beams with the APSD function. Simulation and experiment have been conducted to validate the established algorithm and technique. This method can be applied for interference system set-up calibration and alignment compensation.
2.
Theoretical modelling
2 When laser beams with the same wavelength are
incident at the same point on the sample surface from different directions, the beams interfere with each other and an interference pattern appears on the surface. It is necessary to investigate the generation of the patterns, and analyse the influence of different incident parameters, including incident angle
, azimuth angle
and polarization angle
.The intensity of a laser beam at the point ( , , )x y z in an n-beam spatial interference can be calculated by [22]
1
1 1
2 1 2
2 1 cos k 2 n i i
i j i j
i
j
n n
j
i i j
I a
a a
Ep p r d r d
(1)
where I is the intensity of the pattern, E is the sum of the electric fields of all the incident laser beams,
( 1, 2, , )
i
a i n are the amplitudes of the electric fields of the laser beams,
i (i1, 2, , )n are the initial phases of the laser beams, dxiy jzk is the position vector of the point, ri (i1, 2, , )nare the propagation vectors and pi (i1, 2, , )n are the polarization vectors, which can be calculated from equations (2) and (3), respectively.
sin cos sin sin cos
i
i
i
i
i
ir i j k (2)
cos cos cos sin sin
cos sin cos sin cos cos sin
i i i i i
i i i i i i i
p i
j k(3)
2.2 Influence of incident parameters on interference pattern
The incident parameters including incident angle, azimuth angle, polarization angle and initial phase may all affect the intensity distribution of the interference fringes. It can be observed from equation (1) that the interference components in multi-beam interference is the superposition of the interference components of each pair of incident beams. By investigating the relationship between different incident parameters and the interference pattern, incident parameters can be identified backwards from the interference pattern. This will provide valuable guidance in the calibration of the interference system. The period of the interference pattern (P) can be found by [21]
2 2
1 1 2 2 1 1 2 2
λ
cos sin cos sin sin sin sin sin
P (4)
where λ is the wavelength of the laser source,
( 1, 2)
i i
and
i (i1, 2) are the azimuth angles and incident angles of the laser beams, respectively.The orientation of the fringes can be expressed by the azimuth angle of the pattern ( ), which can be expressed as
1 1 2 2
1 1 2 2
cos sin cos sin tan
sin sin sin sin
(5)
The pattern intensity is determined not only by the intensity of the laser source, but also by the polarization directions of two laser beams, which are defined as polarization vectors ( p), and can be calculated with equation (3). The intensity of the interference component (A) is defined as
1 2 1 2
2
A a a p p (6)
3.
APSD function and simulation of incident
parameters calculation
As explained above, all multi-beam interference patterns can be treated as the superposition of the interference fringes of each pair of laser beams. However, since for an n-beam interference pattern the number of interference components is given by:
( 1) 2
n n
N and the interference components
overlap with each other, it is not always that straight-forward to measure the period, orientation or relative intensity of each interference component.
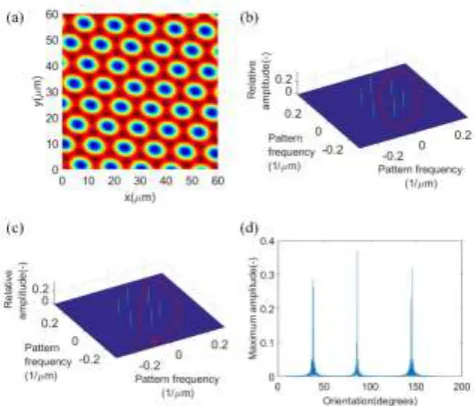
In order to extract all the interference components, the Angular Power Spectral Density (APSD) function was introduced. Fig. 1(a) is a simulated laser intensity distribution for a 3-beam interference pattern, with the laser source wavelength λ=1064 nm and the other parameters of
1 3 ,
2 4 ,
3 5 ,
1 0 ,2 120
,
3240 ,
1 2 3 0 . Fig. 1(b)3
Fig. 1 A three-beam interference pattern and APSD analysis. (a) Simulated laser intensity distribution of 3-beam laser interference. (b) APSD image of the pattern in (a). (c) The scanning process of the peaks in the APSD image. (d) The orientations of the peaks in (b).
The simulations were conducted for four interference patterns, which were all generated by three-beam interference. All the polarization angles were selected to be transverse magnetic (TM). The incident parameters are listed in Table 1 and the interference patterns Nos. 1-4 are shown in Fig. 2(a)-(d).
Table 1 Incident parameters used to generate interference patterns
No.
1
2 3 1 2 3
1 5.0 5.0 5.0 0 120 240
2 7.0 2.0 6.0 0 120 240
3 5.0 5.0 5.0 10 127 235
4 5.3 7.4 3.9 308 103 24
APSD images were used to extract the interference components for all of the interference patterns, the obtained period, orientation and relative intensity of each component are listed in Table 2.
Then the incident parameters were calculated and are shown in Table 3. It can be observed that the identification of incident parameters is accurate, the error of incident angle is smaller than 0.1˚ and the error of azimuth angle is smaller than 1˚. The results show the
effectiveness of the developed model in identifying incident parameters.
Fig. 2 Simulated results of three-beam laser interference patterns. (a)-(d) Simulated patterns corresponding to Nos. 1-4.
Table 3 Calculated incident parameters (˚)
No.
1
2 3 1 2 3
1 4.95 5.04 4.96 -0.2 119.7 239.7
2 7.08 1.98 6.01 0.1 120.1 240.7
3 4.99 5.01 5.08 9.5 127.0 235.3
4 5.26 7.41 3.93 307.9 102.9 23.9
4.
Experimental validation and discussion
[image:4.595.322.547.72.282.2]A three-beam interference system was built up using a Q-switched high-power Nd:YAG laser source with a wavelength of 1064 nm, pulse duration of 7 ns, frequency of 10 Hz, and Gaussian beam of 6 mm in diameter. Fig. 3(a) is a photograph of the laser interference lithography system and Fig. 3(b) shows the schematic diagram of the set-up. In the diagram, HR represents a high reflective mirror, BS represents a beam splitter, P and Q are polarizers and quarter-wave plates respectively. The laser source was split into three laser beams by two beam splitters. The intensity of each laser beam was adjusted by changing the
Table 2 Parameters of the interference components
No. Period (P/m) Orientation ( /) Relative intensity (I)
Peak 1 Peak 2 Peak 3 Peak 1 Peak 2 Peak 3 Peak 1 Peak 2 Peak 3
1 7.04 7.11 7.11 -90.00 -150.15 150.15 322.74 323.43 321.52
2 8.44 5.40 7.52 -105.68 -152.33 167.85 328.46 306.87 317.96
3 6.58 7.14 7.57 -147.36 158.20 90.87 426.08 280.39 189.61
[image:4.595.65.245.440.518.2] [image:4.595.77.523.670.763.2]4 angles between Q and P. In this experiment, the
intensity of each laser beam was set at 30m J/cm2 for
every pulse (monitored by a Coherent LabMax-TOP laser power and energy meter). Finally the three laser beams were focused onto the same point on the sample substrate. All the incident angles were set as 4˚ and the azimuth angles were 0˚, 120˚ and 240˚. The polarization modes were all TE. A polished silicon wafer was chosen as the sample substrate. The silicon wafer was cut and washed with ethanol and deionized water in an ultrasonic bath, and dried with nitrogen. The sample substrates were exposed for 1s (300 mJ/cm2), 2s (600
mJ/cm2) and 3s (900 mJ/cm2), respectively. After
[image:5.595.318.548.141.465.2]fabrication, the samples were measured with a Bruker Contour GT 3D optical profiler, it is a white-light interferometric microscope with a lateral resolution of 0.26 μm. The objective used in the experiment was a 50x lens. The camera in the profiler was a 640×480 standard monochrome camera.
Fig. 3 Photograph (a) and schematic diagram (b) of the three-beam laser interference system
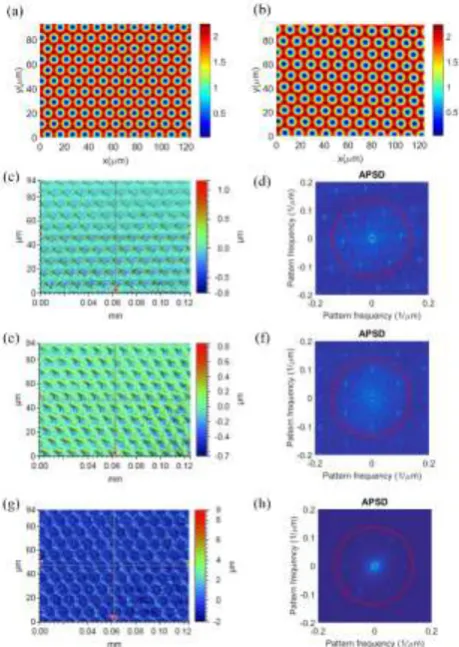
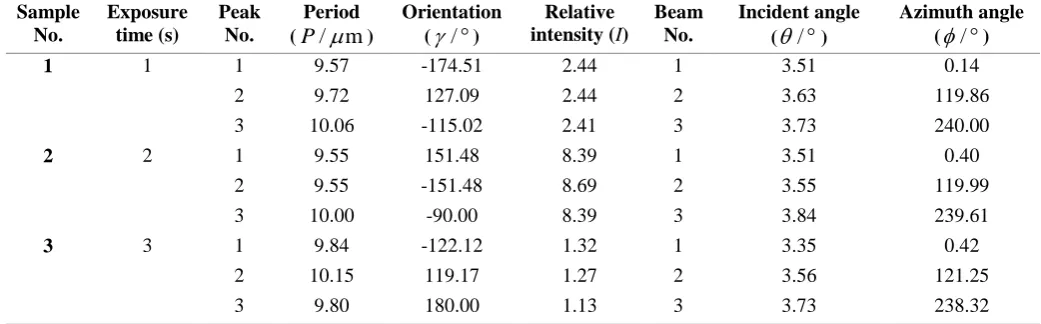
The theoretical pattern of interference intensity is shown in Fig. 4(a). The periods of the interference components were all calculated to be 8.81 μm. The orientations of the interferences were 30˚, 150˚, and 270˚. The intensities of the components were exactly all identical. Compared with the simulated laser intensity, the structures on sample surfaces shown in Figs. 4(c), (e), and (g) (exposed for 1s, 2s and 3s, respectively) have larger periods. This is mainly caused by misalignment of the incident parameters. The APSD images of the sample surfaces were generated and shown in Figs. 4(d), (f) and (h). The peaks in the circles represent the three interference components for each sample surface. After extracting the position and amplitude of the peaks the incident angle and azimuth angle of each incident laser beam was calculated and listed in Table 4. It can be observed from the results that the incident angles of laser beam Nos.1 and 2 in the three samples were all close to 3.5˚, while the incident angles of laser beam No. 3 were around 3.8˚. The calculated azimuth angles of the incident laser beams in the three samples also showed high consistency. For
incident beams the average incident angles were calculated as 3.45˚, the azimuth angles were calculated as 3.58˚, 3.77˚, and 0.32˚, 120.38˚, and 239.31˚. The simulated interference pattern using the calculated result is shown in Fig. 4(b), in which the period and distribution of the pattern is in good agreement with the experimental result.
Fig. 4 Simulated interference intensity pattern, experimental topographies and their APSD images. (a) Simulated theoretical pattern. (b) Simulated pattern using calculated parameters. (c)–(h) 3D topographies and APSD images of sample Nos. 1-3.
5.
Conclusion
[image:5.595.36.269.304.458.2]5
Table 4 Calculated incident parameters
Sample No.
Exposure time (s)
Peak No.
Period (P/ m )
Orientation (/)
Relative intensity (I)
Beam No.
Incident angle ( / )
Azimuth angle (/)
1 1 1 9.57 -174.51 2.44 1 3.51 0.14
2 9.72 127.09 2.44 2 3.63 119.86
3 10.06 -115.02 2.41 3 3.73 240.00
2 2 1 9.55 151.48 8.39 1 3.51 0.40
2 9.55 -151.48 8.69 2 3.55 119.99
3 10.00 -90.00 8.39 3 3.84 239.61
3 3 1 9.84 -122.12 1.32 1 3.35 0.42
2 10.15 119.17 1.27 2 3.56 121.25
3 9.80 180.00 1.13 3 3.73 238.32
Acknowledgement
This work was supported by Program of International S&T Cooperation (2016YFE0112100), National Key R&D Program of China (No. 2017YFB1104700) and EU H2020 Project (MNR4SCell 734174). The authors appreciate the technical support from Professor Zuobin Wang in Changchun University of Science and Technology (CUST).
References
[1] A. Y. Vorobyev and C. Guo, Laser & Photonics Reviews 7(3), 385-407 (2013).
[2] V. Lang, T. Roch and A. F. Lasagni, Advanced
Engineering Materials 18(8), 1342-1348 (2016).
[3] C. He, K. Vannahme and A. Gillner, Journal of Laser
Micro/Nanoengineering 14(1), 95-99 (2019).
[4] Y. Hu, Z. Wang, Z. Weng, M. Yu and D. Wang, Applied
optics55(12), 3226-3232 (2016).
[5] D. G. Kim, S. H. Kim, H. C. Ki, T. U. Kim, J. C. Shin and Y. W. Choi, Optical and Quantum Electronics 50(9), 347 (2018).
[6] B. H. Luo, P. W. Shum, Z. F. Zhou and K. Y. Li, Surface
and Coatings Technology204(8), 1180-1185 (2010).
[7] J. Wang, L. Gao, Y. Li and B. Liu, Lasers in medical
science32(1), 221-227 (2017).
[8] J. W. Leem, S. Kim, S. H. Lee, J. A. Rogers, E. Kim and J. S. Yu, Advanced Energy Materials4(8), 1301315 (2014). [9] M. Gedvilas, S. Indrišiūnas, B. Voisiat, E. Stankevičius, A. Selskis and G. Račiukaitis, Physical Chemistry Chemical
Physics20(17), 12166-12174 (2018).
[10] J. Xu, Z. Wang, Z. Zhang, D. Wang and Z. Weng,
Journal of Applied Physics115(20), 203101 (2014).
[11] L. Hao, Y. Kai, L. Yan-Yan, G. Dong, Z. Qiu-Ling and
W. Xia, ACTA PHYSICA SINICA66(21), 217801 (2017).
[12] R. Guo, D. Yuan and S. Das, Journal of micromechanics
and microengineering21(1), 015010 (2010).
[13] M. N. Liu, L. Wang, Y. H. Yu and A. W. Li, Optical
Materials Express7(7), 2208-2217 (2017).
[14] X. Ning, Q. Meng, L. Li, Y. Han, D. Zhou, L. Cao, Z.
Weng, R. Ding and Z. Wang, In Manipulation,
Manufacturing and Measurement on the Nanoscale
(3M-NANO), 2017 IEEE International Conference on (pp.
375-378), IEEE, (2017).
[15] B. Voisiat, M. Gedvilas, S. Indrišiūnas and G. Račiukaitis, Physics procedia 12, 116-124 (2011).
[16] M. Bieda, M. Siebold and A. F. Lasagni, Applied Surface
Science 387, 175-182 (2016).
[17] D. Yuan, R. Acharya and S. Das, Applied Physics Letters
103(22), 223101 (2013).
[18] D. Wang, Z. Wang, Z. Zhang, Y. Yue, D. Li and C. Maple, Applied physics letters102(8), 081903 (2013). [19] T. Tavera, N. Pérez, A. Rodríguez, P. Yurrita, S. M. Olaizola and E. Castano, Applied surface science 258(3), 1175-1180 (2011).
[20] D. Wang, Z. Wang, Z. Zhang, Y. Yue, D. Li, R. Qiu and C. Maple, Journal of Applied Physics115(23), 233101 (2014). [21] C. Tan, C. S. Peng, V. N. Petryakov, Y. K. Verevkin, J. Zhang, Z. Wang, S. M. Olaizola, T. Berthou, S. Tisserand and
M. Pessa, New Journal of physics10(2), 023023 (2008). [22] M. Yu, C. Tan, Z. Wang, L. Zhao and W. Li, In
Manipulation, Manufacturing and Measurement on the Nanoscale (3M-NANO), 2013 International Conference on
(pp. 74-77), IEEE, (2013).