Classification of Data by Hybrid Particle Swarm
Optimization and Gravitational Search Algorithm
Vijita Nair
M. Tech. Scholar
Dept of Computer Science
Oriental College of
Technology
Kavita Barse
Director
Oriental College of Technology
Bhopal (M.P) India
Vivek Kumar
M. Tech Coordinator
Oriental College of Technology
Bhopal (M.P) India
ABSTRACT
The problem of classification is may be one of the greatest colossally considered in the data mining and in intelligent retrieval system. The classifications tasks have been studied by researchers from several domains from decades. . PSOGSA based data classification can also be apply, might yield more efficient and promising results , in proposed work which, possesses classification of standard data using gravitational search algorithm with optimize manner .So classification of data done by the famous widely used method Feed forward neural network with gravitational search algorithm Particle swarm optimization is a popular heuristic algorithm that had been applied on many optimization problems over the years including data classification problem This modified PSO is combined with gravitational search algorithm to solve its slow Execution time in the last iterations, making the hybrid PSOGSA algorithm
Keywords
Gravitational search algorithm, Particle swarm optimization
1.
INTRODUCTION
Now a day, making intelligent and smart equipment through expert systems is predominantly innovative concepts for present research [11]. Therefore exploring expert system with the help of data mining and its learning algorithms has lots of scope for research work. In machine learning, the extraction of meaningful data and classifying bulk data is comparatively better for producing precise, speedy and straight forward results and hence among several methods of expert systems, selected technique has been classification. Machine learning symbolizes transformation in the ideology that is flexible in a way that they enable the system to do the same work more productively the next time. In past years many successful intelligent retrieval applications have been developed, reaching from data mining platform that learn user reading preferences to autonomy. Intelligent retrieval system is also utilized in various fields of real life application like, statistics, artificial intelligence, biology, cognitive science, computational complexity and control theory, medical, finance, engineering, aeronautic , philosophy, information theory.
Data classification is a branch of Artificial Intelligence and has verified itself very useful in developing a content-based image recovery system. For classifying the data an imperative role is played by data classification. Data categorization is basically an attempt of labeling a class to the suitable identifiers. It’s essential to specify area of concern for the creation of identifiers. This requirement can be comprehensive, like considering arbitrarily taken pictures (say, the ones from the internet) for the classification, may limit to some specific domains, like medical images or geographical images (remotely sensed images).Image tagging
[image:1.595.324.536.243.393.2]is a kind of image annotation, in which includes labeling or indexing the image in semantic manner[1].
Figure 1 Example of Classification [2].
The definition of classification according to charu C Agrawal [1] is
Given a pair of training data points along with associated training labels, determine a class label for an unlabeled test instance.
So, several variations of classification problem may be defined over different parameters. Some extraordinary indications on data sorting may be found in [3]. Classification algorithms typically contain two phases:
• Training Phase: It’s a phase, where a model is primed from the training samples.
• Testing Phase: This phase has the model which is used to entrust a label to an unlabeled test instance.
The output of a classification algorithm may be presented for a test instance in one of two ways:
1. Discrete Label: In this a label is given for every test instances.
2. Numerical Score: For each class label and test instance combination a numerical value is given.
35
2.
LITERATURE SURVEY
.Some of the conventional systems used in data classification are decision trees, rule-based methods, probabilistic methods, SVM methods, instance-based methods, and neural networks.
2.1. Decision Tree
.In Decision tree based on feature values the instances are sorted and classified. In Decision tree each node contains the characteristic of instances which is needed to be classified and each branches holds a value assumed by each node. Sorting is done from the root node depending on feature values. Training data is sorted by root node which holds the best feature value. There are various ways for finding the characteristic that excellently splits the preparing data for instance, information gain and gini index. Though, a bulk of studies has presumed that there’s no single best method. Comparison of individual methods may still be important when deciding which metric should be used in a precise dataset. The similar process is then recursively applied on every division of the distributed data, which results in the creation of sub-trees as far as the training data is dislocate into subsets of the similar class In order to avoid the issue of over fitting training data two ordinary way that decision tree algorithms can apply, First option is to end the training algorithm before it reaches a point at which it absolutely fits the training data and the Second option is where the induced tree can be snipped. If the experiment incorporated by the two trees are similar and are contains the mirror or similar correctness in calculation, then the tree with the lesser leaves is generally considered fuzzy topology method hence we can say that the Decision trees are trees that categorize instances by sorting them based on feature values.
2.2. Single Layered Perceptron
A single layered perceptron in brief describe as follow: If input feature values are from 𝑥1 to 𝑥𝑛 and connection weights
are from 𝑤1 to 𝑤𝑛 (normally real numbers in the interval of
[-1, 1]),then perceptron calculate the sum of weighted inputs 𝑥𝑖 𝑖 𝑤𝑖 and output goes through an adjustable threshold: if
the sum is above threshold, output is 1; otherwise result is 0 The generic way where this algorithm is utilized for learning from a batch of training instances is to execute the algorithm recursively through the training set until it explores a prediction vector which holds true for the entire training set [10]. This forecast instruction is then used for predicting the labels on the test set is used for learning from a batch of training instances Hence as mentioned above that the way where we can use this algorithm for learning from a batch of training instances is to execute the algorithm again and again through the training set until it explores a prediction vector which holds true for the entire training set. Now, to sum up, we have discussed perceptron-like linear algorithms with focuses on their superior time complexity when dealing with irrelevant features. This can be a achievement or we can call it the advantage when there are many features, but only a few relevant ones.
2.3. Probabilistic Methods
.Probabilistic methods are the most fundamental among all data classification methods. Statistical interference is a method used to discover the best class for any instances in Probabilistic classification algorithm. In accumulation of merely passing on the best class like other categorization algorithms, probabilistic classification .Algorithms will yield a equivalent posterior probability of the experiment instance being a part of each of the likely classes. Bayesian network (BN) is a directed acyclic graph for probability relationships
among a set of variables (features). It is used to establish one –to-one communication between the nodes. In Bayesian network the arcs correspond to casual influences among the features also the unavailability of possible arcs in Bayesian network encodes conditional independencies. The working of the Bayesian network can be understood by focusing upon two important things first DAG structure and second determine the parameters. By learning the conditional independence relationships between the features of a dataset one can easily know the structure of BN and apply these correlations as constraints to create a BN.
2.4. Statistical Learning Algorithms
Statistical accesses are not only known for its classification techniques but are also characterized by having a clear underlying probability model, which gives a possibility that an instance belongs in each class. Two simple methods are used in statistic and in expert system to know the linear combination of features that can excellently detach two or more classes of object, they are Linear discriminant analysis (LDA) and the related Fisher's linear discriminant methods. In 1999, Mika proposed an equivalent technique to LDA to deal with categorical variables because LDA works only when the measurements made on each observation are continuous quantities. Another one of the common method used to estimate probability distribution from data is Maximum entropy. One of the most important principles in this method is overriding principle which states that distribution should be uniform as much as possible unless and until we get required or known values. Statistical learning algorithms are excellently represented by Bayesian Network. [6].
2.5. Rule-Based Methods.
Rule-based methods are strongly correlated to decision trees, except that they do not create a strict hierarchical partitioning of the preparation data. Rather, overlaps are allowed in order to create greater robustness for the training model. In decision tree any path is considered as rule which assign a test example to a particular label. Compare to decision tree Rule-based classifiers is seen as more general models. In decision trees induced rule sets are used for non-overlapping, while rule-based classifiers create rules that probably conflict with additional to one another for a specific test instance. Therefore, it is significant to design methods that can effectively determine a resolution to these conflicts. The method of resolution depends upon, whether the rule sets are ordered or unordered. If the rule sets are ordered, then the top matching conventions can be used to make the prediction. If the convention sets are unordered, then the rules can be used to vote on the test instance.
2.6. Svm Classifiers
.Figure 2: Hyper planes separating the two classes.[2]
As shown in the above figure both the hyperplanes separate the given training examples. The hyperplane on the right hand side has larger margin and hence is expected to give better generalization is the optimal separating hyperplane. When the number of variables is small, it can solve using Quadratic Programming technique.
2.7. Cart As Classification Method
.This is very important even for analyzed dependencies of known nature where researchers are able to set up some a priori functional forms and becomes extremely important while performing explorative data mining of complex high dimensional structures. When no data structure hypotheses are available, non-parametric analysis becomes merely the single effective data mining tool. Moreover, when building such a model one should not make any additional assumptions concerning model errors distribution which becomes a substantial obstacle when sample errors distribution does not match the required one [4].CART algorithm will itself identify the most significant variables and eliminate non-significant ones. To test this property, one can include insignificant variable and compare the new tree with tree, built on initial dataset. Both trees should be grown using the same parameters splitting rule and N parameter) [4]. This means that from a given subset of variables constituting a learning sample CART will automatically select the most significant ones in some sense. Hence even if learning sample holds some irrelevant information due to e.g. measurement errors or misspecification, the model will choose correct splits by itself and hence account for disturbances automatically [4].
2.8. Neural Network Based Classification.
Artificial neural network (ANN) is also referred as simply "Neural Network" (NN) that is a process model supported as biological neural networks. They consist of an interconnected collection of artificial neurons. An artificial neural network is an adjective system that changes its structure supported information that flows through the artificial network during a learning section. In NN it is tried to find the parameters which minimizes the mean square error prediction error with respect to a set of training examples. This is done by using stochastic gradient descent optimization (a method for minimizing an objective function that is written as a sum of differentiable functions). The training of the neural networks and statistical classifiers is done on the basis of the Empirical Risk Minimization principle in which the training phase is aimed at achieving the minimum of the error rate on a given training set [9]. The ANN is based on principle of learn by example. There are, however the 2 classical types of the neural networks, perceptron and also the multilayer perceptron, where we target to execute the perceptron algorithm. The basic concept of perceptron algorithm is to determine a linear function for the feature vector f(x) = wT x + b, resulting f(x) > 0 for the vectors of one category [27], and f(x) < 0 for the vectors of another. The vector w = (w1, w2…wm) is the vector of the coefficients (weights) for the function, and the supposed bias is b. If we denote the
categories as +1 and -1, then we can state that it is required to find a decision function d(x) = sign (wT x + b). The algorithm of perceptron learning is completed iteratively. This starts with at randomly chosen parameters (w0, b0) for the decision and iteratively, updates them. In the nth iteration of the rule the training sample (x, c) is so chosen that the decision function is not able classify the sample properly (i.e. sign (wn x + bn)! = c). Then, the parameters (wn, bn) are updated using the following rule:
wn+1 = wn + cx
bn+1 = bn+ c
This algorithm is stopped when such a decision function is found that classifies all training samples correctly.
2.9. Evolutionary Algorithms For
Classification.
PSO is too a population-based stochastic optimization technique and is well adapted to the optimization of nonlinear functions in multidimensional space. It models the social activities of bird flocking or fish schooling... PSO is successfully applied in solving several real-entity based problems thus it became popular in the field of research several real-world problems [14].In PSO, a group of particles works by moving around in search domain by updating their current position and velocity as well following the current optimum particle. The position of a particle gives the possible solution which needs to be optimized. It provides the fitness of each particle after optimization. Based best solution of current particle achieved so far (particle best) and the best of the population (global best) the current position and velocity of each particle is updated. In search space, population of particles try to find best particle among themselves and based on the information so far obtained after each iteration they will get a local best solution. Now the particle starts moving towards good area in the search space by spreading information to the swarm [12].
3.
DATA STREAM DISCUSSION
37 have to be appropriately modified so that aforementioned
challenges can be address.
4.
EVALUATING
CLASSIFICATION
ALGORITHM
.To classify the data the prominent parameter that is passed is that of estimation of classification algorithms. Two primary parameters that arise in the evaluation process are as below described:
Methodology used for evaluation: Classification algorithms require a training stage and a testing stage, in which the test examples are cleanly divided from the training data. Various tactics are possible, such as hold out, bootstrapping and cross-validation, out of that the first is the simplest to implement, and the last provides the ultimate accuracy of implementation [8].In the hold-out approach, a stable proportion of the training examples are “held out,” and not used in the training. Quantification of accuracy: This is deals with the dilemma of quantifying the error of a classification algorithm. At first sight, it would seem that it is most beneficial to use a degree for instance the absolute classification accuracy, which directly computes the portion of examples that are correctly classified
5.
EXPERIMENTAL RESULT
[image:4.595.319.539.69.223.2]It gives the description of how the proposed work overcomes the problems of the recent classification schemes. It tells about the contribution of particle swarm optimization to the feed forward neural Network and how the gravitational search algorithm adds to its efficiency.
Table 1. Comparison of efficiencies of various dataset.
Data Classificatio n Methods
Iris Dataset Classificatio n
Efficiency (%)
Cuckoo Dataset Classificatio n efficiency (%)
Random Dataset Classificatio n efficiency (%)
FNN-PSO 95.4% 95.2% 95.2%
FNN-GSA 96.4% 95.3% 95%
FNNGSA-PSO
99.4% 98% 97%
Here Iris dataset is classified using FNN-PSO, FNN-GSA and then classification result is compared with proposed methodology FNNGSA-PSO, whose efficiency is found better than PSO & GSA alone for the classification of data.
Following table shows the efficiencies of different algorithm used for data classification .Proposed algorithm is also used to classify cuckoo dataset and some randomly selected dataset.
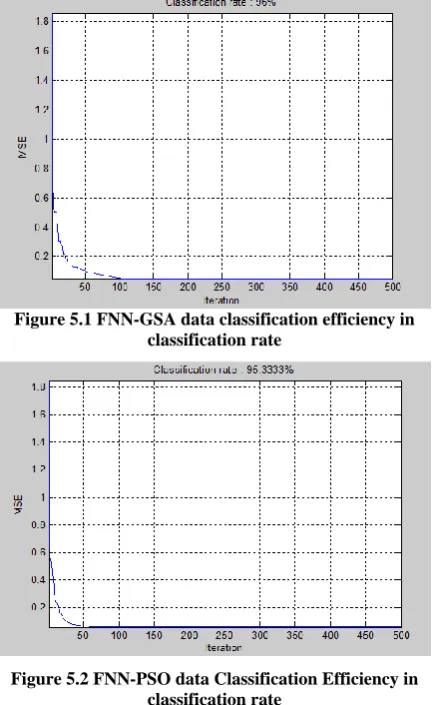
[image:4.595.321.539.73.426.2]Through this table it’s clear that the proposed algorithm shows the efficiency of 99% for classification of dataset. Dataset used here such as Iris dataset which is classified using two different algorithms and some of the randomly selected dataset like cuckoo dataset ,glass dataset are also classified.. Proposed algorithm used here is the hybrid of PSO & GSA . There performance for classification of data is shown graphafically below:
Figure 5.1 FNN-GSA data classification efficiency in classification rate
Figure 5.2 FNN-PSO data Classification Efficiency in classification rate
Figure 5.3 FNN-PSO-GSA data Classification Efficiency in classification rate
6.
CONCLUSION
. [image:4.595.320.537.450.613.2]to control dimensionality. The kernel mapping provides a common base for most of the commonly employed model architectures, enabling comparisons to be performed. In classification problems generalization control is obtained by maximizing the margin, which corresponds to minimization of the weight vector in a canonical framework
The proposed work is effective and efficient; however, in the future work more exploration of different types of the classification methods that can be applied with the fuzzy topological space will be done. The different methods for the determination of the threshold value will be carried out. As future works, plan to improve the early stopping approach, still based on the GL5 stop criteria, to permit a more exploration of the search space for the PSO optimizers without losing control of the generalization capability of the trained models with support vector machine.
7.
REFERENCES
[1] Charu C. Agrawal, “Data Classification: Algorithms and Applications”, CRC Press, Taylor and Francis Group.2014.
[2] Pheyedali Miraajalili, Siti Kaiton Mohd Washim, "A New Hybrid FNN-GSA Algorithm for Function Optimization", IEEE, International Conference on Computer and Information Application (ICCIA 2013) [3] Wenzhong Shi, Kimfung Liu, Hua Zhang, “A study of
supervised classification accuracy in fuzzy topological
methods,” International Journal of Applied Earth Observation and Geo information, vol.13,pp. 89-99,2011.
[4] Dean, Jeffrey, and Sanjay Ghemawat. "Map Reduce: a
flexible data processing tool." Communications of the ACM 53.1, pp. 72-77, 2010.
[5] Yu, Lean, et al. "Evolving least squares support vector
machines for stock market trend mining." IEEE Transactions on evolutionary computation 13.1, pp. 87-102, 2009.
[6] C. Aggarwal. “Data Streams: Models and Algorithms”, Springer, vol. 31, 2007.
[7] H. Peng, F. Long, and C. Ding. “Feature selection based on mutual information: Criteria of max dependency, max-relevance, and min-redundancy”, IEEE Transactions on Pattern Analysis and Machine Intelligence, 27(8), pp. 1226–1238, 2005.
[8] N. V. Chawla, N. Japkowicz, and A. Kotcz. Editorial: Special Issue on Learning from Imbalanced, pp 1-6, 2004.
[9] N. V. Chawla, N,” Data Sets”, ACM SIGKDD Explorations Newsletter, 6(1):1–6, 2004.
[10]R. Duda, P. Hart, and D. Stork, “Pattern Classification” Wiley, pp 20- 25, 2001.
[11]Kludack Ruggerie, Aleix M. MartõÂnez, and Avinash C. Kak, “PCA versus LDA”, IEEE, 2001.
![Figure 1 Example of Classification [2].](https://thumb-us.123doks.com/thumbv2/123dok_us/9299360.428313/1.595.324.536.243.393/figure-example-of-classification.webp)
![Figure 2: Hyper planes separating the two classes.[2]](https://thumb-us.123doks.com/thumbv2/123dok_us/9299360.428313/3.595.63.275.70.156/figure-hyper-planes-separating-classes.webp)