Implementation of Web-based Analytic Network Process
for Highway Maintenance Planning
Noldy Sinsu
Department of Information System
Diponegoro University Semarang – Indonesia
Eko Sediyono
Department of Information System
Satya Wacana Christian University Salatiga – Indonesia
Aris Puji Widodo
Department of Informatics Diponegoro University Semarang – Indonesia
ABSTRACT
The Maintenance of highway as an important role in the reliability of the conditions can be affected positively the economic sector, government, and society. which will be the priority of highway maintenance planning is to pay attention to the supporting parameters standards that affect the highways segment. These parameters as a variable in Analytic Network Process method. In this research, the first step is to identify problems, data collection, form parameters, data processing parameters before to the next step of the ranking process. After grouping the highway segment, the next step is assessing its highway segment using Analytic Network Process (ANP) method. The results of the ranking process are stored into the database and then represented by displaying the graphs and tables. The final result of the information shows the rankings 27 highways and the result of the accuracy of 80% of the system results. And field data that are shown from one national highway and five provincial highways. From the test results, the system is able to provide information about highway maintenance that will be a priority ranking which one the top list that needed to be maintenance.
General Terms
Method Analytic Network Process
Keywords
Analytic Network Process (ANP), Maintenance, Highway, Web-Based and ANP
1.
INTRODUCTION
The availability and the reliability of highway conditions will positively affect the economic sector, government, and society. The highways have an important role in realizing the national development so that people need the comfort and smoothness of highway facilities in carrying out daily activities [1]. There is the close relationship between highways transport and economic development because strong economics foundation provides stabilization in highway transport demand and also affects the economic development. An adequate highway can provide the comforts for its users. many highways are unrecognizable because of the absence the construction or the regular maintenance [2]. Therefore, it is necessary to excellent handlings, such as highways maintenance or highways improvement, it is intended that the highway conditions will be in accordance with the planned age of highways [5].
ANP methods have been widely used for various qualitative studies, such as decision making, forecasting, strategizing, mapping, evaluations, resource allocation and so on. To assist decision-makers in evaluation and synthesis any number of factors in the hierarchy or network [4], in general in prioritizing decision problems using a network approach without setting the level [3]. As a multi criteria
decision-maker with a decision-making approach appropriately related to the selection of transport infrastructure projects [7], the overall risk priority of the project supply network is to initiate a timely mitigation strategy against the cost consequences and the timing significance of the risk of major project performance steps [10].
In this study, the focus of the problem is maintaining the highway. This is because of the highway as a media that liaison one and another location and the highway maintenance process needed some criteria that must be considered to the smoothness of the highway maintenance itself, ie, highway conditions, volumes traffic, economics and land use. Minister of Public Works adopted the government regulation [5]. The scope of arrangements in ministerial regulations includes technical requirements and maintenance technical criteria of highway that applied to the national highways, provincial highways, district highways, and the urban highways [5]. The study was conducted using the ANP method to determine road maintenance based on roadside ranking results against its criteria [6], [7], and using a web-based system to facilitate access intended to provide information on road projects in detail, informative and accessible by the community [11], the web-based system is also used to categorize and analyze incident addressing [11], the web-based system facilitates online access, image visualization, and analysis, as well as additional data and maps [13]. The researcher chose ANP as a multi criteria ranking method, therefore assumption and justification theories based on assumptions, and can assist decision-making involving multiple decision makers [8], [9]. The main criterion will require the adoption of multi criteria of decision making so that it can provide a reference for planning the maintenance of Semarang City highway for the future.
2.
METHODOLOGY
2.1. Data Collection
The data that used is data obtained from 27 roads, which is spread into 6 national road segments and 21 provincial road segments in Semarang city.
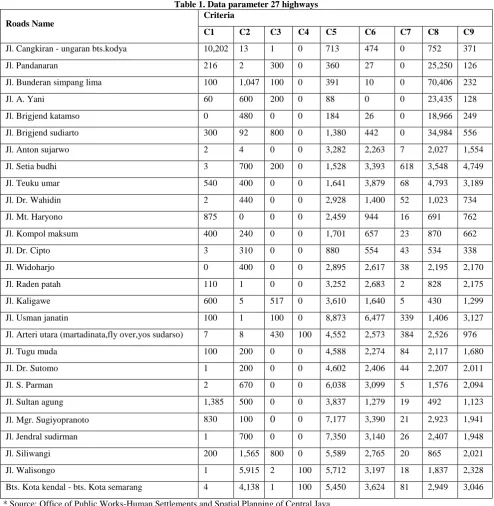
Data criteria were taken 27 roads segment (Table 1 and Table 2), the criteria as follows:
[1] Road condition consisting of C1 is a good road, C2 is a medium road, C3 is a damaged road, C4 is a heavy damaged road,
[2] traffic volume consisting of C5 is alightweight truck, C6 is a medium truck, C7 is a heavy truck, C8 is BUS, C9 is a car, C10 is a motorcycle,
[3] C11 is the economy (road maintenance fund),
[image:2.595.51.546.174.681.2]Land use consisting of C12 is agriculture, C13 is education field, C14 is the socio-cultural, C15 is trade and service.
Table 1. Data parameter 27 highways
Roads Name
Criteria
C1 C2 C3 C4 C5 C6 C7 C8 C9
Jl. Cangkiran - ungaran bts.kodya 10,202 13 1 0 713 474 0 752 371
Jl. Pandanaran 216 2 300 0 360 27 0 25,250 126
Jl. Bunderan simpang lima 100 1,047 100 0 391 10 0 70,406 232
Jl. A. Yani 60 600 200 0 88 0 0 23,435 128
Jl. Brigjend katamso 0 480 0 0 184 26 0 18,966 249
Jl. Brigjend sudiarto 300 92 800 0 1,380 442 0 34,984 556
Jl. Anton sujarwo 2 4 0 0 3,282 2,263 7 2,027 1,554
Jl. Setia budhi 3 700 200 0 1,528 3,393 618 3,548 4,749
Jl. Teuku umar 540 400 0 0 1,641 3,879 68 4,793 3,189
Jl. Dr. Wahidin 2 440 0 0 2,928 1,400 52 1,023 734
Jl. Mt. Haryono 875 0 0 0 2,459 944 16 691 762
Jl. Kompol maksum 400 240 0 0 1,701 657 23 870 662
Jl. Dr. Cipto 3 310 0 0 880 554 43 534 338
Jl. Widoharjo 0 400 0 0 2,895 2,617 38 2,195 2,170
Jl. Raden patah 110 1 0 0 3,252 2,683 2 828 2,175
Jl. Kaligawe 600 5 517 0 3,610 1,640 5 430 1,299
Jl. Usman janatin 100 1 100 0 8,873 6,477 339 1,406 3,127
Jl. Arteri utara (martadinata,fly over,yos sudarso) 7 8 430 100 4,552 2,573 384 2,526 976
Jl. Tugu muda 100 200 0 0 4,588 2,274 84 2,117 1,680
Jl. Dr. Sutomo 1 200 0 0 4,602 2,406 44 2,207 2,011
Jl. S. Parman 2 670 0 0 6,038 3,099 5 1,576 2,094
Jl. Sultan agung 1,385 500 0 0 3,837 1,279 19 492 1,123
Jl. Mgr. Sugiyopranoto 830 100 0 0 7,177 3,390 21 2,923 1,941
Jl. Jendral sudirman 1 700 0 0 7,350 3,140 26 2,407 1,948
Jl. Siliwangi 200 1,565 800 0 5,589 2,765 20 865 2,021
Jl. Walisongo 1 5,915 2 100 5,712 3,197 18 1,837 2,328
Bts. Kota kendal - bts. Kota semarang 4 4,138 1 100 5,450 3,624 81 2,949 3,046
* Source: Office of Public Works-Human Settlements and Spatial Planning of Central Java
Table 2. (Continued)
Roads Name
Criteria
C10 C11 C12 C13 C14 C15
Jl. Cangkiran - ungaran bts.kodya 7,847 16,750,000,118 10 20 0 30
Roads Name
Criteria
C10 C11 C12 C13 C14 C15
Jl. Bunderan simpang lima 124,526 2,065,858,000 23 11 7 40
Jl. A. Yani 67,967 3,065,858,000 12 20 8 35
Jl. Brigjend katamso 55,887 2,340,000,000 10 60 10 27
Jl. Brigjend sudiarto 79,003 2,340,000,000 9 30 7 20
Jl. Anton sujarwo 487 4,110,707,000 30 35 0 25
Jl. Setia budhi 2,432 4,913,772,000 25 27 20 20
Jl. Teuku umar 1,862 9,000,028,000 10 20 15 35
Jl. Dr. Wahidin 766 4,636,500,000 8 25 17 25
Jl. Mt. Haryono 963 4,122,705,000 9 19 0 0
Jl. Kompol maksum 342 4,701,513,000 20 20 18 30
Jl. Dr. Cipto 368 4,689,641,000 60 10 16 35
Jl. Widoharjo 874 8,800,023,000 30 11 25 27
Jl. Raden patah 372 4,748,883,000 35 15 20 20
Jl. Kaligawe 148 7,215,030,000 27 20 28 17
Jl. Usman janatin 1,903 8,130,599,000 20 27 15 14
Jl. Arteri utara (martadinata,fly over,yos sudarso) 64 4,642,960,000 17 30 0 15
Jl. Tugu muda 763 4,501,894,000 14 20 10 10
Jl. Dr. Sutomo 1,958 1,730,730,000 15 9 25 11
Jl. S. Parman 1,155 1,734,241,000 20 30 20 0
Jl. Sultan agung 172 4,714,330,000 27 25 8 30
Jl. Mgr. Sugiyopranoto 625 4,793,957,000 30 10 10 25
Jl. Jendral sudirman 597 6,174,118,000 20 8 0 10
Jl. Siliwangi 500 3,900,898,000 25 15 15 25
Jl. Walisongo 174 5,411,511,000 30 20 20 0
Bts. Kota kendal - bts. Kota semarang 1,428 7,106,814,000 40 21 0 10
* Source: Office of Public Works-Human Settlements and Spatial Planning of Central Java
2.2.
Research Step
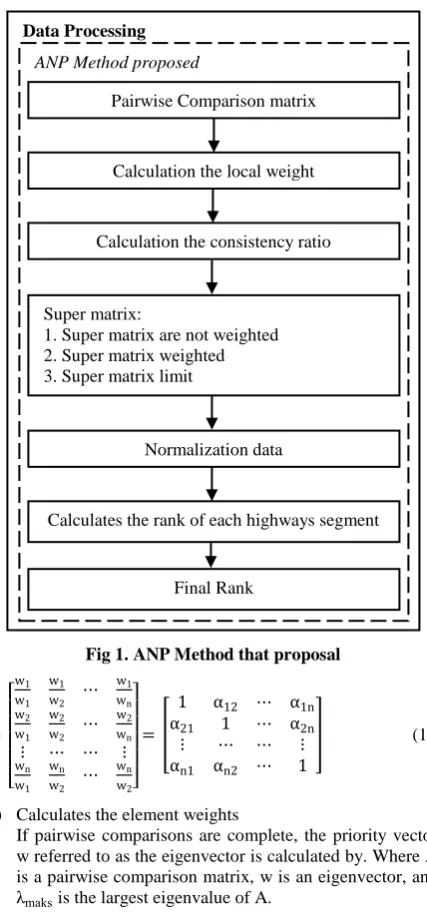
The research steps are problem identification, data collection, parameter formation, and data processing parameters. Data modeling is a step that must be completed first before doing the next process, which needs to be considered in the data modeling step is the classification of data that has been collected into criteria for the ANP process.
The next step is coding PHP programming language with the steps as follows:
a) Develop problem structures and develop linkage models Criteria control, and determine alternative options. If there are elements that have the equivalent quality then grouped into a similar component.
b) Forming pairwise comparison matrix
ANP assumes that the decision maker must make a comparison of interests between all elements for each level in pairs. The comparison is transformed into the matrix form A. Value represents the relative importance value of the element on the line to -i against
the elements in the column to -j. for example . If
Fig 1. ANP Method that proposal
(1)
c) Calculates the element weights
If pairwise comparisons are complete, the priority vector w referred to as the eigenvector is calculated by. Where A is a pairwise comparison matrix, w is an eigenvector, and
is the largest eigenvalue of A.
The eigenvector is the priority weight of a matrix which is then used in the preparation of super matrix.
(2)
d) Calculates the consistency ratio
Consistency has two meanings, the first is similar objects can be grouped according to uniformity and relevance. Second, it concerns the level of relationship between objects based on certain criteria. In making decisions, it is important to know how good the consistency is. Therefore it is necessary to check the value of consistency by using a random index list (RI) which can be seen in Table 2. Consistency ratio should be worth 10 percent or less. If the value is more than 10 percent, then the assessment of decision data should be corrected. In practice, such consistency is not possible. In the consistency matrix, practically whereas in the matrix, not every variation of will bring changes to the value . Deviation from n is a consistency index parameter as follows.
-
- (3)
Where CI is the consistency index, is the value eigen greatest, and n is the number of elements that are compared. By comparing CI and RI there is a benchmark for determining the consistency level of a matrix, called the Consistency Ratio (CR). To calculate the consistency ratio is used the following equation.
(4)
[image:4.595.325.537.231.748.2]Where CR is the consistency ratio, CI is the consistency index, and RI is the random index. Table 3. shows the size of the matrix and the random index value that can be used as a benchmark to determine the consistency level of a matrix [7].
Table 3. Random Index Value
Matrix Size Value
1 0
2 0
3 0.5247
4 0.8816
5 1.1086
6 1.2479
7 1.3417
8 1.4057
9 1.4499
10 1.4854
11 1.514
12 1.5365
13 1.5551
14 1.5713
15 1.5838
16 1.5978
17 1.6086
18 1.6181
19 1.6265
20 1.6341
21 1.6409
22 1.647
23 1.6526
24 1.6577
25 1.6624
26 1.6667
27 1.6706
28 1.6743
29 1.6777
30 1.6809
Data Processing
ANP Method proposed
Pairwise Comparison matrix
Calculation the local weight
Calculation the consistency ratio
Super matrix:
1. Super matrix are not weighted 2. Super matrix weighted 3. Super matrix limit
Normalization data
Calculates the rank of each highways segment
If the value of CR = 0 then a comparison matrix can be said to be co te t f CR ≤ 0.1 the the tr x qu te co te t and if CR> 0.1 then it is said to be very inconsistent [6].
e) Making Supermatrix
Super matrix are the result of eigenvectors of a pairwise comparison matrix between clusters, criteria, and alternatives. Assuming a system has an N cluster in which elements in each cluster interact or have an effect on some or all of the existing clusters. If the cluster is denoted with ch where h = 1,2, ... , N with as many elements denoted as eh1 eh eh h. The effect of one element in a cluster on another element in a system can be recipe toned by a ratio-scale eigenvector taken from a pairwise comparison matrix.
f) The final stage of the ANP method in which the rank of each criterion is obtained by calculating the final weight of each criterion. There are three kinds of weights that will be calculated that is raw weight, normal weight, and weight idea. The raw weight will be calculated by summing every normalized line of super matrix limit, while the normal weight is calculated by dividing the highest value by the number of criteria. So that the ideal weight hung by dividing the value of the normal weight with the highest value of the normal weight, then we get the highest weight of the ideal weight of one (1).
3.
RESULT AND ANALYSIS
To achieve the research objectives discussed earlier, there are several steps that must be done. The stages are divided into several processes including, evaluation criteria that are part of data modeling to determine criteria to be used in ANP, comparisons of pairwise comparisons between criteria form the criteria matrix, data normalization, eigenvalue calculation, calculation of largest eigenvalue ( ), testing consistency ratio, super matrix calculation, and ranking.
3.1.
Application of Analytical Network
Process
The process of applying the ANP is the weighting of the 15 criteria used to calculate the matrix of pairwise comparisons, data normalization, the calculation of eigenvalues, the calculation of the largest eigenvalues ( ), the consistency ratio test, and the super matrix calculations (unweighted super matrix, super matrix weighted, and super matrix limits) determination of raw weights, normal weight and ideal weight of each priority road segment.
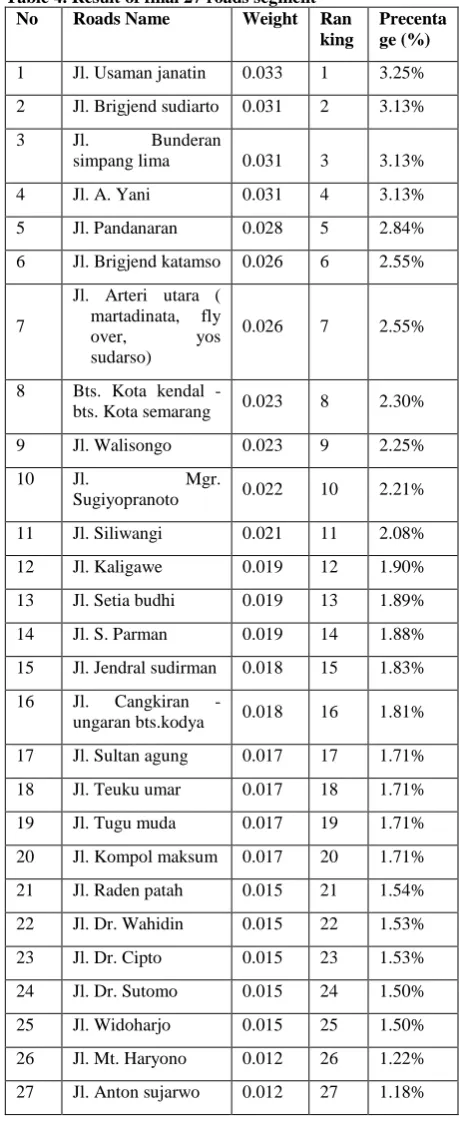
[image:5.595.313.543.79.641.2]The final step of applying ANP method is to determine the rank of each segment by calculating the final weight of each criterion. Where the weight to be used in the calculation process consists of raw weights, normal weight, and ideal weight. For calculation of raw weights done by summing every line of normalized super matrix limit. Furthermore, in calculating the normal weight is done by dividing the value of the raw weights by the number of criteria. Then the calculation of the ideal weight is calculated by dividing the normal weight value with the highest value of the normal weight so that the highest value of the ideal weight = 1. The roads segment that gets the value = 1 on the ideal weight is the roads segment that will be a priority in maintenance planning. The ranking results are shown in Table 4.
Table 4. Result of final 27 roads segment
No Roads Name Weight Ran
king
Precenta ge (%)
1 Jl. Usaman janatin 0.033 1 3.25%
2 Jl. Brigjend sudiarto 0.031 2 3.13%
3 Jl. Bunderan
simpang lima 0.031 3 3.13%
4 Jl. A. Yani 0.031 4 3.13%
5 Jl. Pandanaran 0.028 5 2.84%
6 Jl. Brigjend katamso 0.026 6 2.55%
7
Jl. Arteri utara ( martadinata, fly
over, yos
sudarso)
0.026 7 2.55%
8 Bts. Kota kendal -
bts. Kota semarang 0.023 8 2.30%
9 Jl. Walisongo 0.023 9 2.25%
10 Jl. Mgr.
Sugiyopranoto 0.022 10 2.21%
11 Jl. Siliwangi 0.021 11 2.08%
12 Jl. Kaligawe 0.019 12 1.90%
13 Jl. Setia budhi 0.019 13 1.89%
14 Jl. S. Parman 0.019 14 1.88%
15 Jl. Jendral sudirman 0.018 15 1.83%
16 Jl. Cangkiran -
ungaran bts.kodya 0.018 16 1.81%
17 Jl. Sultan agung 0.017 17 1.71%
18 Jl. Teuku umar 0.017 18 1.71%
19 Jl. Tugu muda 0.017 19 1.71%
20 Jl. Kompol maksum 0.017 20 1.71%
21 Jl. Raden patah 0.015 21 1.54%
22 Jl. Dr. Wahidin 0.015 22 1.53%
23 Jl. Dr. Cipto 0.015 23 1.53%
24 Jl. Dr. Sutomo 0.015 24 1.50%
25 Jl. Widoharjo 0.015 25 1.50%
26 Jl. Mt. Haryono 0.012 26 1.22%
27 Jl. Anton sujarwo 0.012 27 1.18%
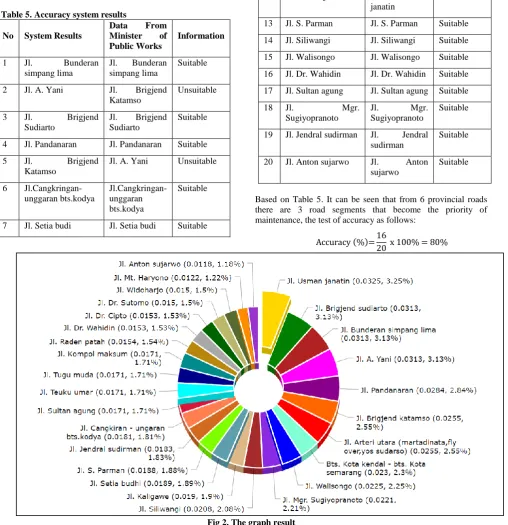
Based on the calculation obtained the highest weight is 0.0325, as well as the ideal value = 1 with the percentage of 3.25% located on the Jl. Usman janatin. And the weight of the lowest value is 0.0118, and the ideal value = 0.3631 with the percentage of 1.18% located on the Jl. Anton sujarwo. The graph results are shown in Figure 2.
3.2.
Analysis of Accuracy
system based on real data. The process of calculating the accuracy test is determined using the accuracy equation.
[image:6.595.53.562.149.675.2]
Comparison of system rankings and rankings on real data is shown in Table 5.
Table 5. Accuracy system results
No System Results
Data From Minister of Public Works
Information
1 Jl. Bunderan simpang lima
Jl. Bunderan simpang lima
Suitable
2 Jl. A. Yani Jl. Brigjend Katamso
Unsuitable
3 Jl. Brigjend Sudiarto
Jl. Brigjend Sudiarto
Suitable
4 Jl. Pandanaran Jl. Pandanaran Suitable
5 Jl. Brigjend Katamso
Jl. A. Yani Unsuitable
6 Jl.Cangkringan-unggaran bts.kodya
Jl.Cangkringan-unggaran bts.kodya
Suitable
7 Jl. Setia budi Jl. Setia budi Suitable
8 Jl. Mt. Haryono Jl. Dr. Sutomo Unsuitable
9 Jl. Dr. Cipto Jl. Dr. Cipto Suitable
10 Jl. Tugu muda Jl. Tugu muda Suitable
11 Jl. Dr. Sutomo Jl. Mt. Haryono Unsuitable
12 Jl. Usman janatin Jl. Usman janatin
Suitable
13 Jl. S. Parman Jl. S. Parman Suitable
14 Jl. Siliwangi Jl. Siliwangi Suitable
15 Jl. Walisongo Jl. Walisongo Suitable
16 Jl. Dr. Wahidin Jl. Dr. Wahidin Suitable
17 Jl. Sultan agung Jl. Sultan agung Suitable
18 Jl. Mgr.
Sugiyopranoto
Jl. Mgr.
Sugiyopranoto
Suitable
19 Jl. Jendral sudirman Jl. Jendral sudirman
Suitable
20 Jl. Anton sujarwo Jl. Anton sujarwo
Suitable
Based on Table 5. It can be seen that from 6 provincial roads there are 3 road segments that become the priority of maintenance, the test of accuracy as follows:
Fig 2. The graph result
The result of the analysis has calculated the percentage of accuracy level indicating that the system built using ANP method has an accuracy level of 80% which means either based on priority ranking between field data and system output. The resulting rating system uses the ANP method by considering the 15 criteria (C1-C15), the weight of each criterion, and the calculation of super matrix. From the test results obtained that the system designed by combining ANP
and web-based methods can be applied to assess the extent of highway damage and determine the priority of highway maintenance appropriately.
4.
CONCLUSION
the following conclusion that the alternatives ranking can be accessed online so that the decision can be taken quickly and accurately. Based on the accuracy result obtained from the system is 80% with field data from the Minister of Public Works consisting of six (6) provincial roads and fourteen (14) national road segments. And the real value of each parameter used on each road segment is very influential in the ranking process for priority in highway maintenance.
The results of this study still restricted. It can be expanded by integrating sensors and systems in realtime in particular places for the measurement of the vehicle capacity parameters of the number of vehicles on highway section. This research is also useful for road users, with the maintained road the oxidant will be decreased.
5.
ACKNOWLEDGMENTS
The author would like to express his sincere thanks to all those who have helped in this research. Particularly to the Office of Public Works-Human Settlements and Spatial Planning of Central Java because it has been willing to be the source of data for this research.
6.
REFERENCES
[1] Law of the Republic of Indonesia Number 38 Year 2004 Concerning the Highway.
[2] Ibeto, I., and Justine, C., 2012. Issues And Challenges In Local Government Project Monitoring And Evaluation In Nigeria: The Way Forward. European Scientific Journal, Vol. 8, No.18, ISSN: 1857 – 7881.
[3] Tanjung, H., and Devi, A., 2013, Metodologi Penelitian Ekonomi Islam, Gramatika, Bekasi.
[4] T.L. Saaty, 2004, Fundamentals Of The Analytic Network Process – Dependence And Feedback In Decision-Making With A Single Network, Journal of systems science and systems engineering, Vol. 13, No. 2, pp129-157.
[5] Regulation of the Minister of Public Works No. 13 of 2011 on Procedures for Maintenance and Highway Ownership.
[6] T.L. Saaty and L.G. Varga, 2006, Decision Making with the Analytic Network Process: Economic, Political, Social and Technological edisi 2, Springer, New York.
[7] Ivanovic, I., Grujicic, D., Macura, D., Jovic, J., Bojovic, N., 2013. One Approach For Road Transport Project Selection. Transport Policy 25 (2013) 22–29.
[8] M.M. Senante, T. Gomez., R. Caballero and H.F Sancho, R.S. Garrido., 2015, Assessment of wastewater treatment alternatives for small communities: An analytic network process approach, Science of The Total Environment 532, 1 676–687.
[9] Cai, S. H., Yao, X. G., and Ping, T., 2007. Evaluation of the Design Alternatives of Emergency Bridge by Applying Analytic Network Process (ANP). Systems Engineering - Theory & Practice. Volume 27, SETP, 2007, 27(3): 63–70.
[10] Prince, B., Zhen, C., and Stephen, O. O., 2015. An Analytical network process Model For Risks Prioritization In Megaprojects. International Journal of Project Management, (2015) No of Pages 17.
[11] Landicho, J. A., 2017. A Web-Based Geographical Project Monitoring And Information system For The Road And Highways. Journal of Electrical Systems and Information Technology (2017) No of Pages 10.