International Journal of Computer Applications (0975 – 8887) Volume 180 – No.36, April 2018
32
End-to-End Performance Evaluation of Service Aware
LTE- A Uplink Scheduler
M. Shuaib
MSc Research Scholar
Department of Computer
Systems Engineering,
University of Engineering and
Technology Peshawar,
Pakistan
M. Bilal
MSc Research Scholar
Department of Computer
Systems Engineering,
University of Engineering and
Technology Peshawar,
Pakistan
A. Nazir
MSc Research Scholar
Department of Computer
Systems Engineering,
University of Engineering and
Technology Peshawar,
Pakistan
ABSTRACT
In order to meet requirements of modern mobile users, 3GPP (3rd Generation Partnership Project) has introduced LTE-A (Long Term Evolution Advanced), which improves the throughput and lowers the latency as compared to previous mobile systems. In order to efficiently allocate radio resources to mobile users, number of schedulers is available in literature. However, most of them are either for downlink, or they do not consider the LTE-A uplink functionalities. This paper presents an LTE-A uplink scheduler called (SA) Service Aware scheduler. The SA scheduler is design in accordance with LTE-A uplink specific features. As the simulation results illustrate, the proposed SA scheduling scheme outperforms other contemporary scheduling schemes by achieving better end-to-end delay and maintaining the uplink cell throughput performance.
General Terms
Radio resources management in LTE-A
Keywords
LTE-A, Uplink scheduling, Service aware Scheduler
1.
INTRODUCTION
Long Term Evolution (LTE) has been designed to support bandwidth intensive applications [1] such as multimedia video applications and gaming. Peak data rates for LTE uplink and downlink are 50Mbps and 100Mbps respectively [2]. In order to meet 4G prerequisites, a system needs to meet the requirements set by the ITU-R (International telecommunication union Radio communication Sector). Therefore, LTE-Advanced (LTE-A) with data rates of up to 1Gbps [3] is considered as a 4G mobile communication system. To achieve such high data rates, LTE-A has introduced several new innovative technological features. These features include CA (Carrier Aggregation), enhanced MIMO
(Multiple Input Multiple Output), CoMP (Coordinated multipoint), and Relay Node (RN) etc.
Due to these features, the performance of LTE-A is improved. The transmission bandwidth of LTE-A is 100MHz while in LTE it is 20MHz.
The primary objective of this paper is to propose a radio resource management scheme for LTE-A uplink data transmission. Radio resource management is the algorithm or technique used to determine the efficient usage of radio resources. Radio resources are scarce and precious. Inefficient allocation of resources can lead to air interface problems such as congestions, bottlenecks and user starvation. Provision of better QoS (Quality of Service)
keeping the user mobility under consideration [2] is also among the major radio resource management issues. However, if the radio resource management techniques are complex, it would require very expensive network nodes to be deployed on both users and network sides. The designers of the network need to think about the trade-off between the performance and complexity of the algorithms. The goals of radio resources management in uplink and downlink are the same, like reducing end-to-end delay and enhancing throughput. However, both are dealt with separately because of their unlike characteristics and features. There are two type of traffic considered in this research. First one is GBR (Guaranteed Bit Rate), where the GBR user is provided with consistent network resources. On the other hand, if a user can only be provided with network resources if they are available, is called non-GBR user. All radio bearers (or traffic flows) are associated with QCI (QoS Class Identifier) based on the bearer priority, bearer delay and packet loss rate of the bearer.
The LA (Link Adaption) keeps channel conditions under consideration to adjust the transmission rate of the data in LTE-A. The CQI (Channel Quality Indicator) makes sure the availability of information of the channel conditions of UE (User Equipment) at the LTE-A base station called eNodeB. Uplink channel information of UE is provided to eNodeB by using the SRS (Sounding Reference Signals). This information serves as a basis for LA, MCS (Modulation and Coding Scheme), transmit power and transmission bandwidth.
3GPP has not standardized the design of scheduler in LTE-A. Every service/network provider can make their own algorithm for scheduler. The scheduling is performed on MAC (Medium Access Control) layer of the eNodeB. The downlink and uplink radio resources are requested by users if the data is present in the uplink and downlink buffers of UEs. This information is reported from UE to eNodeB by BSR (Buffer Status Report). The BSR also send information about traffic type to eNodeB.
33
with high priority is scheduled first and then other users areallocated radio resources. The priority is determined with a metric value of algorithm used by the scheduler. The metric value is determined by using one of several algorithms.
2.
UPLINK SCHEDULING
SC-FDMA (Single Carrier Frequency Division Multiple Access) is used as a transmission scheme for LTE uplink because of the limited power of UEs. The power spectral density is defined as the dissipation of power per PRB (Physical Resource Blocks). The power control mechanism is used to achieve the desired level of SINR (Signal to Interference and Noise Ratio) without breaching the constraints of power set by the service provider. However, this can minimize the number of PRBs a user can utilizes in a TTI if the user is having poor channel conditions. The scheduler needs to be aware of the power spectral density for each PRB of every UE. This is achieved with the help of power headroom report containing information about power spectral density and conveyed to eNodeB.
The allocation of radio resources in efficient manner through scheduling is one of the primary concerns of LTE and LTE-A network providers. LTE-And it is far more complicated in uplink then in downlink because in downlink one doesn‟t need to focus on contiguity constraints and power control. In LTE, contiguity constraint and power control are considered while designing uplink scheduler. However, contiguity constraint is not an issue in LTE-A, because due to CA, uplink air interface of LTE-A is considered as an aggregation of multiple SC-FDMA bands. This aggregation allows the support of both contiguous and non-contiguous resource allocation in uplink to UEs. The only issue to deal with in LTE-A uplink scheduling is power constraints in LTE-A. The scheduler presented in this paper is denoted as SA (Service Aware) LTE-A uplink scheduler. The SA is designed to provide services efficiently to UEs with good channel conditions and also maintain some level of fairness by not letting the cell edge user with bad channel conditions to starve. The working mechanism of scheduler is divided in two phases; TDPS (time domain packet scheduling) and FDPS (frequency domain packet scheduling). In TDPS, the UEs are prioritized and selected according to some metric value, while in FDPS resources are allocated to those UEs which are selected according to priority by the TDPS. This paper presents SA scheduling scheme for LTE-A uplink traffic and its performance is analyzed under the varying load scenarios and in different channel conditions. However, the TDPS and FDPD phases are elaborated here.
2.1
Time Domain Packet Scheduling
The presence of uplink data in PDCP (Packet Data Convergence Protocol) buffer of UE is reported to eNodeB using BSR. The function of BSR is to report data in UE buffer to the eNodeB to initiate a radio resource request. The BSR also can be used to convey information about the bearer status within the UE. The eNodeB is also made aware about channel conditions of UE through SRS. So a list of active users with data to transmit is prepared along with channel information. The eNodeB is also aware of the power spectral density using Power headroom report. UEs in TDPS are prioritized using a metric value in every TTI. Users with highest metric values are qualified to be selected and subsequently scheduled in FDPS. The metric values for UEs are determined in SA scheme using the equation below
∆ 𝐢 𝐭 =
𝐑
𝐢𝐧𝐬𝐭,𝐢𝐭
𝐑
𝐚𝐯𝐠,𝐢𝐭
𝐊
𝐢
𝐭
(1)
Where ∆ 𝑖 (𝑡) is the time domain metric value of user i at time t, 𝑅𝑖𝑛𝑠𝑡 , 𝑖 (𝑡) is the instantaneously achievable throughput of user i at time t considering that all the PRBs have been allocated to i. 𝑅𝑎𝑣𝑔 , 𝑖 (𝑡) is the average throughput of user i at time t. 𝑘𝑖 (𝑡) is the QOS weight with value of 10 for GBR users and 1 for NGBR users so that GBR users are given higher priority.
2.2
Frequency Domain Packet
Scheduling
The basic function of FDPS is to distribute resources in already selected users of TDPS during a TTI. The bandwidth is represented by PRBs and allocated to users as a PRB is the smallest resource allocation unit in LTE-A. Contrary to LTE, in LTE-A there is no contiguity constraint as explained earlier, this where the scheme proposed in this paper stands out. The allocation of the PRBs is based on criteria or metric value which is listed given below
∆ i, c t =
R
inst ,i,ct
R
avg ,i,ct
(2)
where ∆ 𝑖, 𝑐 (𝑡) is the FDPS metric value for PRB c of UE i,
𝑅𝑖𝑛𝑠𝑡 ,𝑖 .𝑐 (𝑡) is the instantaneously achievable throughput for PRB i of UE i, 𝑅𝑎𝑣𝑔 ,𝑖 .𝑐 (𝑡) is the EMA throughput of UE i over only those TTIs where i is scheduled.
3.
LITERATURE SURVEY
Although there is advancement in introducing of new physical layer techniques, but resource allocation algorithms should also evolve to adapt to these new ways of using mobile networks and meet mobile users „requirements[4]. Several scheduling algorithms are available in literature i.e. [3], [5]. Most of them are for downlink scheduling techniques. While some of them are for uplink. But most of the uplink schemes are designed for LTE and key LTE-A features such as CA etc. are not considered. Among the research work done on downlink scheduling algorithms, some of them are presented in [5], [6]. In [7], different bearers are treated with fixed slots in OFDMA (Orthogonal Frequency Division Multiple Access) frames. In this algorithm, the authors also consider QoS and channel conditions for scheduling decisions. Beidokhti el-all presented two algorithms in [8], while not considering fairness in both the algorithms. The downlink scheduling has no power constraints; hence this algorithm cannot be used for uplink scheduling. However the uplink scheduling schemes have to be design with power control constraints in consideration for power limited UEs. In [9], channel dependent and channel independent fairness is evaluated in LTE uplink. The research work done in [10] and [9] does not address QoS requirements of UEs, while the issue of QoS provision is addressed by the authors of [12] and [13] but only for wired networks. The authors of [14] propose a (PF) Proportional Fair scheduling algorithm.
4.
RESULTS AND ANALYSIS
34
those users which are at a distance of 150 meter from [image:3.595.324.536.69.226.2]eNodeB, far users are those who are at 250 meter from eNodeB, While cell-edge users are 350 from eNodeB Shuaib and el-all compares uplink cell throughput and end to end delay of three scheduler (MT) Maximum throughput (BET) Blind equal throughput and (SA) Service Aware. This paper simulation model is listed below.
Figure 1.0 This Research model
4.1
Uplink Cell Throughout
In Figure 1.1 shows uplink cell throughput of different schedulers BET, MT and SA. There are total of ten runs for each scheduler having one near one far and on cell-edge user. All the Schedulers perform similar to an extent as shown in below. While the figure 3.0 shows the error bars in throughput of these schedulers
[image:3.595.76.311.149.369.2]Figure 2.0 Comparison of Uplink Cell throughputs of BE, MT and SA
Figure 3.0 Error bars of throughput of BET, MT and SA
4.2
End-to End delay of near users
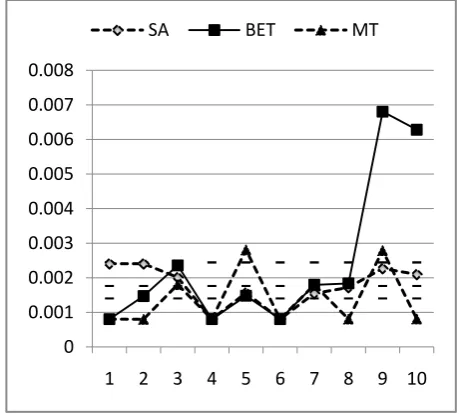
[image:3.595.322.537.354.566.2]There are total of ten scenarios. The distance of near users is 150 meter from eNodeB. In every scenario one users is incrimented. The MT perform better because it gives resources to users having good channel conditions but fairness is degraded in MT Scheduler. The figure 5.0 shows the error bars of the end-to-end delay for near users based on standard deviation.
Figure 4.0 End-to-End delay of near users for BET, MT and SA
0
2
4
6
8
10
12
3
6
9 12 15 18 21 24 27 30
Mbp
s
Video users
Uplink cell throughput for
different schedulers
BET
MT
SA
-10
-5
0
5
10
15
20
1
2
3
4
5
6
7
8
9 10
SA
BET
MT
0.0000
0.0050
0.0100
0.0150
0.0200
0.0250
3
6
9 12 15 18 21 24 27 30
sec
Video users
Video end-to-end delay for near
users
[image:3.595.93.307.468.687.2]35
Figure 5.0 Error bars of End-to end delay of BET, MTand SA near users
4.3
End-to-End delay far users
[image:4.595.318.548.72.279.2]In the figure 6.0 End-to-End of far users have shown. The MT is performing good as the channel conditions are not bad enough. The distance of far users from eNodeB is 250 meter in this model. The figure 7.0 shows the error bars of end-to-end delay for far users of BET, MT and SA
[image:4.595.79.295.332.529.2]Figure 6.0 End-to End delays of far users for BET, MT and SA
Figure 7.0 Error bars of End-to end delay of BET, MT and SA far users
4.4
End to End delay of cell edge users
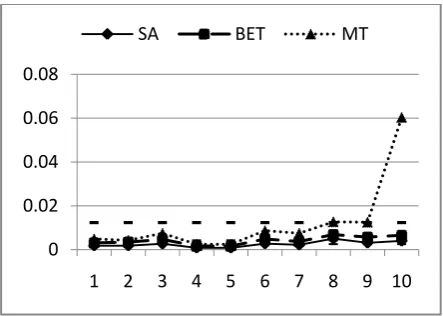
The cell-edge users defined by the author-el-all are on distance of 350 meter from eNodeB. Channel conditions become a bit worse as we go far from eNodeB. The MT Scheduler performance degraded as shown in the figure 8.0. The SA behaves very well to cell-edge users as its behavior is always smooth to every scenario. The figure 9.0 elaborates the error bars for the cell-edge users.Figure 8.0 End-to End delays of cell-edge users for MT, BET and SA
0
0.001
0.002
0.003
0.004
0.005
1
2
3
4
5
6
7
8
9 10
SA
BET
MT
0.0000
0.0020
0.0040
0.0060
0.0080
0.0100
0.0120
3 6 9 12 15 18 21 24 27 30
sec
Video users
Video end-to-end delay for far
users
BET
MT
SA
0
0.001
0.002
0.003
0.004
0.005
0.006
0.007
0.008
1
2
3
4
5
6
7
8
9 10
SA
BET
MT
0.000
0.005
0.010
0.015
0.020
0.025
0.030
0.035
0.040
3 6 9 12 15 18 21 24 27 30
sec
Video users
Video end-to-end delay for cell
edge users
[image:4.595.321.544.405.604.2]36
Figure 9.0 Error bars of End-to end delay of BET, MTand SA far users
5.
CONCLUSION AND FUTURE
WORK
This Paper presents a scheduler called SA for LTE-A uplink which was designed to perform better in end to end delay and maintain uplink cell throughput. In this paper only one type of traffic was analyzed video users. In future we would be looking to analyze the multi bearer traffic of the SA Scheduler. We would be looking to implement Carrier Aggregation and others LTE-A feature in SA to improve its performance
6.
ACKNOWLEDGEMENT
The authors are very thankful to. Yasir Mehmood, PhD student at University of Bremen, Germany for sharing his expertise and valuable input, without his efforts this work seems impossible.
7.
REFERENCES
[1] R. Ruby, S. Member, V. C. M. Leung, D. G. Michelson, and S. Member, “Uplink Scheduler for SC-FDMA-Based Heterogeneous Traffic Networks With QoS Assurance and Guaranteed Resource Utilization,” IEEE Trans. Veh. Technol., vol. 64, no. 10, pp. 4780– 4796, 2015.
[2] “3GPP TSG RAN Future Evolution Work Shop 2 -3 , Compendium of Abstracts Technical paper,” Toronto, Canada, 2004.
[3] S. N. K. Marwat, Y. Dong, X. Li, Y. Zaki, and C. Goerg, “Novel Schemes for Component Carrier Selection and Radio Resource Allocation in
LTE-Advanced Uplink,” in International Conference on Mobile Networks and Management, 2014, pp. 32–46. [4] A.Ragaleux, “Standard-compliant LTE-A Uplink
Scheduling Scheme with Quality of Service,” IEEE Veh. Technol. Soc., vol. 9545, no. c, pp. 1–15, 2017. [5] G. Piro, L. A. Grieco, G. Boggia, P. Camarda, D. E. E.
Dipartimento, and P. Bari, “A Two-level Scheduling Algorithm for QoS Support in the Downlink of LTE cellular networks,” in European Wireless Conference (EW), 2010, pp. 246–253.
[6] L. Gavrilovska, S. Member, nd D. Talevski, “Novel Scheduling Algorithms for LTE Downlink Transmission,” in Telecommunications Forum (TELFOR), 2011, pp. 398–401.
[7] T. Ali-Yahiya, Understanding LTE and its Performance, vol. 53, no. 9. Springer, 2011.
[8] R. K. Beidokhti, “Adaptive QoS scheduling in wireless cellular networks,” Springer, pp. 701–716, 2011. [9] H. Safa and K. Tohme, “LTE Uplink Scheduling
Algorithms : Performance and Challenges,” Telecommun., no. Ict, 2012.
[10]F. D. Calabrese, P. H. Michaelsen, C. Rosa, M. Anas, C. Ú. Castellanos, and D. L. Villa, “Search-Tree Based Uplink Channel Aware Packet Scheduling for UTRAN LTE,” VTC Spring 2008 - IEEE Vehicular Technology Conference, 2008. .
[11]J. Lim, H. G. Myung, K. Oh, and D. J. Goodman, “Proportional fair scheduling of uplink single-carrier fdma systems,” in Personal, Indoor and Mobile Radio Communications, 2006 IEEE 17th International Symposium on, 2006, pp. 11–14.
[12]T. M. Lim, B. Lee, and C. K. Yeo, “Quantum-Based Earliest Deadline First Scheduling for Multiservices,” IEEE Trans. Multimed., vol. 9, no. 1, pp. 157–168, 2007.
[13]W. Sun, S. Member, and K. G. Shin, “End-to-End Delay Bounds for Traffic Aggregates Under Guaranteed-Rate Scheduling Algorithms,” IEEE/ACM Trans. Netw., vol. 13, no. 5, pp. 1188–1201, 2005. [14]S. Lee, A. Meyerson, S. Xu, and S. Lu, “Proportional
Fair Frequency-Domain Packet Scheduling for 3GPP LTE Uplink,” IEEE INFOCOM, pp. 2611–2615, 2009. [15]