DOI: 10.4236/oalib.1104659 Jun. 14, 2018 1 Open Access Library Journal
Reliability Analysis of Automatic Transmission
Based on T-S Fuzzy Fault Tree
Chaokai Lei
*, Haitao Ji, Ning Hu
Shanghai University of Engineering Science, Shanghai, China
Abstract
In order to solve the lack of automatic transmission slippage fault data, the uncertainty of the link between the source of the fault and the degree of fail-ure, the lack of applicability of the traditional Boolean logic gate, the T-S model and fuzzy theory and the revision of the confidence index are pro-posed. The expert survey method was combined and the analysis method was introduced into the fault tree. The T-S model is introduced into the typical fault analysis, using the fuzzy possibility to describe the failure probability of the component. The connection between events is described with the T-S gate. The fault degree of the component is described by the fuzzy number, the model simulation is used to simulate the fault analysis, and the contribution or importance of the top event to the failure of the component is obtained. The fuzzy possibility and fault diagnosis of the top event are calculated. Without knowing the fault mechanism accurately, we can find the weak link of the system, and provide reference for automatic transmission slip fault di-agnosis and maintenance.
Subject Areas
Automata
Keywords
Automatic Transmission, T-S Model, Fuzzy Fault Tree, Fault Diagnosis, Reliability Confidence Index
1. Introduction
Hydraulic automatic transmission is widely used in cars [1]. The automatic transmission is a complex system that combines mechanical, electronic and hy-draulic components. Due to the complex structure and working principle of the
How to cite this paper: Lei, C.K., Ji, H.T. and Hu, N. (2018) Reliability Analysis of Automatic Transmission Based on T-S Fuzzy Fault Tree. Open Access Library Journal, 5: e4659.
https://doi.org/10.4236/oalib.1104659
Received: May 15, 2018 Accepted: June 11, 2018 Published: June 14, 2018
Copyright © 2018 by authors and Open Access Library Inc.
This work is licensed under the Creative Commons Attribution International License (CC BY 4.0).
http://creativecommons.org/licenses/by/4.0/
DOI: 10.4236/oalib.1104659 2 Open Access Library Journal hydraulic automatic transmission, the difficulty of fault detection is increased. The fault diagnosis carried out by an on-board diagnostic system in a modern electronically controlled automatic transmission is generally limited to the judgment of the electrical system fault. There is no clear test result for hydraulic faults that play a key role. Because of the complexity of the structure and com-position of its own hydraulic system, the probability of failure is correspondingly higher. And hydraulic system faults also have diversity, uncertainty and ambigu-ity [2].
Fault Tree Analysis (FTA) is a method for analyzing system reliability. It has been recognized as one of the simplest, most effective, and most promising tools for reliability analysis, prediction, and design of complex systems [3]. Fault tree analysis is an effective tool for analyzing the reliability and safety of large-scale complex systems. Traditional fault tree analysis methods based on probability theory and Boolean algebra have been widely used in fault diagnosis of hydraulic systems. However, the traditional fault tree analysis method has the following deficiencies: a) The failure probability of the bottom event must be known accu-rately; b) The connection between the events needs to be accurately known; c) The severity of the failure cannot be described. The above three shortages make it difficult to establish and quantitatively analyze the fault tree, thus limiting the application of fault tree analysis in hydraulic system fault diagnosis. Tanaka et al.
[4] introduced the fuzzy theory into the fault tree analysis for the first time in 1983, thus solving the ambiguity and uncertainty of the failure rate of the basic event in the fault tree (using fuzzy multiplication instead of the traditional logic operation, but still in and or gates logically). Yao Chengyu et al.[5][6] put for-ward the T-S fuzzy fault tree model and applied them to equipment diagnosis and control equipment diagnosis, integrated navigation system and so on, and achieved good results.
The fuzzy theory has the advantages of dealing with fuzzy and inaccurate in-formation, combining the fault tree analysis method with the fuzzy theory. It not only draws the advantages of the fault tree analysis, but also takes full account of the characteristics of the fault occurrence probability, the connection of the events and the fuzziness of the fault degree, and it is carried out. An effective method for fault diagnosis of hydraulic system is made, so the slip fault of auto-matic transmission is analyzed. In this paper, a fuzzy fault tree method based on T-S fuzzy fault tree is proposed for the diagnosis and analysis of automatic transmission.
2. T-S fuzzy Fault Tree
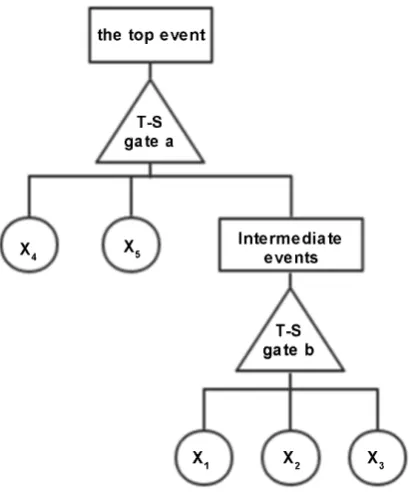
A new T-S fuzzy fault tree is constructed by using T-S gates instead of traditional logic AND gates. In the new fault tree, the failure probability and the degree of failure of each basic event are replaced by fuzzy numbers. Figure 1 shows the T-S fuzzy gate fault tree model. Where x x x x x1, , , ,2 3 4 5 is basic events. Gate a
DOI: 10.4236/oalib.1104659 3 Open Access Library Journal
Figure 1. Fuzzy fault tree.
2.1. Fuzzy Number
Considering that traditional failure trees have less historical failure data for basic events in practical applications, fuzzy logic is introduced. Using fuzzy numbers to represent the failure probability of each basic event, the establishment of a fault tree is no longer dependent on a large number of failure data. In the T-S fuzzy fault tree, the degree of each fault is usually represented by the fuzzy num-ber in the interval [0, 1].
The trapezoidal membership function µ
( )
x , shown in Figure 2, is used as the membership function of fuzzy numbers.( ) (
x m a b a b0, , , ,l l r r)
µ = (1)
The membership function expression of Figure 2 as follows:
( )
(
0)
00 0
0 0
0 0
0
0 0 1
0
l l
l l
l l l
l
l r
r r
r r r
r
r
x m a b x m a b
m a b x m a b
x m a x m a
m a b x m a x m a b
b
m a
µ
≤ ≤ − −
− − −
− − < ≤ −
= − < ≤ +
+ + −
+ < ≤ + +
+ +br x
<
(2)
where m0 is the center of a fuzzy number support set, al and ar is sup-porting radius, bl and br is area of fuzzy.
According to Figure 2, we can see, when a al = r =0, trapezoid membership
function is a triangle membership function; when b bl= r=0 fuzzy number as a
DOI: 10.4236/oalib.1104659 4 Open Access Library Journal
Figure 2. Membership function of fuzzy number.
2.2. T-S Fuzzy Gate Fault Tree Algorithm
The T-S fuzzy model is composed of a series of IF-THEN fuzzy rules. It is a non-linear model, which is used to describe the association between events and form a T-S fuzzy gate. The rules of the model are expressed as follows [7]:
If x ii
(
=1,2, , n)
is basic event variable, y is superior variable,(
1,2, ,)
lj
F j= n is fuzzy set, and the rules is l l
(
=1,2, , m)
; if x1 is Fl1, 2x is Fl2, , xn is Fln, then y is yl. If the membership function of the fuzzy set is
µ
Flj( )
xj , then the output of T-S model as follow:( )
( )
1
1 lj 1 lj
n m n
F j F j l
l
j j
y µ x µ x y
=
= =
=
∏
∑
∏
(3)So basic events and superior events T-S fuzzy gates are shown in Figure 3. If the fuzzy number:
{
1 2 1} {
1 2 2}
{
1 2}
1, , ,1 1k , 2, , ,2 2k , , n, , ,n knn
x x x x x x x x x and
{
y y1, , ,2 yky}
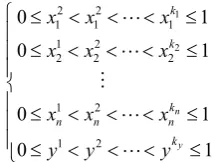
indicates the degree of failure of the bottom event and the su-perior event respectively. Their range of values as follow:1
2
2 2
1 1 1
1 2
2 2 2
1 2
1 2
0 1
0 1
0 1
0 1
n
y k
k
k
n n n
k
x x x x x x
x x x y y y
≤ < < < ≤
≤ < < < ≤
≤ < < < ≤
≤ < < < ≤
(4)
The T-S fuzzy gate algorithm is described as follows:
The rules is l l
(
=1,2, , m)
; if x1 is x1i1, x2 is x2i2, , xn is xnin, then the probability, y is y1, is P yl( )
1 , the probability, y is y2, is P yl( )
2 , ,the probability, y is yky, is P yl
( )
ky . Where1 1,2, , 1
i = k , i2 =1,2, , k2, ,
1,2, ,
n n
i = k . The total number of rules is m, we can get the equation of m:
1
n i i
m k
=
=
∏
(5)Assuming that the degree of failure of a basic event is
( ) ( )
1 2( )
1i , 2i , , nin
P x P x P x . Then the possibility of the rules l l
(
=1,2, , m)
ex-ecution as follows:( ) ( )
1 2( )
0l 1i 2i nin
P =P x P x P x (6)
DOI: 10.4236/oalib.1104659 5 Open Access Library Journal
Figure 3. T-S logic gate.
( )
( )
( )
( )
( )
( )
1 1 0 1 2 2 0 1 0 1 y y m l l l m l l l mk l l k
l
P y P P y
P y P P y
P y P P y = = = = = =
∑
∑
∑
(7)If the x ii
(
=1,2, , n)
fault level is x′={
x x1′ ′, , ,2 xn′}
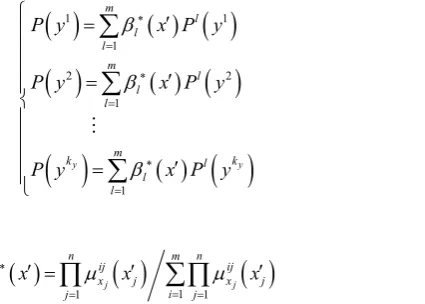
. According to the T-S fuzzy model, the fuzzy possibility of the fault level of the upper event can be cal-culated as follows:( )
( )
( )
( )
( )
( )
( )
( )
( )
1 1 1 2 2 1 1 y y m l l l m l l l mk l k
l l
P y x P y
P y x P y
P y x P y β β β ∗ = ∗ = ∗ = = ′ ′ = = ′
∑
∑
∑
(8)
where
( )
( )
( )
1
1 j 1 j
n m n
ij ij
l x j x j
i
j j
x x x
β∗ µ µ
=
= =
′ =
∏
′∑
∏
′ (9)Additionally, j
( )
ij x xjµ
′ is the degree of membership of the fuzzy setcorres-ponding to the fault status of the j component in the l rule.
Therefore, taking Figure 1 as an example, if the fuzzy possibility of the degree of failure of the basic event is known, according to the T-S gate rule, the fuzzy possibility of the failure degree of the upper event can be estimated using for-mulas and forfor-mulas, respectively.
2.3. T-S Fuzzy Importance
DOI: 10.4236/oalib.1104659 6 Open Access Library Journal event. It is a function of the time. The reliability parameters of the component and the system structure are widely used in practice [8]. The fuzzy subset of the failure probability of the known component xj fault status x jijj
(
=1,2, , n)
is ijj x
P , It’s membership function is µPx jij ; The fuzzy subset of the failure proba-bility of the top event T fault status Tq is
(
1 2)
1i , 2i , , inn
x x x
P P P P , where (i1=1,2, , k1,i2 =1,2, , k2, ,in=1,2, , kn), It’s membership function is
ij x j P
µ .
Definition: The fuzzy subset of the failure probability of component xj with failure status ij
(
1,2, ,)
j
x j= n is ij j x
P . It’s T-S fuzzy importance for the system top event T is obtained by following equation:
( )
(
) (
)
, ,0 , ,0 1 1 0 0 1 1 0 0, 1 , 0
d d
d d
ij ij
q j j
ij ij
x Tj q xj
ij ij
x Tj q xj Fu ij
T j q x q x
P P
P P
I x E P T P P T P
x x x x
x x µ µ µ µ = = − = =
∫
−∫
∫
∫
(10)where
(
, ij 1)
j q x
P T P = indicate fuzzy subset, when ij
j x
P is 1, The probability of failure of its top event T.
(
, ij 0)
j q x
P T P = indicate fuzzy subset, when ij
j x P is 0, The probability of failure of its top event T. Combining Equations (6) and (7) with 0 and 1 instead of ij
j x
P , the two integral terms represent the cen-ter-of-gravity values of the fuzzy subset of the probability of failure of the system top event T failure degree Tq when ij
j x
P is 0 and 1, respectively.
Definition: The following formula is expressed T-S fuzzy importance of basic events:
( )
1( )
j
q q
k
Fu Fu ij
T j ij T j j
I x =
∑
′= I x k′ (11)where, k′j indicate the number of non-zero fault conditions for the j part. If the fault status fuzzy number is represented by (0, 0.5, 1), then k′j is 2. q
( )
Fu T j I x is the influence of each fault state on the average fault state of the system during the change of component fault status from 0 to 1.
3. T-S Fuzzy Fault Tree Analysis Example
3.1. Hydraulic Automatic Transmission T-S Fuzzy Fault Tree
Establish T-S fuzzy fault tree [9][10] as shown in Figure 4, x x1, , ,2 x16 is
ba-sic events, T is top event, y y y1, ,2 3 is intermediate events. According to the
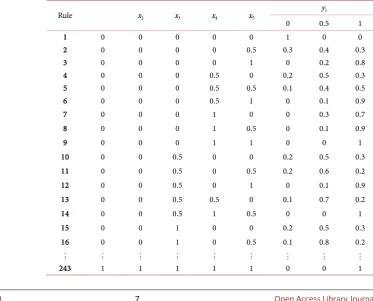
ac-tual fault condition, suppose that there are three kinds of states in the degree of failure of the basic fault and intermediate event of the fuzzy fault tree of the au-tomatic transmission T-S (Table 1): no fault, minor fault, and complete fault, which are (0, 0.5, 1), respectively. The parameter is a al = r =0.2, b bl= r=0.3.
DOI: 10.4236/oalib.1104659 7 Open Access Library Journal
[image:7.595.206.539.249.415.2]Figure 4. T-S fuzzy fault tree of hydraulic automatic transmission.
Table 1. Names of each events in the T-S fuzzy fault tree of an automatic transmission.
Event
code Events name Event code Event name
T Automatic transmission slip x7 Quality deterioration of hydraulic oil
y1 Mechanical wear x8 Oil pipe depression
y2 Oil problem x9 Type of oil is wrong
y3 Oil leaking x10 Improper adjustment of throttle position sensor
x1 Friction disc wear of clutch x11 Seal ring damage of clutch piston
x2 Friction disc wear of brake x12 Damage of piston seal ring of brake
x3 Wear and burn of brake belt x13 Damage of piston seal ring of shock absorber
x4 Oil pump wear x14 Filter blockage
x5 Unidirectional clutch skidding x15 Main oil road leak
x6 Abnormal hydraulic oil surface x16 Main pressure valve problem
Table 2. T-S fuzzy gate G2.
Rule x2 x3 x4 x5
y1
0 0.5 1
1 0 0 0 0 0 1 0 0
2 0 0 0 0 0.5 0.3 0.4 0.3
3 0 0 0 0 1 0 0.2 0.8
4 0 0 0 0.5 0 0.2 0.5 0.3
5 0 0 0 0.5 0.5 0.1 0.4 0.5
6 0 0 0 0.5 1 0 0.1 0.9
7 0 0 0 1 0 0 0.3 0.7
8 0 0 0 1 0.5 0 0.1 0.9
9 0 0 0 1 1 0 0 1
10 0 0 0.5 0 0 0.2 0.5 0.3
11 0 0 0.5 0 0.5 0.2 0.6 0.2
12 0 0 0.5 0 1 0 0.1 0.9
13 0 0 0.5 0.5 0 0.1 0.7 0.2
14 0 0 0.5 1 0.5 0 0 1
15 0 0 1 0 0 0.2 0.5 0.3
16 0 0 1 0 0.5 0.1 0.8 0.2
[image:7.595.160.534.448.749.2]DOI: 10.4236/oalib.1104659 8 Open Access Library Journal
Table 3. T-S fuzzy gate G3.
Rule x6 x7 x8 x9
y2
0 0.5 1
1 0 0 0 0 1 0 0
2 0 0 0 0.5 0.2 0.5 0.3
3 0 0 0 1 0 0.4 0.6
4 0 0 0.5 0 0.2 0.5 0.3
5 0 0 0.5 0.5 0.1 0.4 0.5
6 0 0 0.5 1 0 0.1 0.9
7 0 0 1 0 0 0.3 0.7
8 0 0 1 0.5 0 0.1 0.9
9 0 0 1 1 0 0 1
10 0 0.5 0 0 0.2 0.5 0.3
11 0 0.5 0 0.5 0.2 0.6 0.2
12 0 0.5 0 1 0 0.1 0.9
81 1 1 1 1 0 0 1
Table 4. T-S fuzzy gate G1.
Rule y1 y2 y3
T
0 0.5 1
1 0 0 0 1 0 0
2 0 0 0.5 0.2 0.4 0.6
3 0 0 1 0 0.2 0.8
4 0 0.5 0 0.1 0.5 0.4
5 0 0.5 0.5 0 0.4 0.6
6 0 0.5 1 0 0.1 0.9
7 0 1 0 0 0.3 0.7
8 0 1 0.5 0 0.1 0.9
9 0 1 1 0 0 1
27 1 1 1 0 0 1
According to Tables 2-4, the fuzzy possibility of a superior event fault can be calculated by the fuzzy possibility or the degree of failure of the basic events, and then the fuzzy possibility of the top event can be estimated.
3.2. Expert Investigation Method Combined with Confidence
Index Correction
[image:8.595.206.540.379.580.2]DOI: 10.4236/oalib.1104659 9 Open Access Library Journal terature [11]. Experts are selected according to academic qualifications, length of service and other conditions. The experts involved in the investigation come from first-line management, maintenance and design personnel. The composi-tion of the experts is shown in Table 5. Calculation formula such as formula (11)
(
)
4 1
r r r m vr r
ω ν
=∑
= (11) Ordinary expert survey methods generally assume that all experts have full confidence in their own judgments, but they are not practical when applied. In order to improve the accuracy of the fuzzy failure probability, this article intro-duces the “confidence index method” of the literature [11] to further correct the data obtained by the common expert survey method. Table 6 is the survey table of failure rates of basic events in the fault tree of the automatic transmission shift failure. The probability range is based on incomplete statistical data and is com-bined with personal work experience. Fill in the confidence index and select the confidence index for yourself. It is 0.1 ~ 1.Based on the expert survey method modified by the confidence index and us-ing the weighted average idea, the overall evaluation process for the probability of a certain basic event by all experts is as follows.
1) If the number of experts participating in the survey is m. There are N basic events. According to Table 5, the calculation weight of the ith expert is wi, and he judges the probability of occurrence of the jth basic event as L Rij, ij, and the confidence index of judging himself as Kij
(
0<Kij≤1)
. The confidence index is 1, indicating that the expert has full confidence in his judgment and high credibility; and the confidence index is 0.1, indicating that the credibility of the expert’s judgment result is very low.2) The interval of the probability interval of the expert judgment is obtained by ∆ =ij Rij−Lij.
3) If mij = ∆ij 2, then the contribution of the ith expert to the final
cumula-tive result of the jth basic event occurrence probability is:
(
1)
, ,(
1)
ij i ij ij ij ij ij ij ij
P =w m − −k ∆ m m + −k ∆ (12)
4) The probability of the occurrence of the jth basic event, the final result of the confidence index correction and the m expert weight accumulation, such as the follow Equation (13)
1
m
j ij
i
p p
=
=
∑
(13)j
p is an fuzzy number of the isosceles triangular.
DOI: 10.4236/oalib.1104659 10 Open Access Library Journal
Table 5. Composition of experts.
Rule r Number mr Coefficient vr Weight wr
1 9 1.0 0.027400
2 18 0.9 0.024658
3 8 0.8 0.021918
4 7 0.7 0.019178
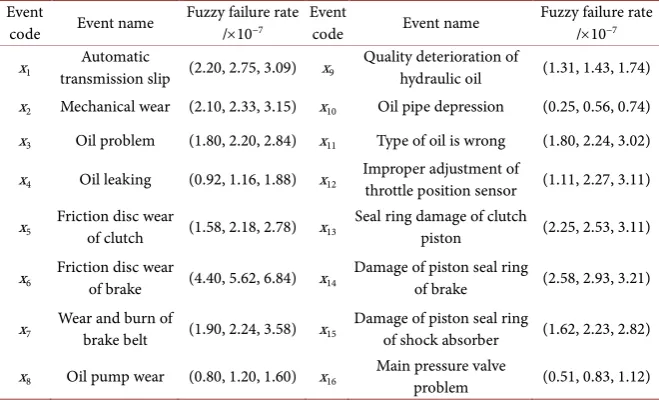
Table 6. Fuzzy failure rate of each basic event of automatic transmission.
Event
code Event name Fuzzy failure rate /×10−7 Event code Event name Fuzzy failure rate /×10−7
x1 transmission slip (2.20, 2.75, 3.09) xAutomatic 9 Quality deterioration of hydraulic oil (1.31, 1.43, 1.74)
x2 Mechanical wear (2.10, 2.33, 3.15) x10 Oil pipe depression (0.25, 0.56, 0.74)
x3 Oil problem (1.80, 2.20, 2.84) x11 Type of oil is wrong (1.80, 2.24, 3.02)
x4 Oil leaking (0.92, 1.16, 1.88) x12 Improper adjustment of throttle position sensor (1.11, 2.27, 3.11)
x5 Friction disc wear of clutch (1.58, 2.18, 2.78) x13 Seal ring damage of clutch piston (2.25, 2.53, 3.11)
x6 Friction disc wear of brake (4.40, 5.62, 6.84) x14 Damage of piston seal ring of brake (2.58, 2.93, 3.21)
x7 Wear and burn of brake belt (1.90, 2.24, 3.58) x15 Damage of piston seal ring of shock absorber (1.62, 2.23, 2.82)
x8 Oil pump wear (0.80, 1.20, 1.60) x16 Main pressure valve problem (0.51, 0.83, 1.12)
3.3. Fuzzy Possibility of Higher Level Events Calculated by Fuzzy
Probability of Basic Event Failures
According to Table 6, the failure rate of these components is the failure rate when the failure state is 0.5, and the failure rate assuming that the failure level is 0.5 is equal to the failure rate when the failure degree is 1. Combining Equations (6) and (7) with MATLAB, the likelihood of an intermediate event blurring is as follows:
(
)
(
)
(
)
(
)
(
)
(
)
81
2 0 2
1
1 1 2 2 81 81
0 2 0 2 0 2
7
0.5 0.5
0.5 0.5 0.5
4.21,5.66,6.32 10
l l
l
P y p p y
p p y p p y p p y =
−
= = =
= = + = + + =
= ×
∑
(
)
(
)
(
)
(
)
(
)
(
)
81
2 0 2
1
1 1 2 2 81 81
0 2 0 2 0 2
7
1 1
1 1 1
13.67,15.23,16.38 10
l l
l
P y p p y
p p y p p y p p y =
−
= = =
= = + = + + =
= ×
∑
Similarly, the fuzzy possibility of different states of other intermediate events can be calculated. We can know in Table 7.
[image:10.595.208.538.209.409.2]DOI: 10.4236/oalib.1104659 11 Open Access Library Journal
y1 (5.201, 9.951, 12.708) (10.056, 19.452, 26.132)
y2 (1.629, 2.141, 3.225) (2.194, 4.488, 5.236)
y3 (4.592, 8.564, 11.425) (8.699, 15.312, 19.548)
(
0.5) (
18.113,20.325,23.569 10)
7P T= = × −
(
1) (
38.863,46.729,55.686 10)
7P T= = × −
The calculation results show that the probability of failure of automatic transmission slipping is the same order of magnitude as the probability of failure of each component. The possibility of failure of the T-S fuzzy fault treetop event is far greater than the possibility of failure of each component. This result is in accordance with the actual situation, which verifies the accuracy and feasibility of the T-S fuzzy fault number in the automatic transmission fault analysis process.
Take the gravity value of each event as its failure probability, and according to formula (10), obtain the T-S fuzzy importance degree when y is 0.5 when com-ponent x is 0.5, as follows:
( )
(
1) (
1)
6 6
1
0.5Fu 6 0.5, x 1 0.5, x 0 0.166
I x =E P P = −P P = =
Similarly, the T-S fuzzy significance of the fault states of the components of 0.5 and 1 can be obtained as shown in Table 8.
According to Equation (11), combined with the T-S fuzzy importance of the fault states 0.5 and 1, the T-S fuzzy significance at 0.5 is obtained.
( )
( )
0.5( )
10.5Fu 6 0.5Fu 6 0.5Fu 6 2 0.4
I x =I x +I x =
Similarly, the T-S fuzzy importance of each component is obtained, as shown in Table 9.
Given the fuzzy subset of the failure probability of the component’s fault state, it can be known from Table 9 that when the system is in a half-fault state (0.5), the importance of x is greatest, which is the weak link in the process of transmis-sion slip. Then we can get the troubleshooting sequence:
6
x , x x x x1
(
2, ,5 14)
, x x12( )
15 , x9 , x8, x13, x11, x3, x7 , x x x4(
10, 16)
.When the automatic transmission is in a complete fault state (1), the importance of each component is from large to small: x2, x14, x1, x6, x13, x4, x15,
( )
3 10
x x , x8, x16, x11, x9, x12, x7, x5, It can be seen that when the system
completely fails, the importance of the basic event x2, x14, x1, x6 is large,
the impact on the top event is also the greatest. Other components also have a certain influence, but the degree of influence is small.
[image:11.595.207.537.91.175.2]DOI: 10.4236/oalib.1104659 12 Open Access Library Journal
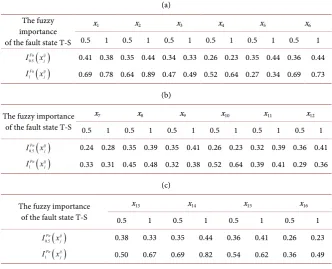
Table 8. T-S fuzzy importance of each component failure state.
(a) The fuzzy
importance of the fault state T-S
x1 x2 x3 x4 x5 x6
0.5 1 0.5 1 0.5 1 0.5 1 0.5 1 0.5 1
( )
0.5
Fu ij j
I x
( )
1Fu ijj
I x
0.41 0.38 0.35 0.44 0.34 0.33 0.26 0.23 0.35 0.44 0.36 0.44 0.69 0.78 0.64 0.89 0.47 0.49 0.52 0.64 0.27 0.34 0.69 0.73
(b)
The fuzzy importance of the fault state T-S
x7 x8 x9 x10 x11 x12
0.5 1 0.5 1 0.5 1 0.5 1 0.5 1 0.5 1
( )
0.5Fu ijj
I x
( )
1Fu ijj
I x
0.24 0.28 0.35 0.39 0.35 0.41 0.26 0.23 0.32 0.39 0.36 0.41 0.33 0.31 0.45 0.48 0.32 0.38 0.52 0.64 0.39 0.41 0.29 0.36
(c)
The fuzzy importance of the fault state T-S
x13 x14 x15 x16
0.5 1 0.5 1 0.5 1 0.5 1
( )
0.5Fu ijj
I x
( )
1
Fu ij j
I x
0.38 0.33 0.35 0.44 0.36 0.41 0.26 0.23 0.50 0.67 0.69 0.82 0.54 0.62 0.36 0.49
Table 9. Importance of T-S ambiguity for each basic event.
T-S fuzzy importance x1 x2 x3 x4 x5 x6 x7 x8
( )
0.5
Fu ij j
I x
( )
1
Fu ij j
I x
0.395 0.395 0.335 0.245 0.395 0.4 0.26 0.37 0.55 0.765 0.48 0.58 0.305 0.71 0.32 0.465 T-S fuzzy importance x9 x10 x11 x12 x13 x14 x15 x16
( )
0.5Fu ijj
I x
( )
1Fu ijj
I x
0.38 0.245 0.355 0.39 0.36 0.395 0.39 0.245 0.35 0.48 0.4 0.325 0.585 0.755 0.57 0.425
site. The level of oil level, clutch friction, filter plugging, etc. are all weak points. If there is slippage fault, it should be a key point for troubleshooting during troubleshooting, so as to reduce system failure rate and improve normal reliabil-ity operation.
4. Conclusions
This paper combines fuzzy logic and T-S models with traditional fault trees and proposes the application of T-S fuzzy fault trees to automatic transmission fault diagnosis. The method effectively overcomes the problems of difficulty in ob-taining the failure probability. The uncertainty of the linkage between events, and the inability describes the degree of system failure in the traditional fault tree analysis. The quantitative description is more consistent with the engineering application.
[image:12.595.208.539.389.490.2]DOI: 10.4236/oalib.1104659 13 Open Access Library Journal numbers can greatly improve the accuracy of the analysis using only common fault trees and closer to the real situation.
The T-S fuzzy fault tree analysis example of automatic transmission slip fail-ure, and the expert experience and historical data with expert survey method of confidence index correction are combined, to calculate the fuzzy failure rate of the top event and to get the fuzzy importance of the basic event. Finally the im-pact of the weak links of system reliability is found, which can provide reference for overhaul and fault diagnosis of automatic transmissions.
References
[1] Zhao, D.X. and Qin, R. (2015) The Current Status and Development Trend of Chi-na’s Automobile Transmission. Highways & Automotive Applications, 1, 26-29. [2] Chen, Z. and Peng, J. (2014) Fault Failure Function Analysis Method for Hydraulic
Control System of Electronically Controlled Automatic Transmission. Design and Research, 41, 22-26.
[3] Chen, Y.Y. (2005) Fault Tree Analysis of FTA. Beijing Jiaotong University, Beijing. [4] Tanaka, H., Fan, L.T., Lai, F.S., et al. (1983) Fault-Tree Analysis by Fuzzy
Probabili-ty. IEEE Transactions on Reliability, 32, 453-457.
https://doi.org/10.1109/TR.1983.5221727
[5] Fan, B.Q., Wang, G.H., Wei, X.P., et al. (2012) Research on Fault Diagnosis of Equipment Measurement and Control Equipment Based on T-S Fuzzy Fault Tree. Science, Technology and Engineering, 12, 7386-7390.
[6] Yao, C.Y., Lv, J., Chen, D.N., et al. (2015) Convex Model T-S Fault Tree and Im-portance Analysis Methods. Journal of Mechanical Engineering, 51, 184-192. (In Chinese) https://doi.org/10.3901/JME.2015.24.184
[7] Song, H., Zhang, H.Y. and Wang, X.R. (2005) Fuzzy Fault Tree Analysis Based on T-S Model. Control and Decision, No. 8, 854-859. (In Chinese)
[8] Yao, C.Y., Zhang, Y.Y., Wang, X.F., et al. (2011) Importance Analysis Method of Fuzzy Fault Tree Based on T-S Model. China Mechanical Engineering, 22, 1261-1268. (In Chinese)
[9] Cui, T.T. (2015) Fault Diagnosis of Hydraulic Automatic Transmission Based on Fuzzy Fault Tree. Wireless Internet Technology, 6, 111.
[10] Hu, N. (2014) Troubleshooting Method of Electrical Hydraulic System through the Application of Computer. Chinese Hydraulics & Pneumatics, 204, 62-64.
[11] Zheng, J.J., Lin, C.F. and Zhao, D.A. (2011) Risk Assessment of Shield Tunnel Con-struction Cost Using Fuzzy Fault Tree. Chinese Journal of Geotechnical Engineer-ing, 33, 501-508.